. 2021 Jan 21;184(2):441-459.e25.
doi: 10.1016/j.cell.2020.11.028. Epub 2020 Dec 16.

Lymph nodes are innervated by a unique population of sensory neurons with immunomodulatory potential

Affiliations

Lymph nodes are innervated by a unique population of sensory neurons with immunomodulatory potential

Siyi Huang et al. Cell. .

Abstract

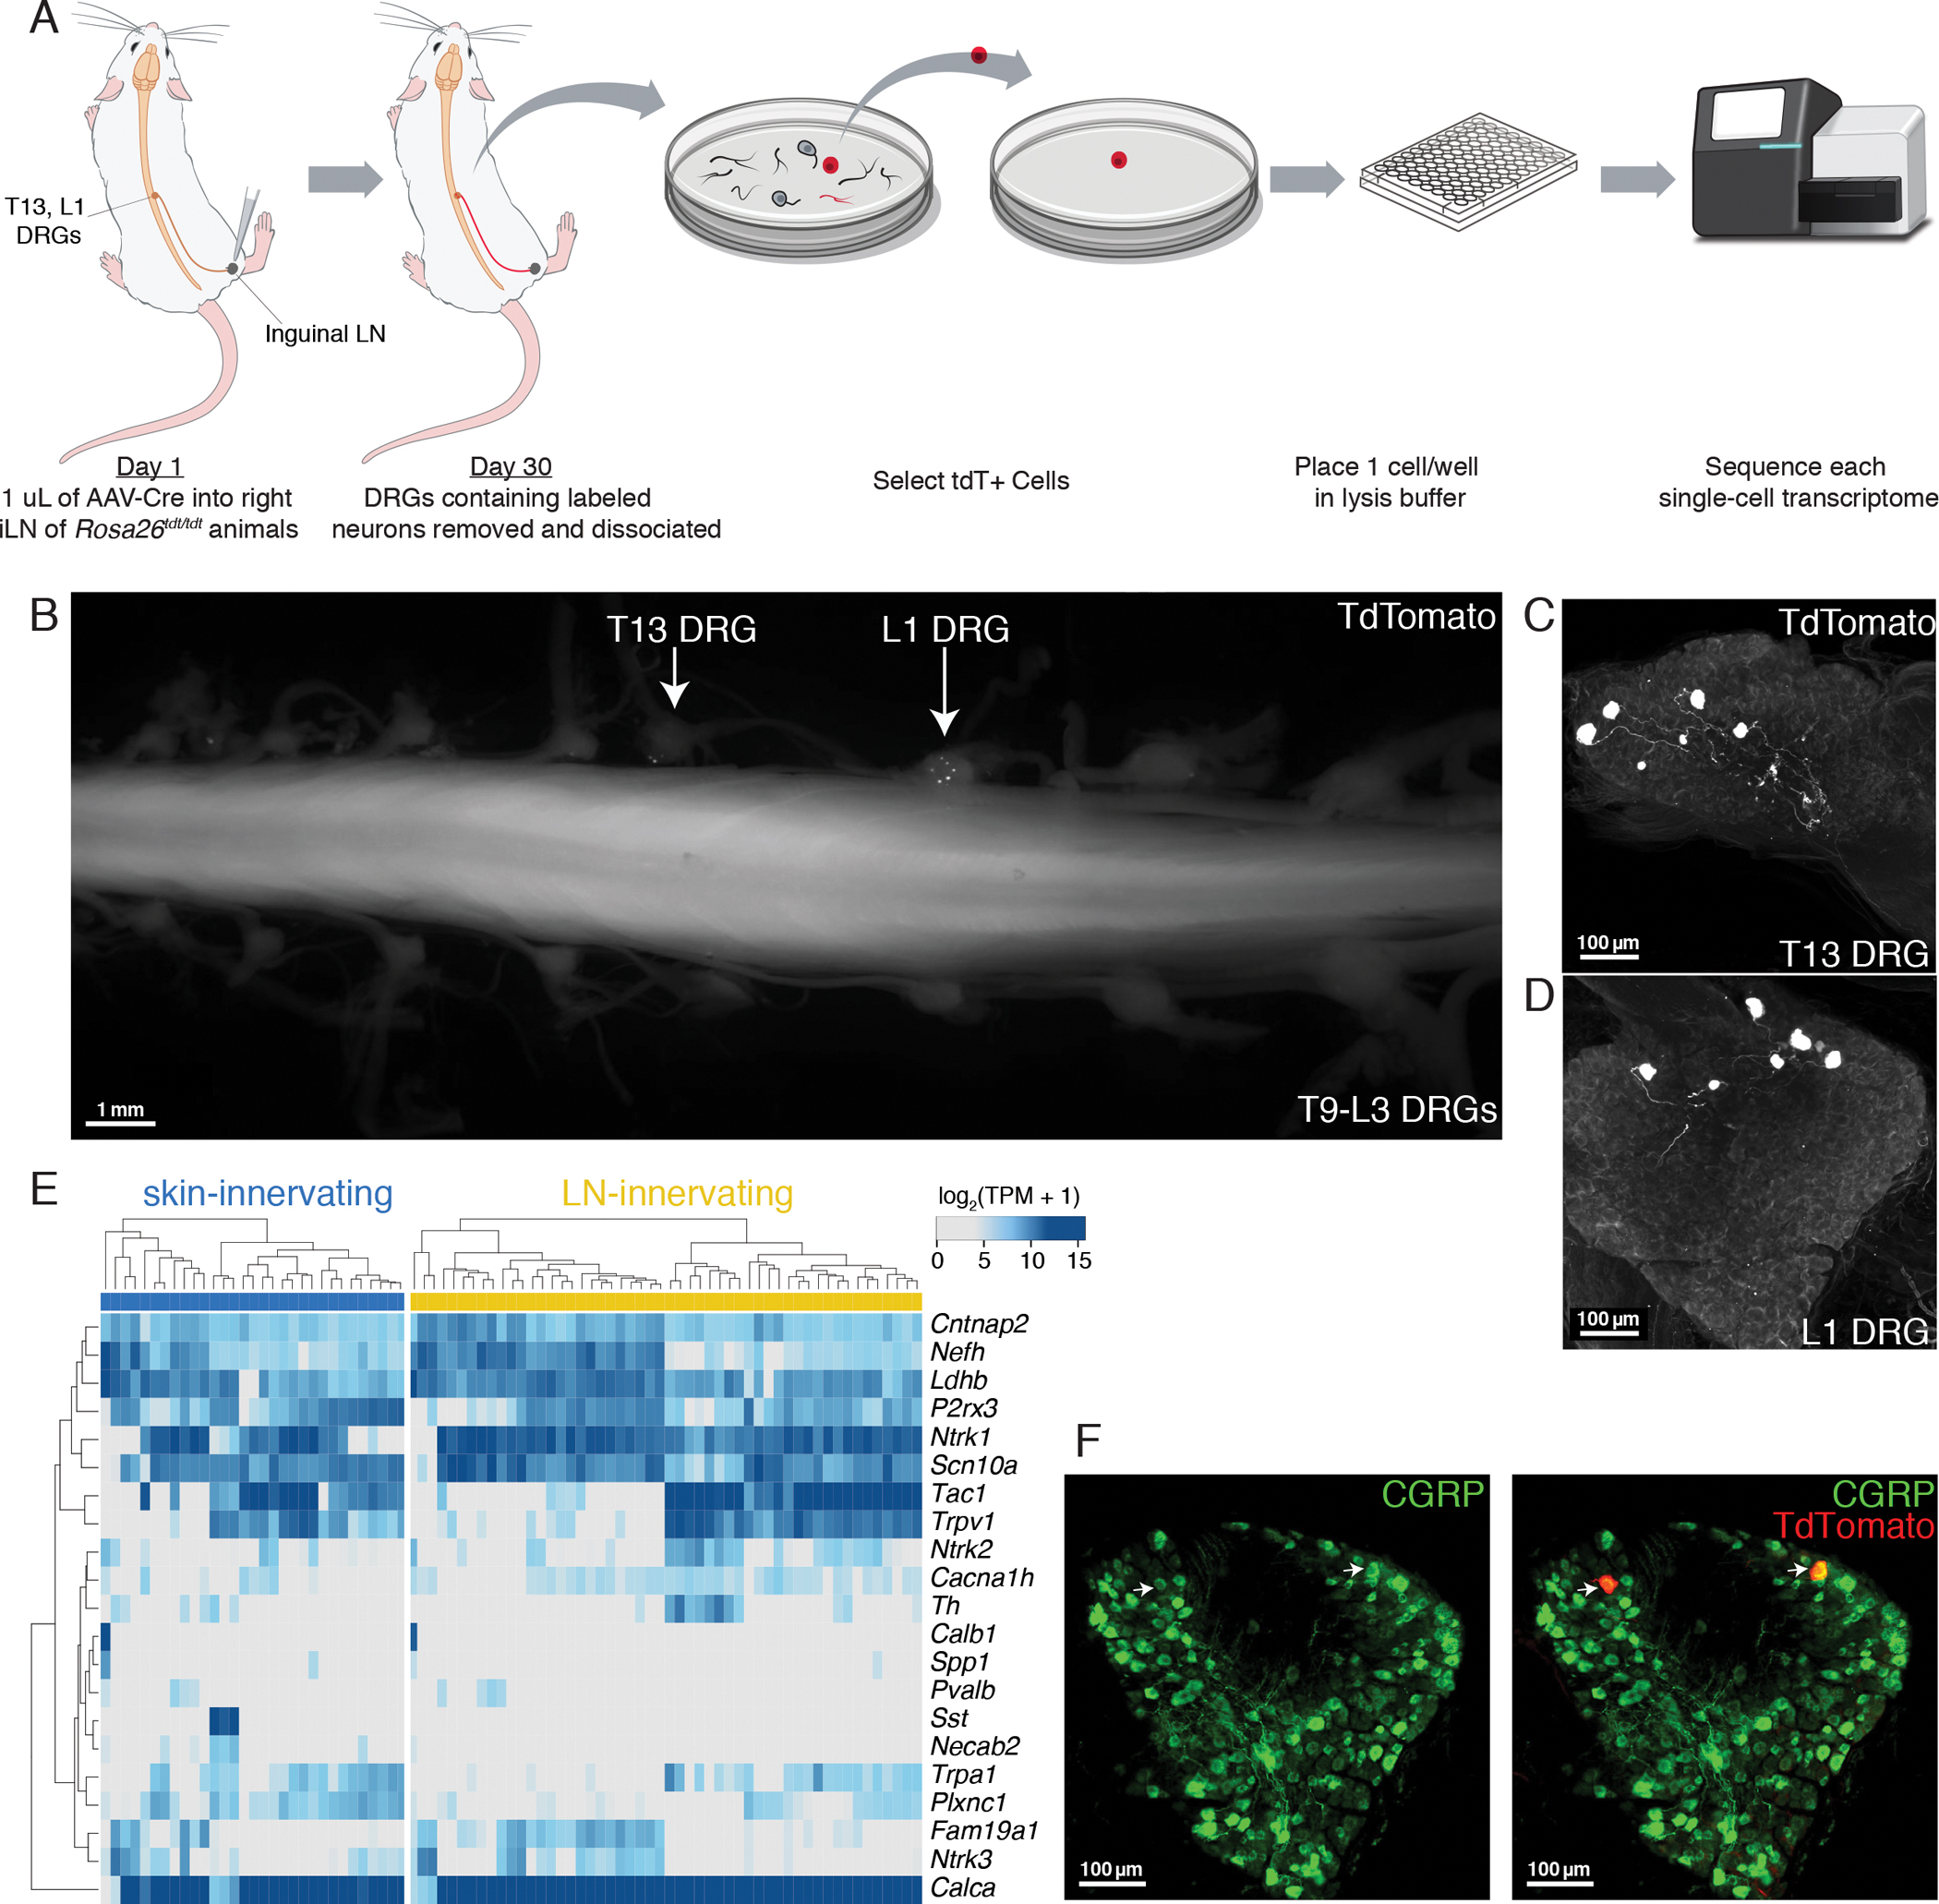
Barrier tissue immune responses are regulated in part by nociceptors. Nociceptor ablation alters local immune responses at peripheral sites and within draining lymph nodes (LNs). The mechanisms and significance of nociceptor-dependent modulation of LN function are unknown. Using high-resolution imaging, viral tracing, single-cell transcriptomics, and optogenetics, we identified and functionally tested a sensory neuro-immune circuit that is responsive to lymph-borne inflammatory signals. Transcriptomics profiling revealed that multiple sensory neuron subsets, predominantly peptidergic nociceptors, innervate LNs, distinct from those innervating surrounding skin. To uncover LN-resident cells that may interact with LN-innervating sensory neurons, we generated a LN single-cell transcriptomics atlas and nominated nociceptor target populations and interaction modalities. Optogenetic stimulation of LN-innervating sensory fibers triggered rapid transcriptional changes in the predicted interacting cell types, particularly endothelium, stromal cells, and innate leukocytes. Thus, a unique population of sensory neurons monitors peripheral LNs and may locally regulate gene expression.

Keywords: lymph node; neuro-immunology; nociceptor; optogenetics; sensory neuron; single-cell RNA-seq.


Conflict of interest statement

Declaration of interests A.K.S. has received compensation for consulting and SAB membership from Honeycomb Biotechnologies, Cellarity, Repertoire Immune Medicines, Ochre Bio, and Dahlia Biosciences. U.H.v.A. has received compensation for consulting and SAB membership from Beam, Cogen Therapeutics, Cygnal, Moderna, Monopteros, Morphic, Rubius, Selecta Biosciences, SQZ, and Synlogic. S.H., C.G.K.Z., A.K.S., and U.H.v.A. are co-inventors on a provisional patent application filed by the Broad Institute (U.S. patent no. 62/916,184) relating to the results described in this manuscript.

Figures

Figure 1:
Figure 1:. Dual innervation of peripheral LNs by sensory and sympathetic neurons
A, B. Representative 3D reconstructions of popLNs from Nav1.8Cre/+ × Rosa26LSL-tdTomato/+ animals stained for sensory neurons and (A) the pan-neuronal marker β3-tubulin or (B) tyrosine hydroxylase (TH) and CD31 to mark sympathetic fibers and vasculature, respectively. Black arrow: LN hilum. C, D. Representative rendered surfaces for tdTomato+ sensory fibers and TH+ sympathetic fibers within popLNs (grey) of saline-treated (C) and 6-OHDA-treated (D) Nav1.8Cre/+ × Rosa26LSL-tdTomato/+ mice. E. Quantification of the effect of 6-OHDA treatment on sensory and sympathetic fiber density. n=5 LN/group, 3 control, 3 OHDA-treated. Sympathetic fibers, p=0.0232 (*); sensory fibers, p=0.2050 (ns) by unpaired t-test. F, G. Representative rendered surfaces for tdTomato+ sensory fibers and TH+ sympathetic fibers within rendered popLNs (grey) of age-matched Nav1.8Cre/+ × Rosa26LSL-tdTomato/+ (F) and Nav1.8-DTA (G) mice. H. Quantification of the effect of DTA-induced developmental ablation of Nav1.8+ neurons on sensory and sympathetic fiber density. n = 6 LN/group, 3 mutant, 3 littermate controls. Sympathetic fibers, p=0.7542 (ns); sensory fibers, p<0.001 (***) by unpaired t-test. See also Figure S1 and Movie 1.
Figure 2:
Figure 2:. Spatial distribution of sensory innervation of peripheral LNs
A. 3D reconstruction of a representative confocal image of tdTomato+ sensory fibers within popLNs of Nav1.8Cre/+; Rosa26LSL-tdTomato/+; Prox1-EGFP animals color-coded by penetration depth (based on the outermost layer of GFP+ LECs). B. Quantification of the penetration depth of tdTomato+ sensory fibers (as in A) as percentage of total intranodal sensory fibers (5 LN, 3 mice). C. Representative confocal section of whole-mount popLNs from Nav1.8Cre/+; Rosa26LSL-tdTomato/+; Prox1-EGFP animals, stained for tdTomato, LYVE-1 and CD45. Arrowheads: sensory fibers. D. 3D reconstruction of a representative confocal image of whole-mount popLNs from Nav1.8Cre/+; Rosa26LSL-tdTomato/LSL-tdTomato animals, stained for tdTomato and smooth muscle cell actin (SMA). Arrow: perivascular plexus. Arrowhead: capsular/subcapsular plexuses. E. 3D reconstruction of a representative confocal image of whole-mount popLNs from Nav1.8Cre; Rosa26LSL-tdTomato/LSL-tdTomato animals, stained for tdTomato, SMA, CD31. Arrow: avascular branch of the perivasular plexus. F. 3D reconstruction of a representative confocal image of whole-mount popLNs from Nav1.8Cre/+; Rosa26LSL-tdTomato/+; Prox1-EGFP animals, stained for tdTomato, GFP, and collagen type 1 to distinguish capsular/subcapsular and parenchymal sensory fibers. See also Figure S2 and Movies 2 and 3.
Figure 3:
Figure 3:. Retrograde labeling of LN-innervating sensory neurons for scRNA-seq
A. Schematic of retrograde labeling from the LN, manual cell sorting and scRNA-seq. B. Representative epifluorescence image of tdTomato+ retrogradely-labeled iLN-innervating DRG neurons in a whole-mount spinal cord-DRG preparation without antibody amplification. C and D. Maximum projection view of confocal images of whole-mount ipsilateral T13 (C) and L1 (D) DRGs from B stained for tdTomato. E. Single-cell expression of neuronal subtype-specific markers. F. Representative confocal sections of whole-mount DRGs containing tdTomato+ retrogradely-labeled iLN-innervating neurons from Rosa26LSL-tdTomato/LSL-tdTomato animals following intranodal injection of AAV-Cre, stained for tdTomato and CGRP. Arrows: retrogradely-labeled iLN-innervating neurons. 88.4% ± 8.7% (mean +/− SEM) tdTomato+ sensory neurons express CGRP (44 neurons, 3 mice). See also Figure S3, and Movie 4.
Figure 4:
Figure 4:. LN-innervating sensory neurons are primarily peptidergic nociceptors
A. UMAP of Sharma Atlas, colored by previously-defined cell types. B. UMAP as in A, with LN-innervating (yellow squares) and skin-innervating (blue squares) neurons projected. C. Predicted cell types for LN-innervating neurons (yellow) or skin-innervating neuron (blue). D. Spearman correlation between LN- or skin-innervating neurons and subsets from the Sharma Atlas. Hierarchical clustering divides LN- and skin-innervating neurons into 4 subtypes: Neuron Type 1 (CGRP-like, black); 2 (CGRP-θ, MRGPRD+ polymodal nociceptors, SST+ pruriceptors -like, tan); 3 (mixed CGRP-like, LTMR-like, turquoise); and 4 (mixed CGRP-ξ, -η, LTMR, proprioceptor-like, dark blue). E. Distribution of Neuron Types 1–4 by innervation target. F. DE genes (Holm adjusted p-value < 0.01). See also Figure S4, Tables S1 and S2.
Figure 5:
Figure 5:. LN-innervating sensory neurons express unique defining markers and functional pathways
A. Heatmap of significantly DE genes (Holm-adjusted p-value < 0.05). B. Volcano plot. Dashed line: q-value = 0.05. C. Violin plots of select genes. D. Enriched gene ontologies of genes upregulated in LN-innervating neurons (yellow) or skin-innervating neurons (blue). Left y axis: number of DE genes; right y axis: p-value (Fisher’s Exact Test). E. Identification of sensitive and specific markers for LN-innervating neurons. F. Quantification of Ptgir and Prokr2 expression in tdTomato+ retrogradely-labeled LN- or skin-innervating neurons (“TdT+”) as percentage of tdTomato+ neurons that are Ptgir+ or Prokr2+ by RNAscope. 3 mice, p=0.0014 (**), p=0.0142 (*), by unpaired t-test. G, H. Volume (G) and Density (H) of sensory innervation of popLNs 3 days after PBS or LPS footpad injection. n=6 LN/group, 6 animals. Volume, p=0.0121 (*); density, p=0.0503 (ns) by Welch’s t-test. I, J. Representative rendered surfaces for tdTomato+ sensory fibers within popLNs (grey) in Nav1.8Cre/+ × Rosa26LSL-tdTomato/LSL-tdTomato mice following footpad injection of PBS (I) or LPS (J). K, L. Volume (K) and Density (L) of sensory innervation of popLNs 3 days after PBS or Pam3CSK4 footpad injection. n = 4 LN/group, 4 animals. Volume, p=0.0076 (**); density, p=0.2249 (ns) by Welch’s t-test. M, N. Representative rendered surfaces for tdTomato+ sensory fibers (red) within popLNs (grey) in Nav1.8Cre/+ × Rosa26LSL-tdTomato/LSL-tdTomato mice following footpad injection of PBS (M) or Pam3CSK4 (N). See also Figure S4 and Table S1.
Figure 6:
Figure 6:. Single-cell transcriptomic profiling of iLN cells nominates likely interacting partners of iLN-innervating sensory neurons
A. Schematic for iLN isolation, dissociation, enrichment for rare iLN cell types. B. tSNE of 9,662 cells, colored by cell type. C. Dot plot of cell-type-specific genes, FDR-corrected p-value < 0.001 by likelihood ratio test. D. Schematic of receptor-ligand analysis. E. Interaction Potential by cell type. Dashed lines: 99% confidence interval over permuted data. F. Cell-cell interaction network. Arrows from the “Neuron”: secreted molecules produced by LN-innervating neurons. Arrows to the “Neuron” node: secreted molecules produced by LN resident cell types. Un-directed lines: ligand-receptor pairs with unknown directionality or bidirectional effects. * p<0.05, ** p<0.01, *** p<0.001 by permutation test. See also Figures S5, S6, and Tables S3, S4.
Figure 7:
Figure 7:. Optogenetics-assisted identification of potential postsynaptic cellular targets of LN-innervating sensory neurons
A. Schematic for optogenetic stimulation of LN-innervating neurons and cell isolation for scRNA-seq. B. tSNE of 10,364 cells (both light-stimulated and control LN in ChR2+ and ChR2− animals), colored by cell type. C-F. DE genes with FDR-adjusted p-value < 0.05 and Cohen’s effect size > 0.2, separated by cell type: C. ChR2− (control) mice, upregulated by light stimulation; D. ChR2− (control) mice, downregulated by light stimulation; E. ChR2+ (experimental) mice, upregulated by light stimulation, omitting genes also induced in ChR2− (control) mice; and, F. ChR2+ (experimental) mice, downregulated by light stimulation, omitting genes also repressed in ChR2− (control) mice. G. Interaction Potential vs. abundance of DE genes (Pearson’s r: 0.52, p = 0.03). H. Heatmap of DE genes between LEC 2 in light-stimulated vs. unstimulated LN in ChR2+ mice. I. Top candidate neuron-interacting molecules in LEC 2 from steady-state LNs (Figure 6). Blue: DE with neuronal stimulation. J. Enriched gene ontologies in LEC 2 following neuronal stimulation. Left y axis: number of DE genes; right y axis: p-value (Fisher’s Exact Test). K and L, Section view of a representative two-photon micrograph of physical contact between tdTomato+ sensory fibers (red) and GFP+ LECs (green) in the medulla (K) and on the ceiling of SCS (L) of whole-mount popLNs from Nav1.8Cre/+; Rosa26LSL-tdTomato/+; Prox1-EGFP animals. See also Figure S7 and Table S3.

Comment in

References

    1. Abrahamsen B, Zhao J, Asante CO, Cendan CM, Marsh S, Martinez-Barbera JP, Nassar MA, Dickenson AH, and Wood JN (2008). The cell and molecular basis of mechanical, cold, and inflammatory pain. Science 321, 702–705. - PubMed
    1. Adams RH, and Eichmann A (2010). Axon guidance molecules in vascular patterning. Cold Spring Harb Perspect Biol 2, a001875. - PMC - PubMed
    1. Aicher TP, Carroll S, Raddi G, Gierahn T, Wadsworth MH 2nd, Hughes TK, Love C, and Shalek AK (2019). Seq-Well: A Sample-Efficient, Portable Picowell Platform for Massively Parallel Single-Cell RNA Sequencing. Methods Mol Biol 1979, 111–132. - PMC - PubMed
    1. Akira S, Uematsu S, and Takeuchi O (2006). Pathogen recognition and innate immunity. Cell 124, 783–801. - PubMed
    1. Andoh T, Nishikawa Y, Yamaguchi-Miyamoto T, Nojima H, Narumiya S, and Kuraishi Y (2007). Thromboxane A2 induces itch-associated responses through TP receptors in the skin in mice. J Invest Dermatol 127, 2042–2047. - PubMed

Publication types