. 2021 Jan 7;184(1):106-119.e14.
doi: 10.1016/j.cell.2020.12.004. Epub 2020 Dec 9.

Genetic Screens Identify Host Factors for SARS-CoV-2 and Common Cold Coronaviruses

Affiliations

Genetic Screens Identify Host Factors for SARS-CoV-2 and Common Cold Coronaviruses

Ruofan Wang et al. Cell. .

Abstract

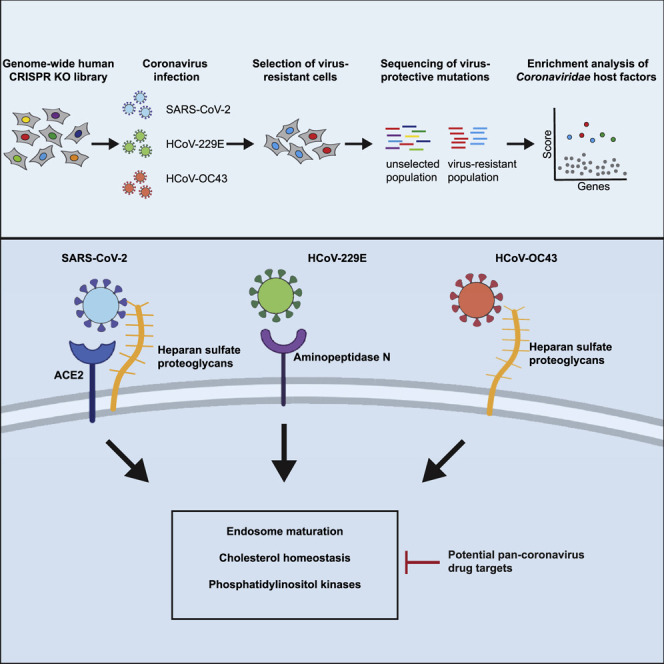
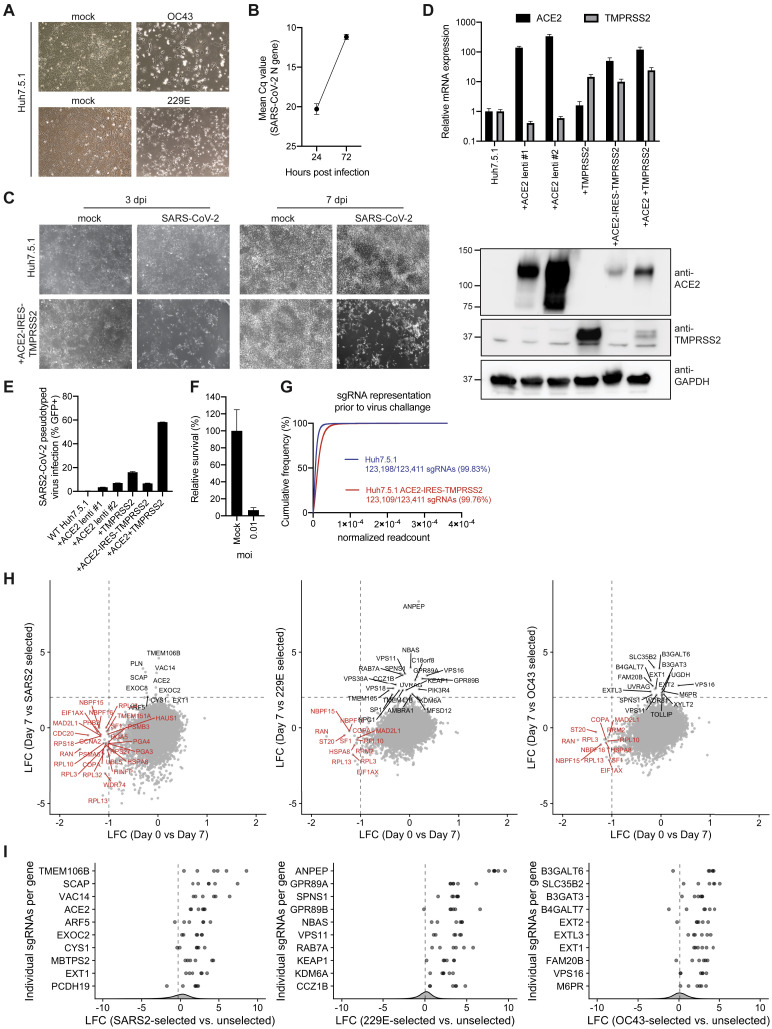
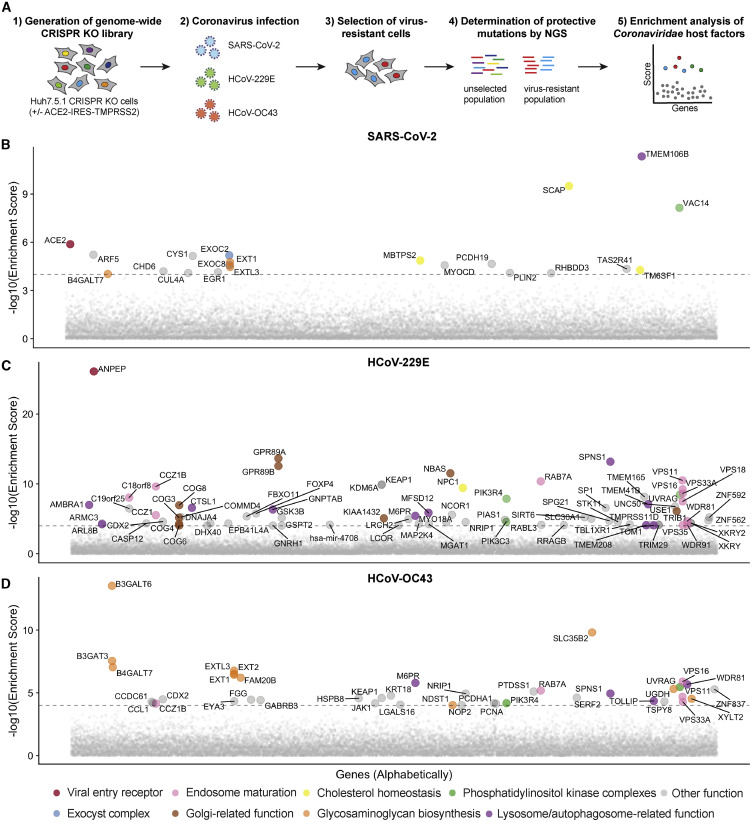
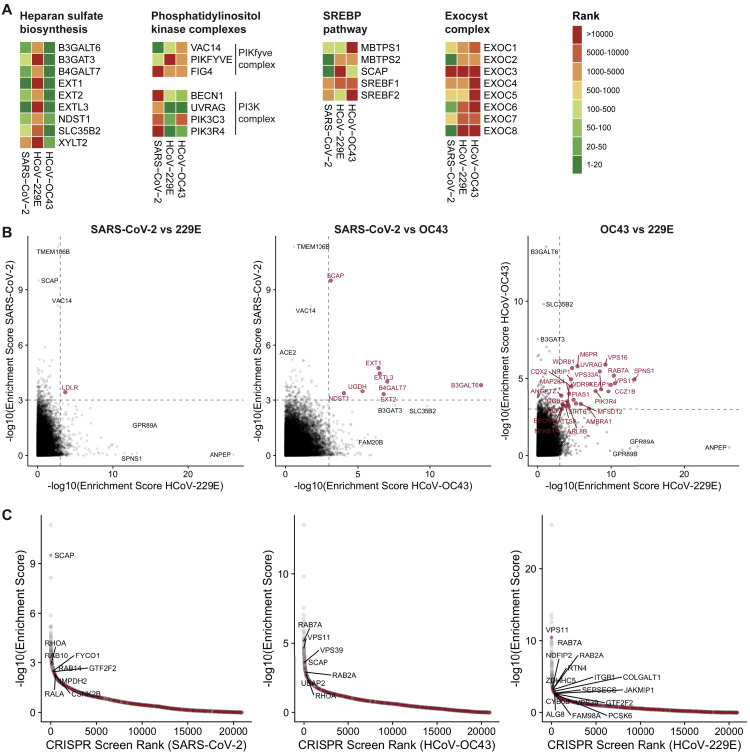
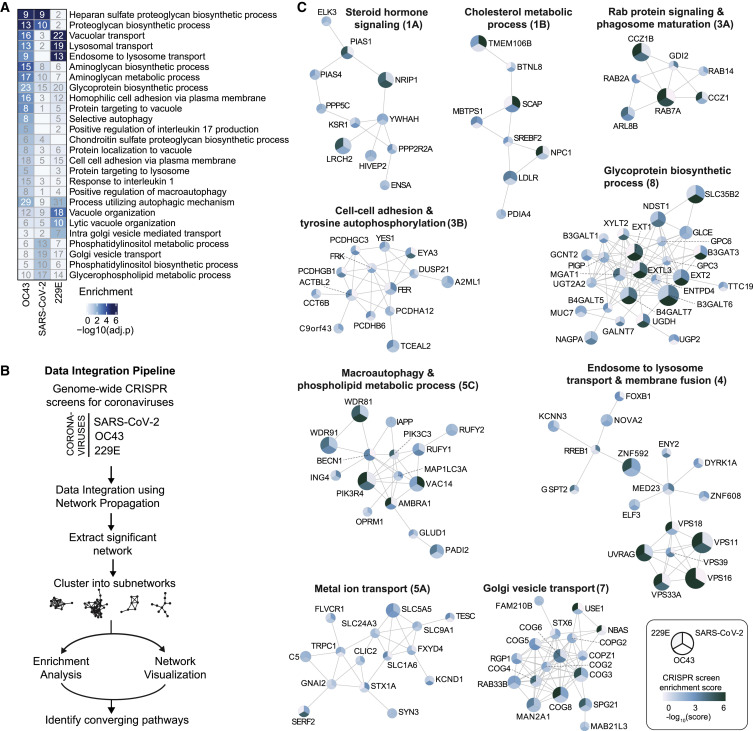
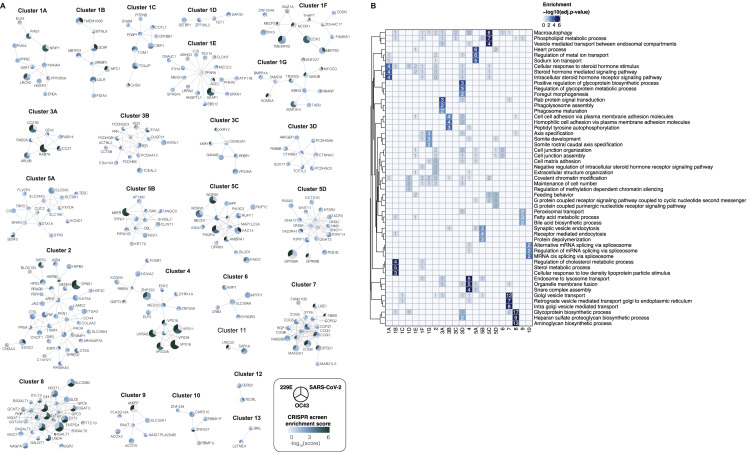
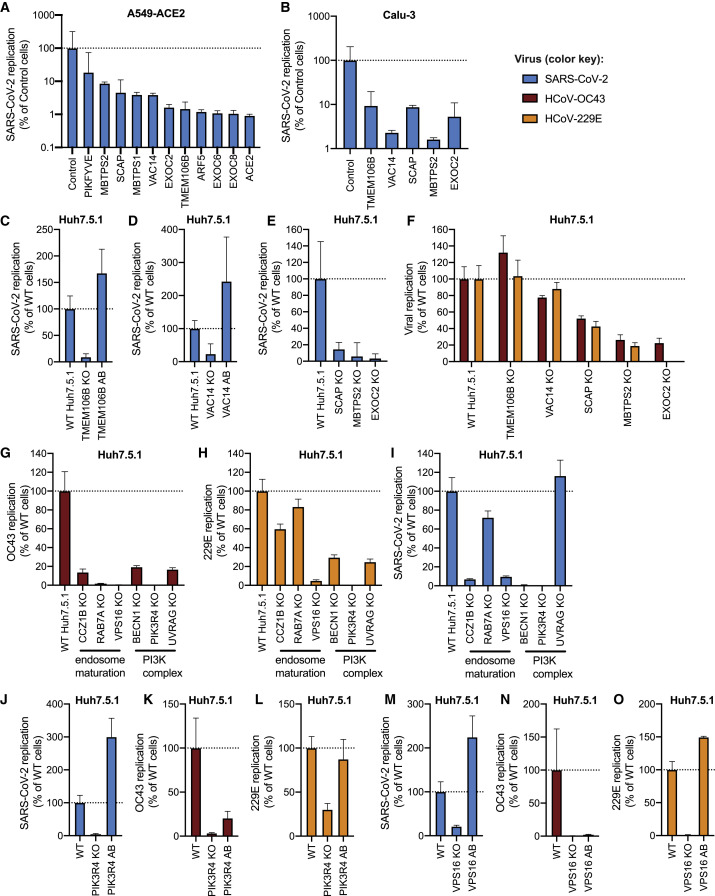
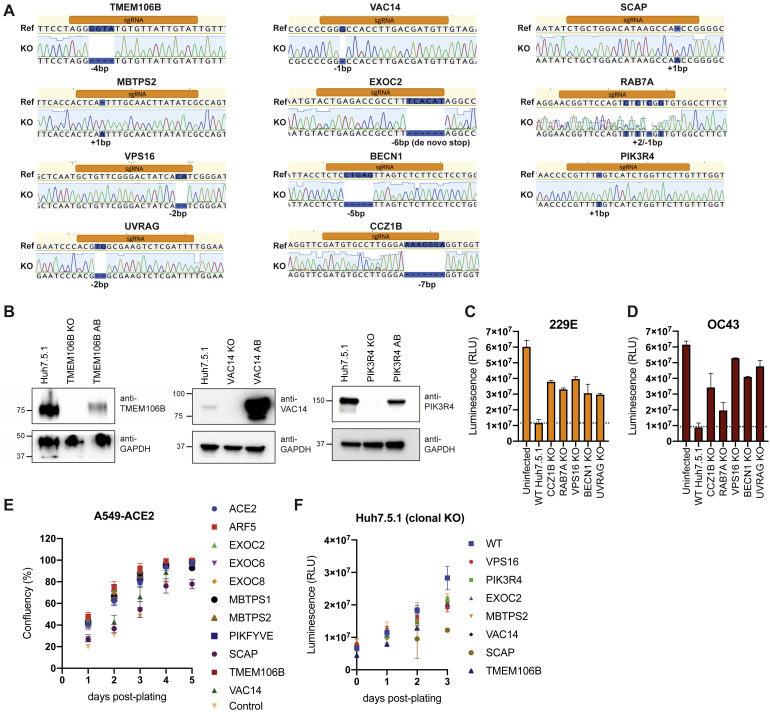
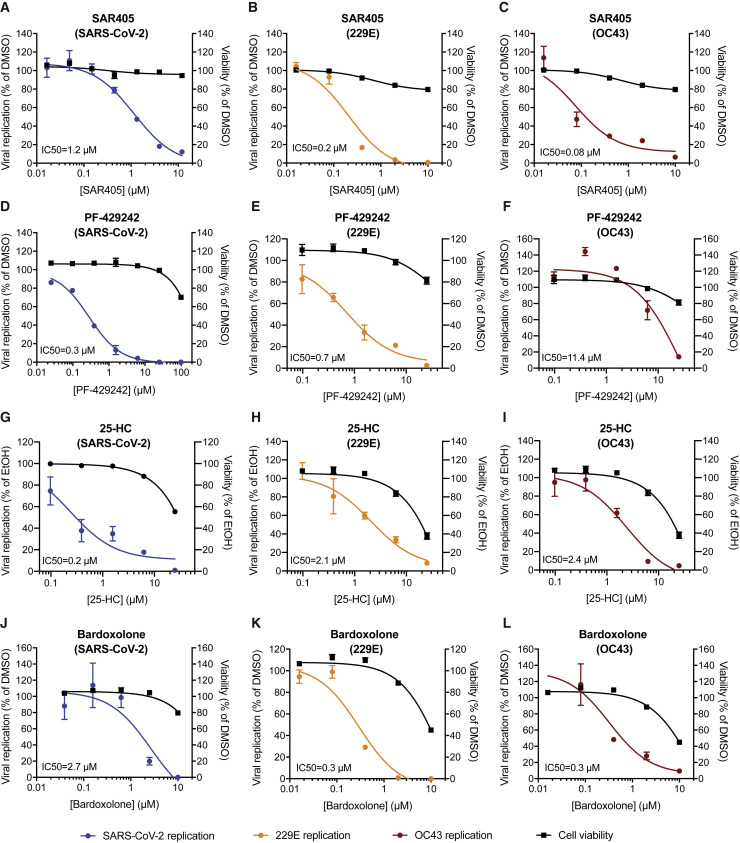
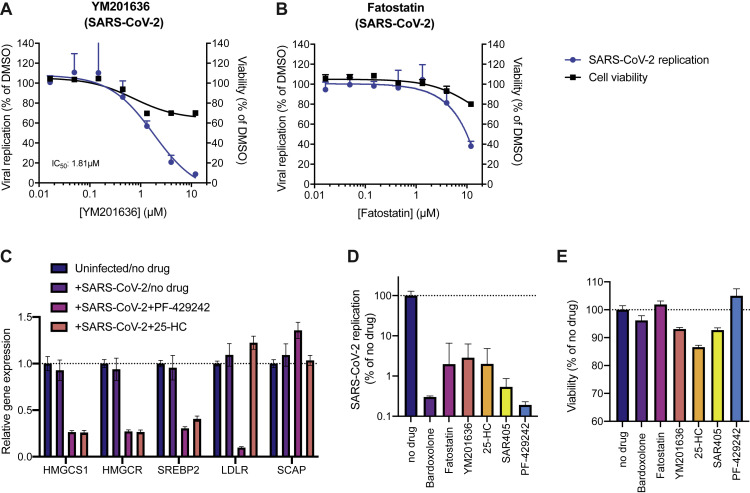
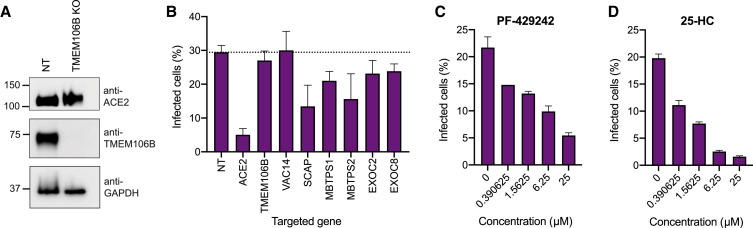
The Coronaviridae are a family of viruses that cause disease in humans ranging from mild respiratory infection to potentially lethal acute respiratory distress syndrome. Finding host factors common to multiple coronaviruses could facilitate the development of therapies to combat current and future coronavirus pandemics. Here, we conducted genome-wide CRISPR screens in cells infected by SARS-CoV-2 as well as two seasonally circulating common cold coronaviruses, OC43 and 229E. This approach correctly identified the distinct viral entry factors ACE2 (for SARS-CoV-2), aminopeptidase N (for 229E), and glycosaminoglycans (for OC43). Additionally, we identified phosphatidylinositol phosphate biosynthesis and cholesterol homeostasis as critical host pathways supporting infection by all three coronaviruses. By contrast, the lysosomal protein TMEM106B appeared unique to SARS-CoV-2 infection. Pharmacological inhibition of phosphatidylinositol kinases and cholesterol homeostasis reduced replication of all three coronaviruses. These findings offer important insights for the understanding of the coronavirus life cycle and the development of host-directed therapies.

Keywords: 229E; COVID-19; CRISPR; OC43; SARS-CoV-2; coronavirus; genetic screen; host factors; host-targeted antivirals; virus-host interactions.


Conflict of interest statement

Declaration of Interests J.C.-S., J.O., and K.H. are employees of Synthego Corporation. All authors declare no other competing interests.

Figures

None
Graphical abstract
Figure S1
Figure S1
Optimization of Phenotypic Selection of Coronavirus-Infected Huh7.5.1 Cells and Quality Control Metrics for CRISPR Screens, Related to Figure 1 (A) Light microscopy images of WT Huh7.5.1 infected with OC43 (7 dpi) and 229E (4 dpi). (B) Quantification of SARS-CoV-2 RNA in WT Huh7.5.1 cells at 24 and 72 hpi by RT-qPCR. Cq values represent mean ± SEM from 3 biological replicates. (C) Light microscopy images of SARS-CoV-2 infected WT Huh7.5.1 cells or Huh7.5.1 cells expressing ACE2-IRES-TMPRSS2 at 3 and 7 dpi. (D) Quantification of ACE2 and TMPRSS2 expression in WT and lentivirally transduced Huh7.5.1 cells by RT-qPCR and western blot. mRNA levels are displayed as means ± SEM from two independent sample collections and are relative to expression in WT cells. Anti-ACE2 and anti-TMPRSS2 antibodies were used to detect protein levels in WT and overexpression cells. GAPDH was used as loading control. Molecular weight markers are indicated on the left. (E) Quantification of infection with pseudotyped lentivirus bearing SARS-CoV-2 spike and expressing GFP by flow cytometry. Values are from two biological samples and are displayed as means ± s.d. (F) Quantification of cell survival by measuring cell number of mock or SARS-CoV-2 infected Huh7.5.1-ACE2-IRES-TMPRSS2 cells (moi = 0.01) at 3 dpi. Values are from two independent wells and are displayed as means ± s.d. (G) sgRNA representation and distribution in the genome-wide CRISPR KO libraries at day 7 post-transduction (prior to coronavirus infection). Reads for each sgRNA were normalized to the total number of reads. (H) Gene-level log fold changes (LFCs) between the lentiviral CRISPR library transduced into target cells at day 0 and the KO library cell population at day 7 post-transduction (x axis) versus gene-level LFCs between the KO library cell population at day 7 post-transduction (prior to virus infection) and after phenotypic selection by coronavirus infection (y axis). Gene knockouts showing growth defects in absence of virus challenge are highlighted in red. (I) LFCs for the individual sgRNAs for the top 10 scoring genes from each CRISPR screen between the starting cell populations and the virus-selected cell populations. Overall sgRNA distribution is shown at the bottom of the graph and dotted line indicates mean LFC of all sgRNAs.
Figure 1
Figure 1
Genome-wide Loss-of-Function Screens in Human Cells Identify Host Factors Important for Infection by SARS-CoV-2, 229E, and OC43 (A) Schematic of CRISPR-based KO screens for the identification of coronavirus host factors. Huh7.5.1-Cas9 (with bicistronic ACE2-IRES-TMPRSS2 construct for SARS-CoV-2 and without for 229E and OC43 screen) were mutagenized using a genome-wide single-guide RNA (sgRNA) library. Mutant cells were infected with each coronavirus separately and virus-resistant cells were harvested 10–14 days post infection (dpi). The abundance of each sgRNA in the starting and selected population was determined by high-throughput sequencing and a gene enrichment analysis was performed. (B) Gene enrichment for CRISPR screen of SARS-CoV-2 infection. Enrichment scores were determined by MaGECK analysis and genes were colored by biological function. Dotted line indicates −log10(Enrichment Score) = 4. The SARS-CoV-2 screen was performed once. All genes and their enrichment scores can be found in Table S1. (C) Gene enrichment for CRISPR screen of 229E infection. The 229E screen was performed twice and combined MaGECK scores are displayed. (D) Gene enrichment for CRISPR screen of OC43 infection. The OC43 screen was performed twice and combined MaGECK scores are displayed.
Figure S2
Figure S2
Comparison of CRISPR Screens Reveals Common and Distinct Host Factors across SARS-CoV-2, 229E, and OC43, Related to Figure 1 (A) CRISPR screen ranking of genes (according to MaGECK enrichment scores in Table S1) clustered in specific cellular pathway or complexes across the three CRISPR screens. (B) Pairwise comparisons of gene enrichments between CRISPR screens. Dotted lines indicate -log10(Enrichment score) = 3. Genes that scored above the threshold in both screens are highlighted in red. (C) Representation of the 332 high-confidence SARS-CoV-2 protein-protein interactome hits from (Gordon et al., 2020a) (highlighted in red) within the ranked CRISPR screen data for SARS-CoV-2, OC43 and 229E infection. Gene labels are added for interactome hits that scored in the top 500 of the CRISPR screens.
Figure 2
Figure 2
Gene Ontology Analysis and Network Propagation Highlight Pathways and Biological Networks Important for Coronavirus Infection (A) Gene Ontology (GO) enrichment analysis was performed on significant hits from the individual CRISPR screens (MaGECK enrichment score ≤ 0.005). p values were calculated by hypergeometric test and a false discovery rate was used to account for multiple hypothesis testing. The top GO terms of each screen were selected for visualization. A complete list of significant GO terms can be found in Table S2. (B) Data integration pipeline for network propagation of identified host factor genes. Unthresholded CRISPR screen enrichment scores served as initial gene labels for network propagation using Pathway Commons. Separately propagated networks were integrated gene-wise (via multiplication) to identify biological networks that are shared between all three datasets. Genes found to be significant in the propagation were extracted, clustered into smaller subnetworks, and annotated using GO enrichment analysis (see STAR Methods). (C) Selected biological subnetwork clusters from network propagation. Cluster title indicates the most significant biological function(s) for each cluster. Circle size represents p value from network propagation permutation test (see STAR Methods and Table S3). The original enrichment score of a gene in each CRISPR screen is indicated by color scale within the circle. The entire set of identified clusters is displayed in Figure S3A. (#) is the cluster number, which refers to the GO enrichment analysis of biological processes in Figure S3B and Table S2.
Figure S3
Figure S3
Network Propagation of CRISPR Screen Hits Reveals Functional Clusters with Distinct Biological Functions, Related to Figure 2 (A) Biological subclusters from network propagation. Cluster number refers to the enrichment analysis of biological processes for each cluster, displayed in Figure S3B. Circle size represents p value from integrative network propagation permutation test (see Methods and Table S3). The CRISPR screen enrichment score of a gene from each screen is indicated by color scale within the circle. (B) Gene ontology (GO) enrichment analysis was performed on each subcluster from the network propagation. P values were calculated by hypergeometric test and a false-discovery rate was used to account for multiple hypothesis testing. The entire set of enriched biological processes for each subcluster is listed in Table S2.
Figure 3
Figure 3
KO of Candidate Host Factor Genes Reduces Coronavirus Infection (A) Quantitative reverse-transcriptase PCR (RT-qPCR) quantification of intracellular SARS-CoV-2 levels in RNP-edited A549-ACE2 cells. A non-targeting sgRNA was used as control. Cells were infected using MOI = 0.1 and harvested at 72 h post-infection (hpi). (B) RT-qPCR quantification of intracellular SARS-CoV-2 levels in Calu-3 cells lentivirally transduced with Cas9/sgRNA cassettes targeting the indicated genes. A non-targeting sgRNA was used as control. Cells were infected using MOI = 0.1 and harvested at 48 hpi. (C) RT-qPCR quantification of intracellular SARS-CoV-2 levels in WT Huh7.5.1, TMEM106B KO, or TMEM106B KO cells with TMEM106B cDNA add-back (AB). Cells were infected using MOI = 0.1 and harvested at 24 hpi. (D) RT-qPCR quantification of intracellular SARS-CoV-2 levels in WT Huh7.5.1, VAC14 KO, or VAC14 KO cells with VAC14 cDNA AB. Cells were infected using MOI = 0.1 and harvested at 24 hpi. (E) RT-qPCR quantification of intracellular SARS-CoV-2 levels in WT Huh7.5.1, SCAP KO, MBTPS2 KO, or EXOC2 KO cells. Cells were infected using MOI = 0.1 and harvested at 24 hpi. (F) RT-qPCR quantification of intracellular OC43 and 229E RNA levels in WT and TMEM106B, VAC14, SCAP, MBTPS2, or EXOC2 KO Huh7.5.1 cells. Cells were infected using MOI = 0.05 (229E) and MOI = 3 (OC43) and harvested at 48 hpi. (G–I) RT-qPCR quantification of intracellular viral RNA for (G) OC43, (H) 229E, or (I) SARS-CoV-2 in WT Huh7.5.1 cells or cell lines deficient in CCZ1B, RAB7A, VPS16, BECN1, PIK3R4, or UVRAG. (J–L) RT-qPCR quantification of intracellular viral RNA for (J) SARS-CoV-2, (K) OC43, or (L) 229E in WT, PIK3R4 KO, or PIK3R4 KO cells with PIK3R4 cDNA AB. (M–O) RT-qPCR quantification of intracellular viral RNA for (M) SARS-CoV-2, (N) OC43, or (O) 229E in WT, VPS16 KO, or VPS16 KO cells with VPS16 cDNA AB. For SARS-CoV-2 infection, viral N gene transcripts were normalized to cellular RNaseP. For OC43 and 229E experiments, viral RNA was normalized to 18S RNA. For all RT-qPCR experiments, results are displayed relative to infection in WT cells, and data represent means ± SEM from three biological samples.
Figure S4
Figure S4
Characterization of Gene-Edited Cells, Related to Figure 3 (A) Genotyping of clonal Huh7.5.1. Targeted loci were PCR-amplified, Sanger-sequenced and aligned to WT reference sequence. Frameshifts are highlighted in blue. (B) Western blot analysis of WT, KO and KO cells with respective cDNA add-backs (AB) for TMEM106B, VAC14 and PIK3R4. Lysates to probe for TMEM106B were prepared under non-reducing conditions and bands appear as dimers. GAPDH was used as loading control. (C) Cell viability measurement of 229E infected WT and KO Huh7.5.1 cells. Cells were infected with 229E (moi = 0.05) and viability was determined 8 dpi using Cell Titer Glo. Values are displayed as means ± SD from three biological samples. (D) Cell viability measurement of OC43 infected WT and KO Huh7.5.1 cells. Cells were infected with OC43 (moi = 3) and viability was determined 8 dpi using Cell Titer Glo. Values are displayed as means ± SD from two biological samples. (E) Analysis of cell proliferation of RNP-edited A549-ACE2 cells. Cells were plated in 96-wells and confluency was measured daily using an automated microscope. Values are displayed as means ± SD from four separate wells per cell line. (F) Analysis of cell proliferation of WT and clonal KO Huh7.5.1 cells. Cells were plated in 96-wells and cell proliferation was measured daily using Cell Titer Glo. Values are displayed as means ± SD from three separate wells per cell line per time point.
Figure 4
Figure 4
Pharmacological Inhibition of Identified Host Factors Decreases Infection with SARS-CoV-2 and Common Cold Coronaviruses (A–C) SAR405 (PI3K inhibitor) dose-response curves for (A) SARS-CoV-2, (B) 229E, and (C) OC43 replication in Huh7.5.1 cells and for cell viability of SAR405-treated cells. (D–F) PF-429242 (MBTPS1 inhibitor) dose-response curves for (D) SARS-CoV-2, (E) 229E, and (F) OC43 replication in Huh7.5.1 cells and for cell viability of PF-429242 treated cells. (G–I) 25-hydroxycholesterol (25-HC) dose-response curves for (G) SARS-CoV-2, (H) 229E, and (I) OC43 replication in Huh7.5.1 cells and for cell viability of 25-HC treated cells. (J and K) Bardoxolone (KEAP1-NRF2 activator) dose-response curves for (J) SARS-CoV-2, (K) 229E, and (L) OC43 replication in Huh7.5.1 cells and for cell viability of Bardoxolone-treated cells. For all experiments, compounds were added simultaneously with virus. Viral RNA was quantified after 24 hpi (SARS-CoV-2) or 48 hpi (229E and OC43) using RT-qPCR. SARS-CoV-2 RNA was normalized to RnaseP, and 229E and OC43 RNA was normalized to 18S RNA. Values represent means ± SEM relative to untreated cells. Cell viability was assessed in parallel in drug-treated, uninfected cells and is displayed as means ± SEM relative to DMSO or EtOH treated cells. Non-linear curves were fitted with least-squares regression using GraphPad Prism 8 and IC50 was determined. All experiments were performed in three biological replicates.
Figure S5
Figure S5
Pharmacological Inhibition of Host Factors in Huh7.5.1 and Calu-3 cells, and Validation of On-Target Activity of SREBP Pathway Inhibitors, Related to Figure 4 (A and B) Dose-response curves of the effect of (A) YM201636 and (B) Fatostatin on SARS-CoV-2 replication in Huh7.5.1 cells and on cell viability of drug treated cells. Viral RNA was quantified after 24 hpi using RT-qPCR and normalized to RnaseP. Values represent means ± SEM relative to DMSO treated cells. Non-linear curves were fitted with least-squares regression using GraphPad Prism 8 and IC50 was determined. All experiments were performed with 3 biological replicates. (C) Gene expression analysis of the SREBP-regulated cholesterol biosynthesis genes 3-Hydroxy-3-Methylglutaryl-CoA Synthase 1 (HMGCS1) and HMG-CoA reductase (HMGCR) as well as SREBP2, LDLR and SCAP in uninfected/no drug, infected/no drug and infected/drug-treated conditions (25 μM PF-429242 and 6.25 μM 25-HC) in Huh7.5.1 cells at 24 h post-infection/treatment. mRNA levels are displayed as means ± SEM from three biological replicates and are relative to expression in uninfected/no drug cells. (D) RT-qPCR quantification of intracellular SARS-CoV-2 levels in drug-treated Calu-3 cells. Cells were infected using moi = 0.1, treated with 5 μM at time of infection and harvested at 24 hpi. Values represent means ± SEM from three biological replicates and are relative to the no drug (DMSO treated) condition. (E) Cell viability of drug-treated Calu-3 cells 24 h after addition of compounds using Cell Titer Glo. Values are displayed as means ± SD from three biological replicates.
Figure 5
Figure 5
Cholesterol Is Required for S-Mediated Entry of SARS-CoV-2 (A) Western blot of ACE2 and TMEM106B levels from Huh7.5.1-ACE2/TMPRSS2 cells edited with non-targeting (NT) or TMEM106B-targeting RNPs. Lysates were prepared under non-reducing conditions and TMEM106B appears as dimer. GAPDH was used as loading control. Molecular weight markers are indicated on the left. (B) VSV-SARS-CoV-2-S infection of clonal Huh7.5.1-ACE2/TMPRSS2 cells edited with RNPs targeting the specified genes. A NT sgRNA was used as control. Cells were harvested at 8 hpi and analyzed for GFP+ cells using flow cytometry. Values represent five biological replicates and are displayed as means ± SD (C) VSV-SARS-CoV-2-S infection of PF-429242-treated cells. Huh7.5.1-ACE2/TMPRSS2 cells were pretreated with different concentrations of PF-429242 for 2 h and then infected with virus. Cells were analyzed by flow cytometry at 14 hpi and analyzed for GFP+ cells using flow cytometry. Values represent two biological replicates at each concentration and are displayed as means ± SD (D) VSV-SARS-CoV-2-S infection of 25-HC-treated cells. Huh7.5.1-ACE2/TMPRSS2 cells were pretreated with different concentrations of 25-HC for 2 h and then infected with virus. Cells were analyzed by flow cytometry at 14 hpi. Values represent two biological replicates at each concentration and are displayed as means ± SD

Update of

Comment in

References

    1. Aoki T., Ichimura S., Itoh A., Kuramoto M., Shinkawa T., Isobe T., Tagaya M. Identification of the neuroblastoma-amplified gene product as a component of the syntaxin 18 complex implicated in Golgi-to-endoplasmic reticulum retrograde transport. Mol. Biol. Cell. 2009;20:2639–2649. - PMC - PubMed
    1. Baggen J., Persoons L., Jansen S., Vanstreels E., Jacquemyn M., Jochmans D., Neyts J., Dallmeier K., Maes P., Daelemans D. Identification of TMEM106B as proviral host factor for SARS-CoV-2. BioRxiv. 2020 doi: 10.1101/2020.09.28.316281. - DOI
    1. Balderhaar H.J., Ungermann C. CORVET and HOPS tethering complexes - coordinators of endosome and lysosome fusion. J. Cell Sci. 2013;126:1307–1316. - PubMed
    1. Beier K.T., Saunders A., Oldenburg I.A., Miyamichi K., Akhtar N., Luo L., Whelan S.P.J., Sabatini B., Cepko C.L. Anterograde or retrograde transsynaptic labeling of CNS neurons with vesicular stomatitis virus vectors. Proc. Natl. Acad. Sci. USA. 2011;108:15414–15419. - PMC - PubMed
    1. Bekerman E., Einav S. Infectious disease. Combating emerging viral threats. Science. 2015;348:282–283. - PMC - PubMed

Publication types

MeSH terms