

Chronic ethanol exposure differentially alters neuronal function in the medial prefrontal cortex and dentate gyrus
- PMID: 33333103
- PMCID: PMC7927349
- DOI: 10.1016/j.neuropharm.2020.108438
Chronic ethanol exposure differentially alters neuronal function in the medial prefrontal cortex and dentate gyrus
Abstract
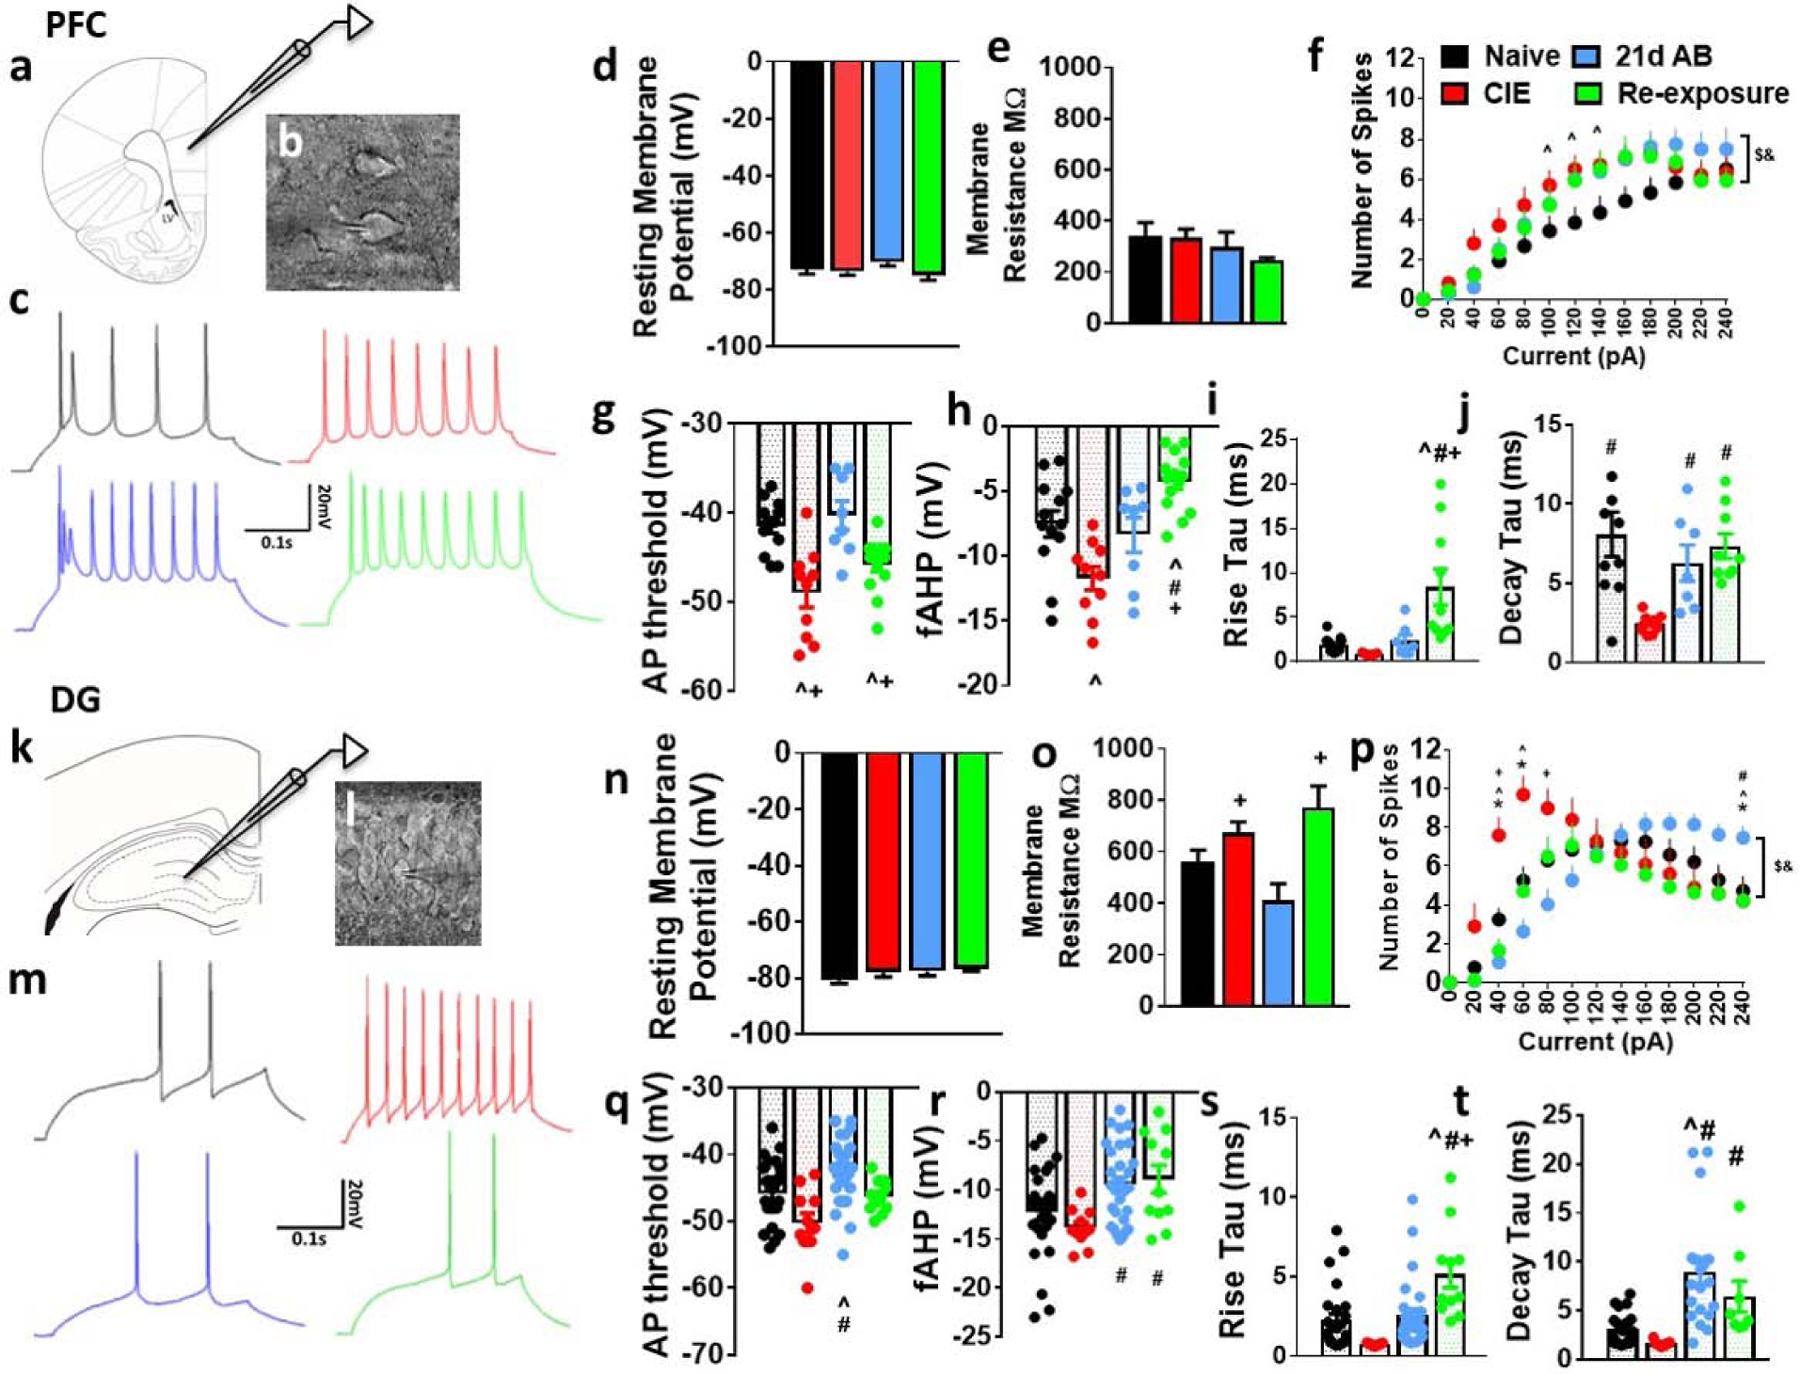
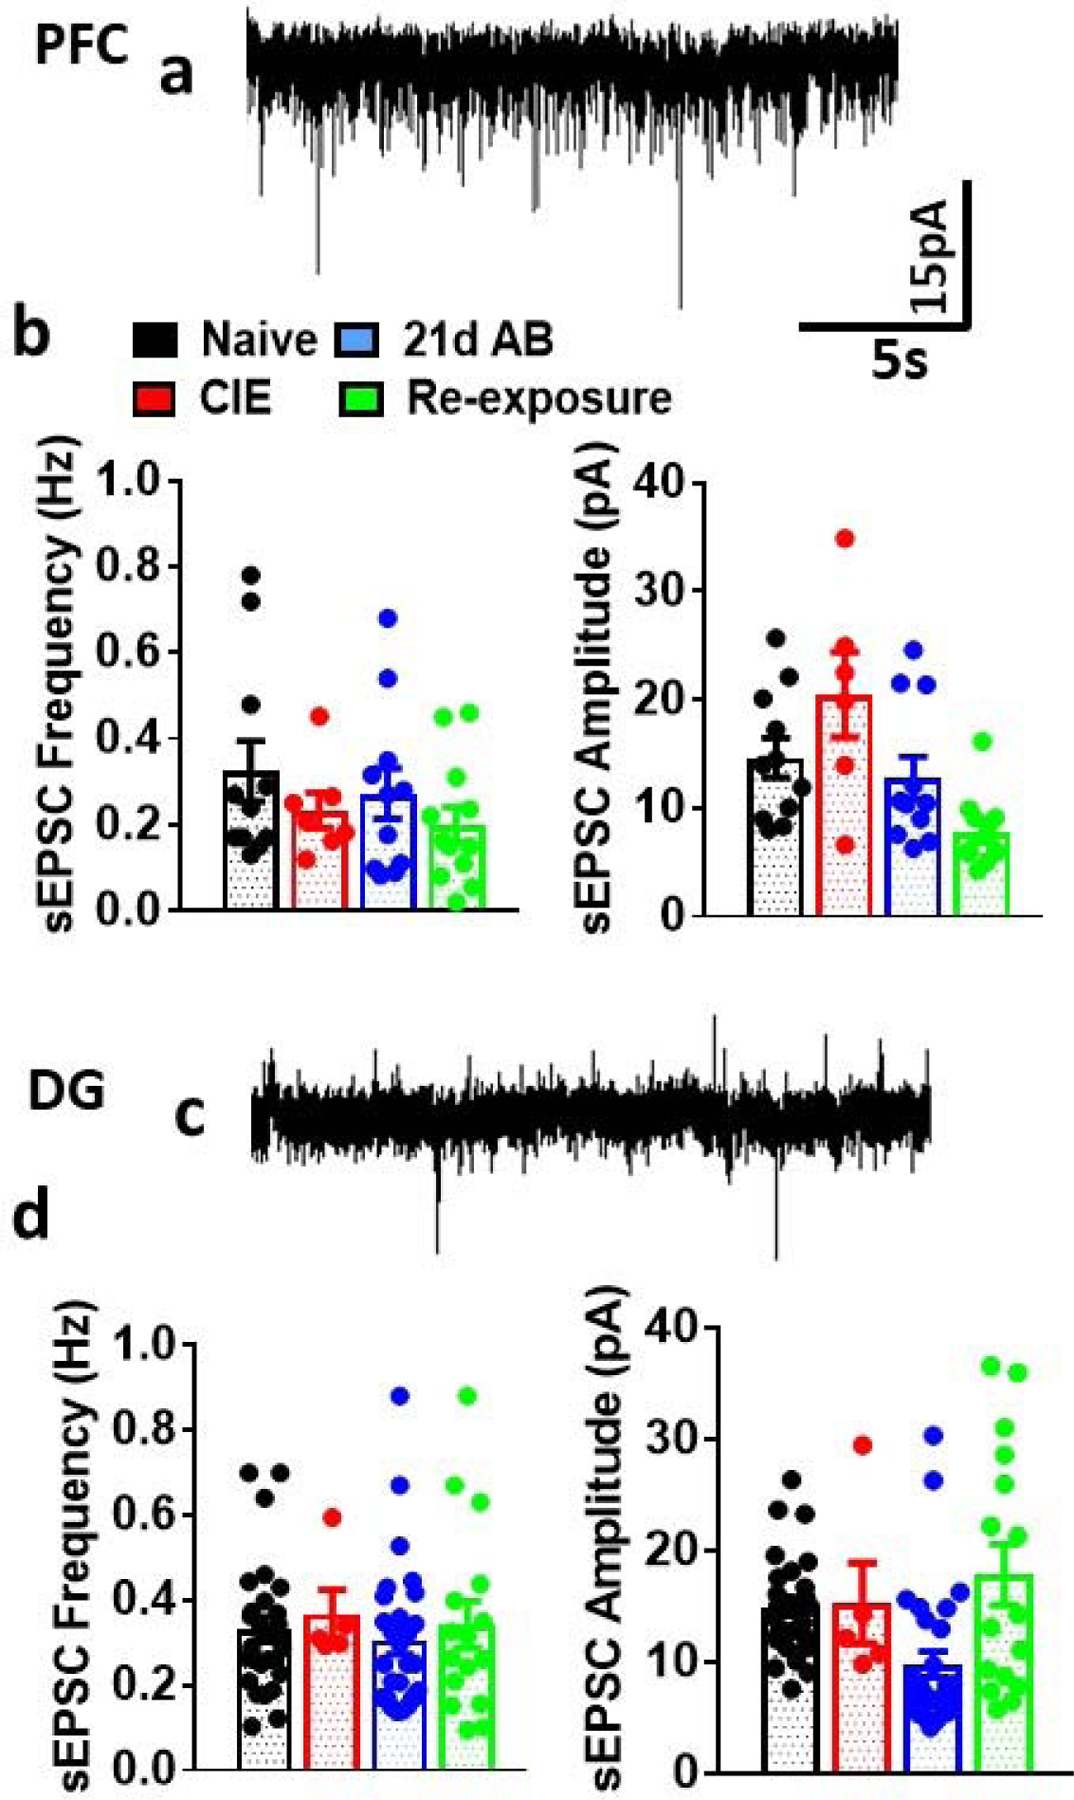
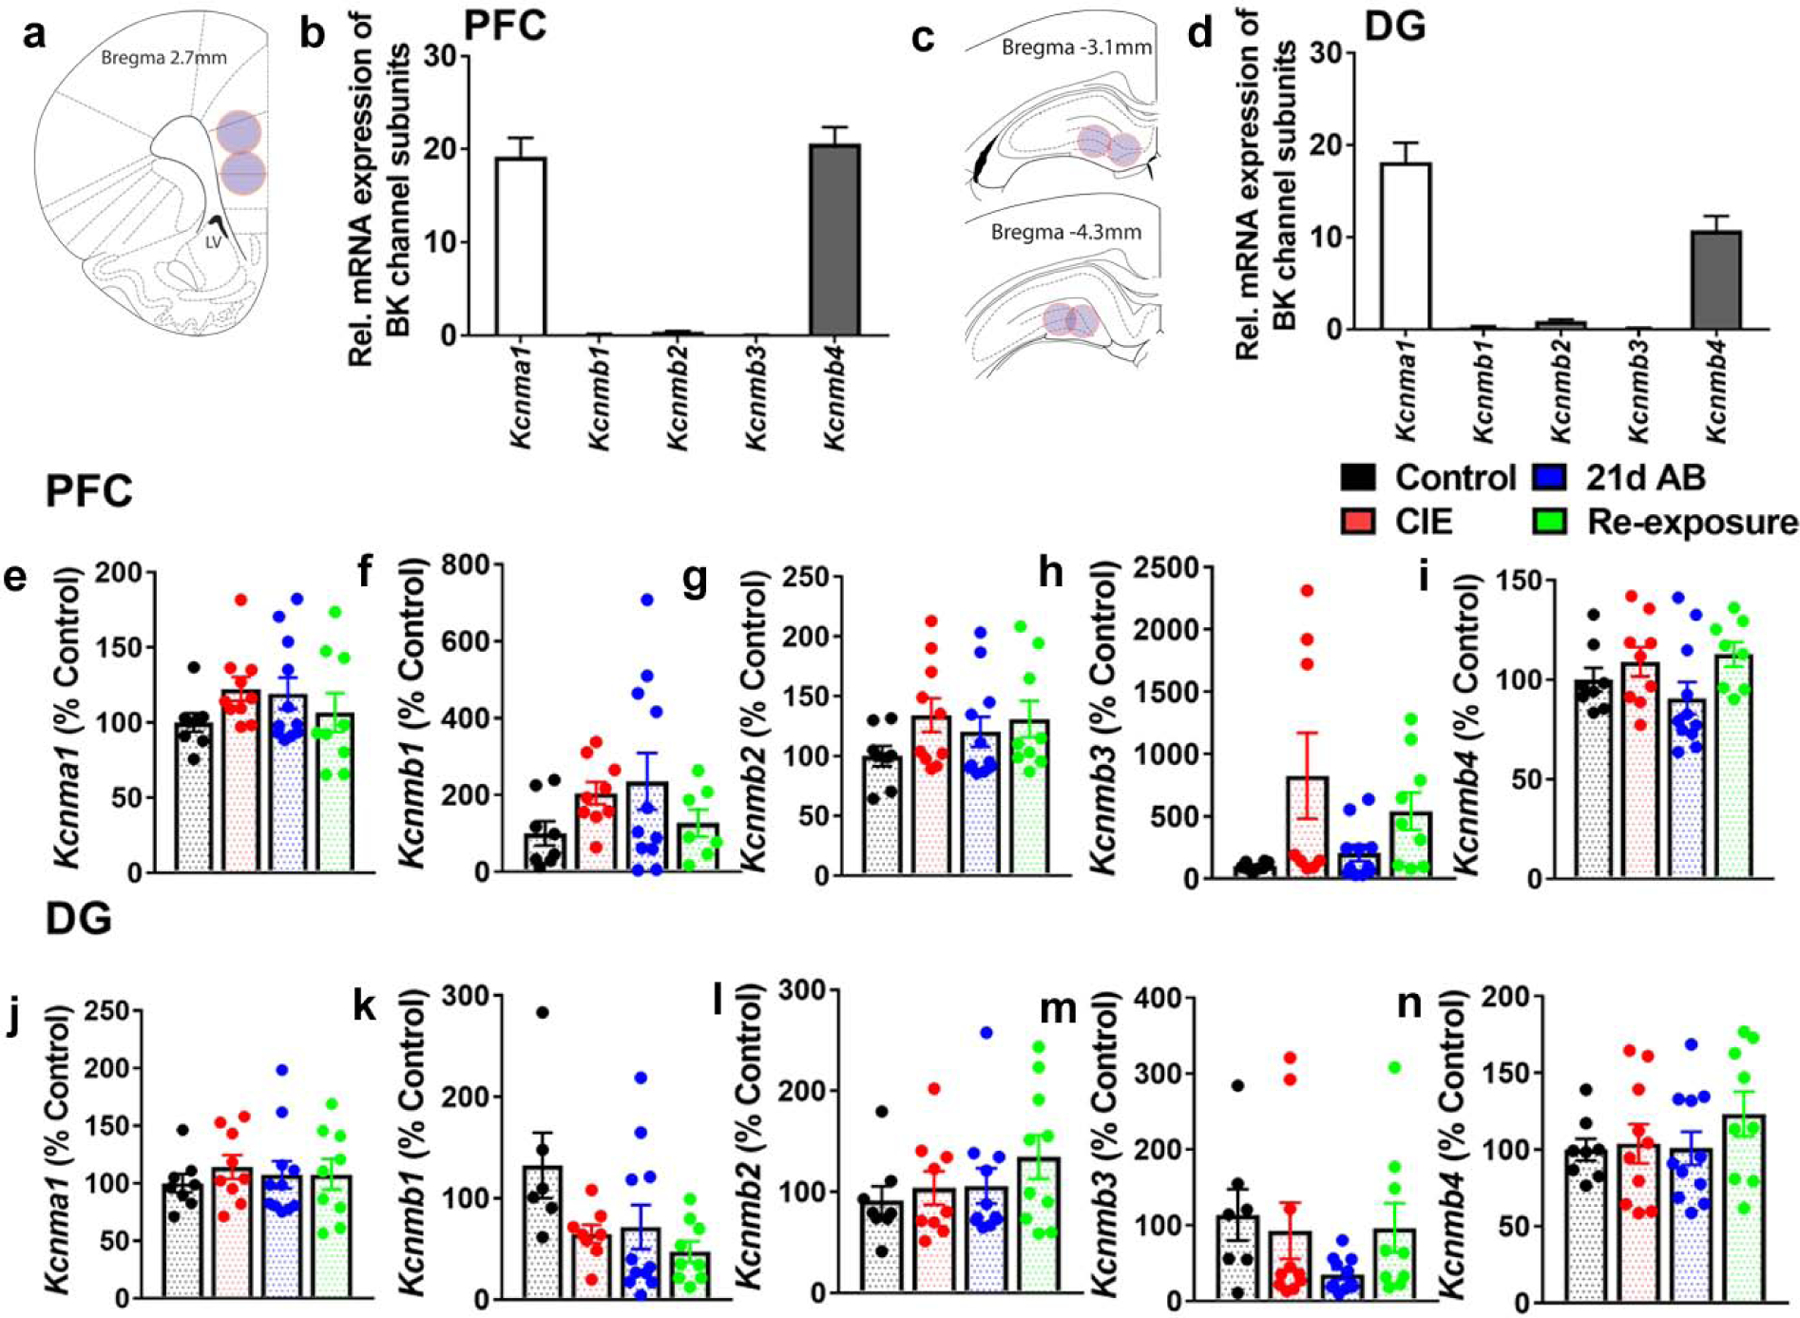
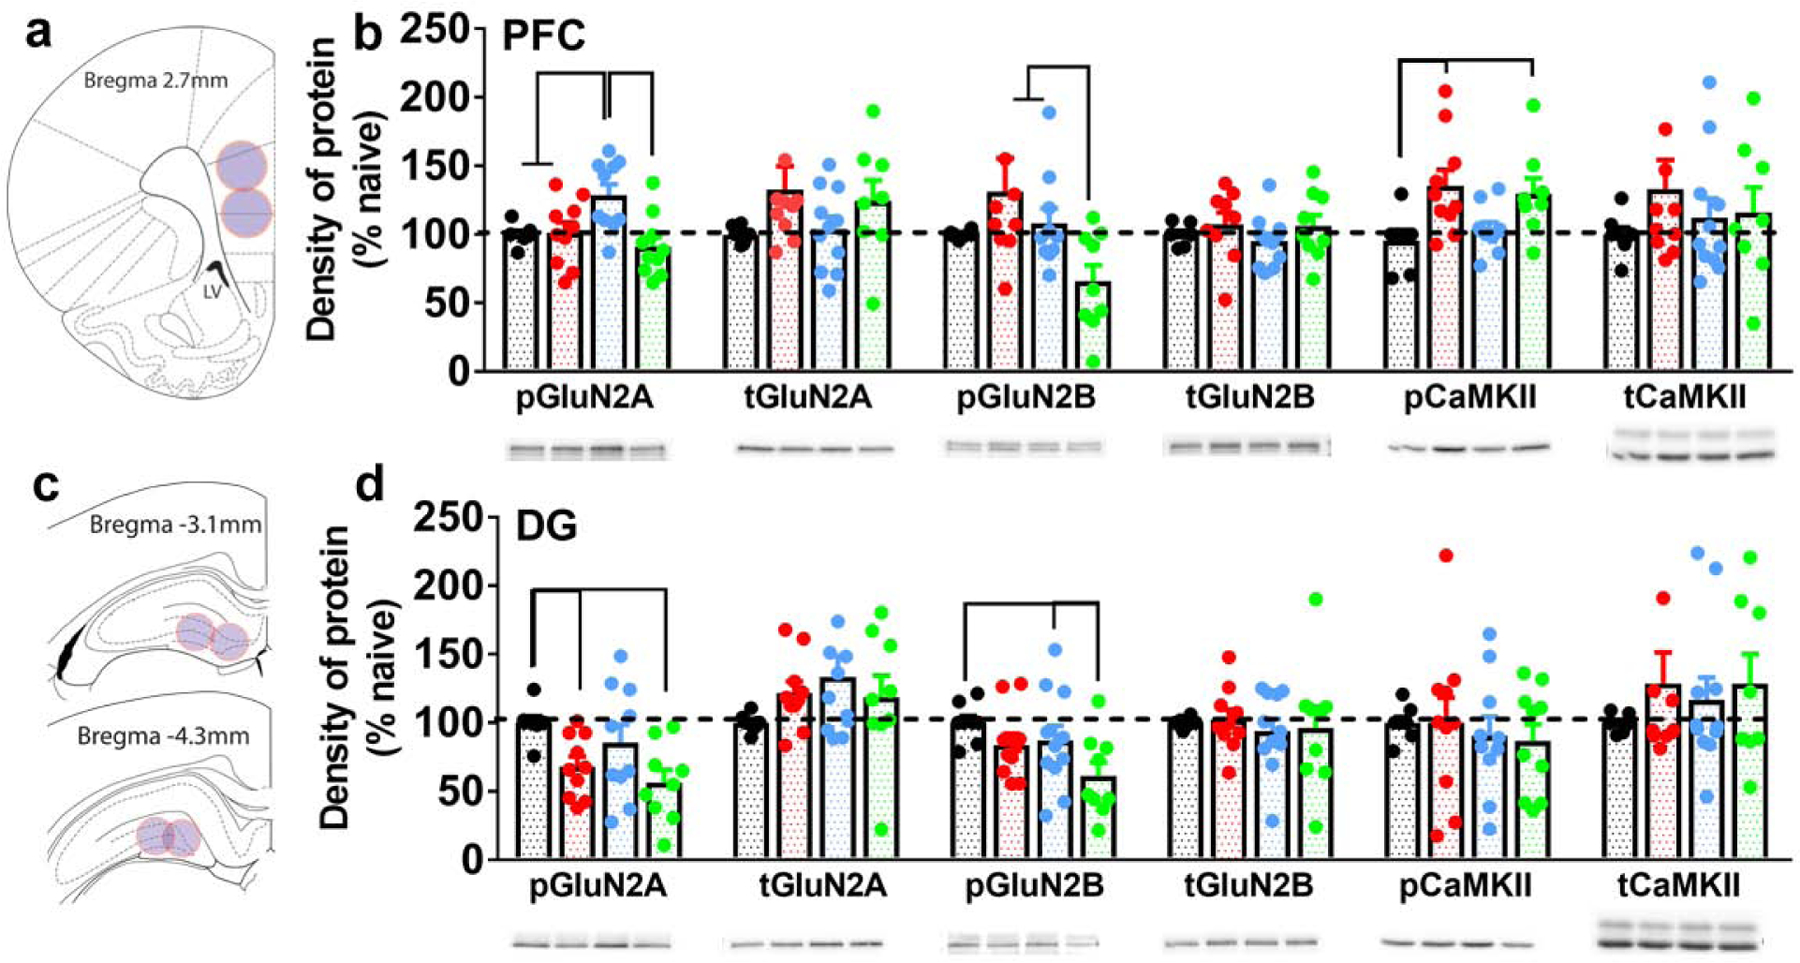
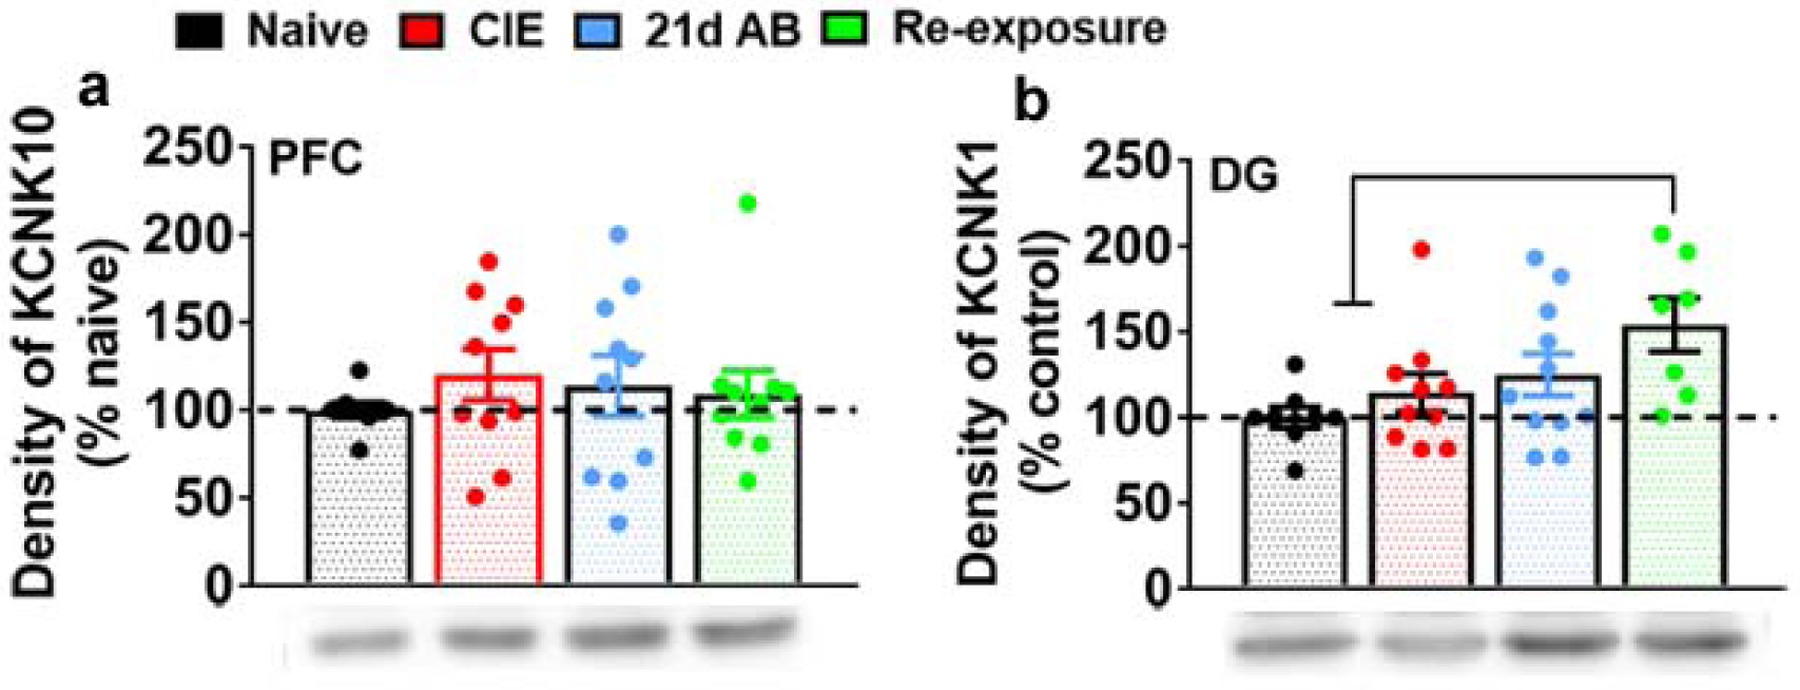
Alterations in the function of prefrontal cortex (PFC) and hippocampus have been implicated in underlying the relapse to alcohol seeking behaviors in humans and animal models of moderate to severe alcohol use disorders (AUD). Here we used chronic intermittent ethanol vapor exposure (CIE), 21d protracted abstinence following CIE (21d AB), and re-exposure to one vapor session during protracted abstinence (re-exposure) to evaluate the effects of chronic ethanol exposure on basal synaptic function, neuronal excitability and expression of key synaptic proteins that play a role in neuronal excitability in the medial PFC (mPFC) and dentate gyrus (DG). CIE consistently enhanced excitability of layer 2/3 pyramidal neurons in the mPFC and granule cell neurons in the DG. In the DG, this effect persisted during 21d AB. Re-exposure did not enhance excitability, suggesting resistance to vapor-induced effects. Analysis of action potential kinetics revealed that altered afterhyperpolarization, rise time and decay time constants are associated with the altered excitability during CIE, 21d AB and re-exposure. Molecular adaptations that may underlie increases in neuronal excitability under these different conditions were identified. Quantitative polymerase chain reaction of large-conductance potassium (BK) channel subunit mRNA in PFC and DG tissue homogenates did not show altered expression patterns of BK subunits. Western blotting demonstrates enhanced phosphorylation of Ca2⁺/calmodulin-dependent protein kinase II (CaMKII), and reduced phosphorylation of glutamate receptor GluN2A/2B subunits. These results suggest a novel relationship between activity of CaMKII and GluN receptors in the mPFC and DG, and neuronal excitability in these brain regions in the context of moderate to severe AUD.
Keywords: BK channel; CaMKII; Ethanol vapor exposure; GluN; Hippocampus; qPCR.
Copyright © 2020 Elsevier Ltd. All rights reserved.
Conflict of interest statement
Declarations of interest: The authors declare no conflict of interest. The funders had no role in the design of the study; in the collection, analyses, or interpretation of data; in the writing of the manuscript, and in the decision to publish the results.
Figures
Similar articles
-
Abstinence and Fear Experienced during This Period Produce Distinct Cortical and Hippocampal Adaptations in Alcohol-Dependent Rats.Brain Sci. 2024 Apr 26;14(5):431. doi: 10.3390/brainsci14050431. Brain Sci. 2024. PMID: 38790410 Free PMC article.
-
Dendritic remodeling of hippocampal neurons is associated with altered NMDA receptor expression in alcohol dependent rats.Mol Cell Neurosci. 2015 Mar;65:153-62. doi: 10.1016/j.mcn.2015.03.008. Epub 2015 Mar 10. Mol Cell Neurosci. 2015. PMID: 25769285 Free PMC article.
-
Protracted abstinence from chronic ethanol exposure alters the structure of neurons and expression of oligodendrocytes and myelin in the medial prefrontal cortex.Neuroscience. 2015 May 7;293:35-44. doi: 10.1016/j.neuroscience.2015.02.043. Epub 2015 Feb 28. Neuroscience. 2015. PMID: 25732140 Free PMC article.
-
Structural reorganization of pyramidal neurons in the medial prefrontal cortex of alcohol dependent rats is associated with altered glial plasticity.Brain Struct Funct. 2015;220(3):1705-20. doi: 10.1007/s00429-014-0755-3. Epub 2014 Mar 26. Brain Struct Funct. 2015. PMID: 24667898 Free PMC article.
-
A critical review of ethanol effects on neuronal firing: A metabolic perspective.Alcohol Clin Exp Res (Hoboken). 2024 Mar;48(3):450-458. doi: 10.1111/acer.15266. Epub 2024 Jan 12. Alcohol Clin Exp Res (Hoboken). 2024. PMID: 38217065 Free PMC article. Review.
Cited by
-
Adolescence alcohol exposure impairs fear extinction and alters medial prefrontal cortex plasticity.Neuropharmacology. 2022 Jun 15;211:109048. doi: 10.1016/j.neuropharm.2022.109048. Epub 2022 Mar 30. Neuropharmacology. 2022. PMID: 35364101 Free PMC article.
-
Alcohol consumption confers lasting impacts on prefrontal cortical neuron intrinsic excitability and spontaneous neurotransmitter signaling in the aging brain in mice.Neurobiol Aging. 2025 Jan;145:42-54. doi: 10.1016/j.neurobiolaging.2024.09.014. Epub 2024 Oct 15. Neurobiol Aging. 2025. PMID: 39476434
-
Dysregulated kappa-opioid receptors in the medial prefrontal cortex contribute to working memory deficits in alcohol dependence.Addict Biol. 2022 Mar;27(2):e13138. doi: 10.1111/adb.13138. Addict Biol. 2022. PMID: 35138672 Free PMC article.
-
Integrating and fragmenting memories under stress and alcohol.Neurobiol Stress. 2024 Feb 8;30:100615. doi: 10.1016/j.ynstr.2024.100615. eCollection 2024 May. Neurobiol Stress. 2024. PMID: 38375503 Free PMC article.
-
Reactive, Adult Neurogenesis From Increased Neural Progenitor Cell Proliferation Following Alcohol Dependence in Female Rats.Front Neurosci. 2021 Sep 14;15:689601. doi: 10.3389/fnins.2021.689601. eCollection 2021. Front Neurosci. 2021. PMID: 34594180 Free PMC article.
References
-
- Aradi I & Holmes WR (1999) Role of multiple calcium and calcium-dependent conductances in regulation of hippocampal dentate granule cell excitability. Journal of computational neuroscience, 6, 215–235. - PubMed
-
- Bean BP (2007) The action potential in mammalian central neurons. Nat Rev Neurosci, 8, 451–465. - PubMed
-
- Bechara A, Dolan S, Denburg N, Hindes A, Anderson SW & Nathan PE (2001) Decision-making deficits, linked to a dysfunctional ventromedial prefrontal cortex, revealed in alcohol and stimulant abusers. Neuropsychologia, 39, 376–389. - PubMed
Publication types
MeSH terms
Substances
Grants and funding
LinkOut - more resources
Full Text Sources
Other Literature Sources
Miscellaneous
