

Effect of the air-water interface on the conformation of amyloid beta
- PMID: 33334114
- PMCID: PMC7863683
- DOI: 10.1116/6.0000620
Effect of the air-water interface on the conformation of amyloid beta
Abstract
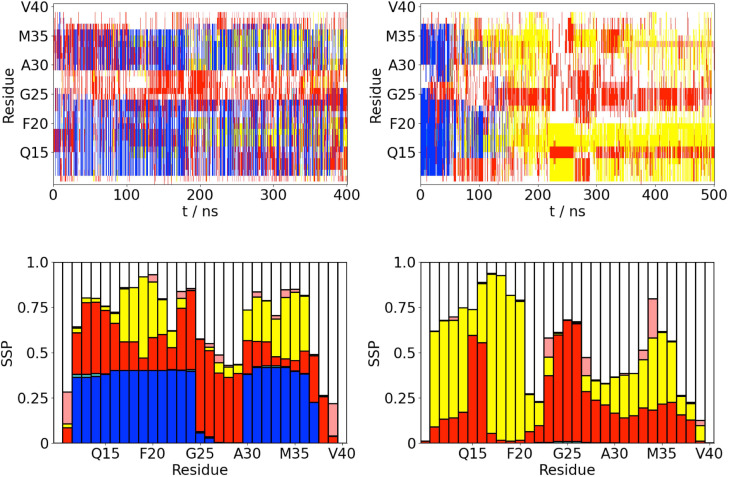
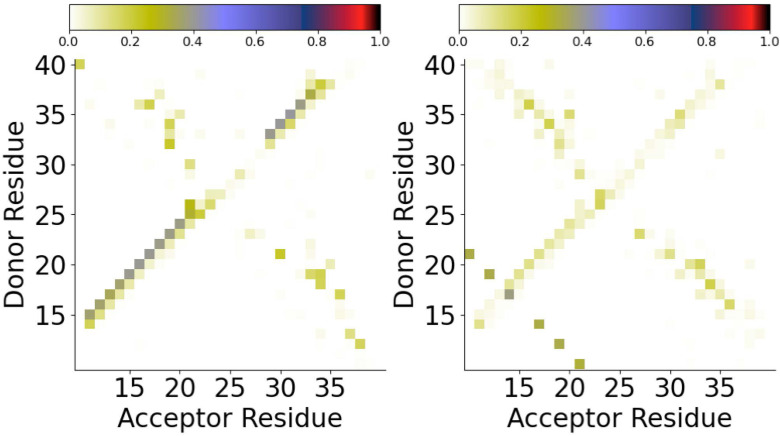
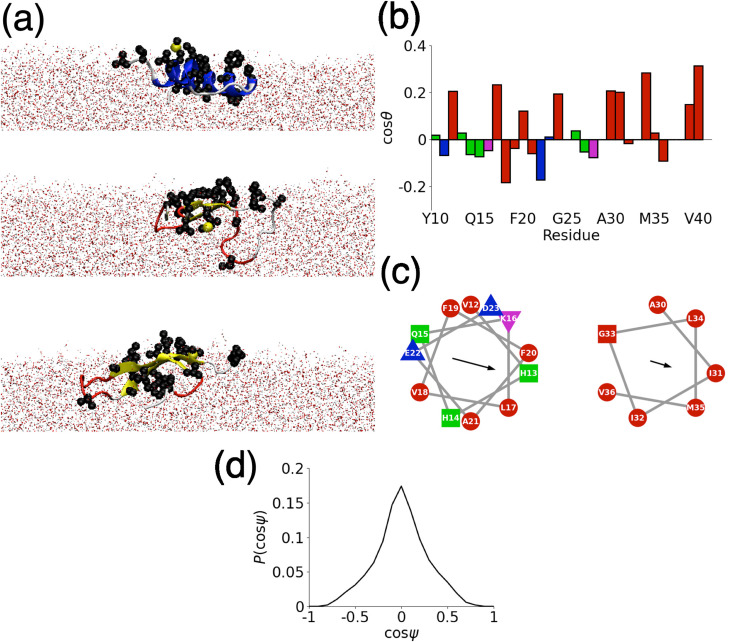
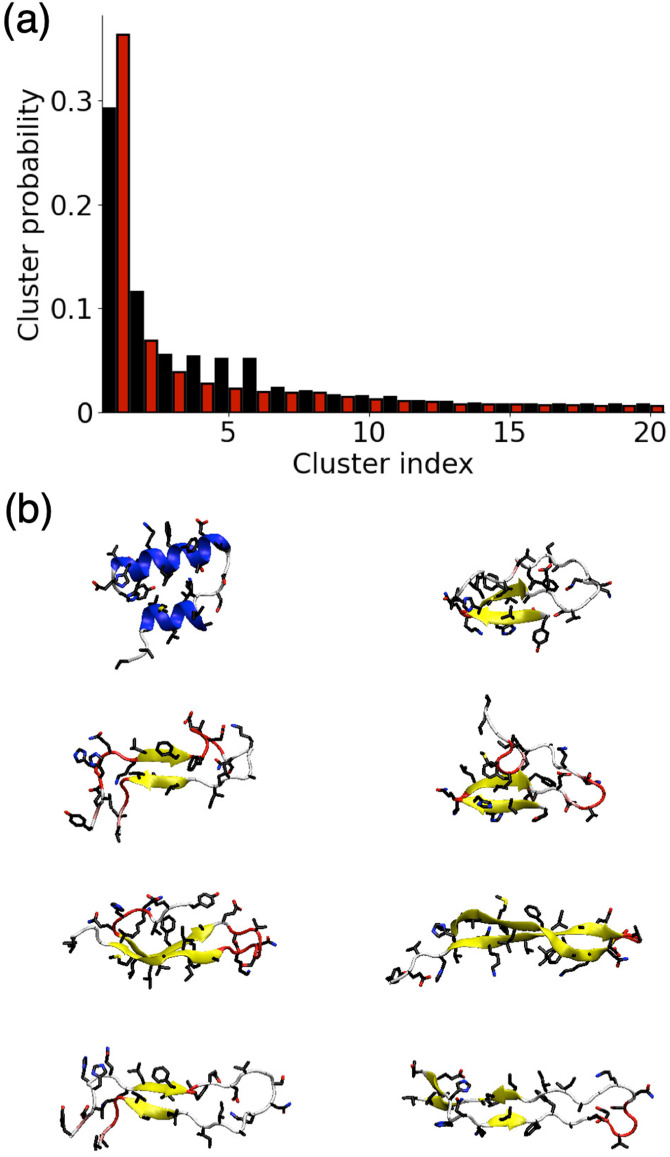
It has long been recognized that liquid interfaces, such as the air-water interface (AWI), can enhance the formation of protein fibrils. This makes liquid interfaces attractive templates for fibril formation but fully realizing this requires knowledge of protein behavior at interfaces, which is currently lacking. To address this, molecular dynamics simulation is used to investigate fragments of amyloid beta, a model fibril forming protein, at the air-water interface. At the air-water interface, the enrichment of aggregation-prone helical conformations provides a mechanism for the enhancement of fibrillation at interfaces. The conformational ensemble at the air-water interface was also considerably reduced compared to bulk solution due to the tendency of hydrophobic side chains partitioning into the air restricting the range of conformations. Little overlap between the conformational ensembles at the AWI and in the bulk solution was found, suggesting that AWI induces the formation of a different set of structures compared to bulk solution. The smaller Aβ(16-22) and Aβ(25-35) fragments show an increase in the propensity for an ordered secondary structure at the air-water interface but with a increased propensity for turn over other motifs, illustrating the importance of intra-protein interactions for stabilizing helical and extended conformations.
Figures
Similar articles
-
Acidic pH Promotes Refolding and Macroscopic Assembly of Amyloid β (16-22) Peptides at the Air-Water Interface.J Phys Chem Lett. 2022 Jul 28;13(29):6674-6679. doi: 10.1021/acs.jpclett.2c01171. Epub 2022 Jul 15. J Phys Chem Lett. 2022. PMID: 35839425 Free PMC article.
-
Critical role of interfaces and agitation on the nucleation of Abeta amyloid fibrils at low concentrations of Abeta monomers.Biochim Biophys Acta. 2010 Apr;1804(4):986-95. doi: 10.1016/j.bbapap.2010.01.012. Epub 2010 Jan 25. Biochim Biophys Acta. 2010. PMID: 20100601
-
Molecular dynamics simulations of amyloid-β(16-22) peptide aggregation at air-water interfaces.J Chem Phys. 2020 Mar 7;152(9):095101. doi: 10.1063/1.5131848. J Chem Phys. 2020. PMID: 33480728
-
The impact of water on the ambivalent behavior and paradoxical phenomenon of the amyloid-β fibril protein.Biomol Concepts. 2017 Dec 20;8(5-6):213-220. doi: 10.1515/bmc-2017-0027. Biomol Concepts. 2017. PMID: 29211680 Review.
-
Understanding amyloid fibril nucleation and aβ oligomer/drug interactions from computer simulations.Acc Chem Res. 2014 Feb 18;47(2):603-11. doi: 10.1021/ar4002075. Epub 2013 Dec 24. Acc Chem Res. 2014. PMID: 24368046 Review.
Cited by
-
The Influences of Sulphation, Salt Type, and Salt Concentration on the Structural Heterogeneity of Glycosaminoglycans.Int J Mol Sci. 2021 Oct 26;22(21):11529. doi: 10.3390/ijms222111529. Int J Mol Sci. 2021. PMID: 34768961 Free PMC article.
-
The Role of Cyclodextrins against Interface-Induced Denaturation in Pharmaceutical Formulations: A Molecular Dynamics Approach.Mol Pharm. 2021 Jun 7;18(6):2322-2333. doi: 10.1021/acs.molpharmaceut.1c00135. Epub 2021 May 17. Mol Pharm. 2021. PMID: 33999634 Free PMC article.
-
Surface Hydrophobicity Strongly Influences Adsorption and Conformation of Amyloid Beta Derived Peptides.Molecules. 2024 Jul 31;29(15):3634. doi: 10.3390/molecules29153634. Molecules. 2024. PMID: 39125038 Free PMC article.
-
Acidic pH Promotes Refolding and Macroscopic Assembly of Amyloid β (16-22) Peptides at the Air-Water Interface.J Phys Chem Lett. 2022 Jul 28;13(29):6674-6679. doi: 10.1021/acs.jpclett.2c01171. Epub 2022 Jul 15. J Phys Chem Lett. 2022. PMID: 35839425 Free PMC article.
References
Publication types
MeSH terms
Substances
LinkOut - more resources
Full Text Sources