. 2020 Dec 17;21(1):303.
doi: 10.1186/s13059-020-02215-9.

FAN-C: a feature-rich framework for the analysis and visualisation of chromosome conformation capture data

Affiliations

FAN-C: a feature-rich framework for the analysis and visualisation of chromosome conformation capture data

Kai Kruse et al. Genome Biol. .

Abstract

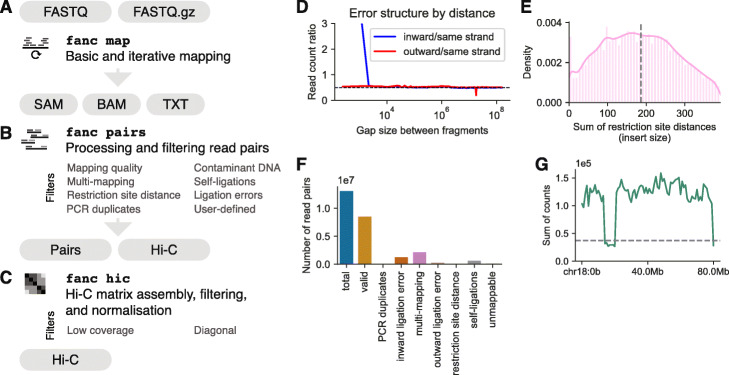
Chromosome conformation capture data, particularly from high-throughput approaches such as Hi-C, are typically very complex to analyse. Existing analysis tools are often single-purpose, or limited in compatibility to a small number of data formats, frequently making Hi-C analyses tedious and time-consuming. Here, we present FAN-C, an easy-to-use command-line tool and powerful Python API with a broad feature set covering matrix generation, analysis, and visualisation for C-like data ( https://github.com/vaquerizaslab/fanc ). Due to its compatibility with the most prevalent Hi-C storage formats, FAN-C can be used in combination with a large number of existing analysis tools, thus greatly simplifying Hi-C matrix analysis.

Keywords: Chromatin loops; Chromosomal compartments; Chromosome conformation capture; Hi-C; Hi-C analysis; Hi-C visualisation; Topologically associating domains (TAD).


Conflict of interest statement

The authors declare that they have no competing interests.

Figures

Fig. 1
Fig. 1
Overview of FAN-C functionality. a Overview of Hi-C from an experimental (left) and computational (right) perspective. RE: restriction enzyme. b Matrix generation features. c Hi-C matrix analysis features. d Hi-C visualisation features. e Helper tools
Fig. 2
Fig. 2
FAN-C matrix generation. a-c Schematic overview of the matrix generation pipeline. a Mapping features. b Processing and filtering of Hi-C read pairs. c Assembly, filtering and normalisation of the Hi-C matrix from valid read pairs. df FAN-C statistics plots using data from HUVEC Hi-C [25]. d Ligation error plot as in [52, 53]. Dashed line indicates expected values. e Density plot of the sum of restriction site distances (insert size) measured from the mapping location of a read to the nearest restriction site. Dashed line indicates median insert size. f Summary statistics plot showing the read pairs removed by various filters. g Coverage plot of a Hi-C matrix binned at 1 kb resolution. Dashed line indicates the chosen coverage cutoff at 25% median coverage
Fig. 3
Fig. 3
FAN-C analysis features. All analyses performed on GM12878 cells [25] on the 10 kb resolution matrix, unless otherwise noted. a Schematic representation of the analysis types available for FAN-C, Cooler, and Juicer matrices. b Hi-C matrix plot of a sample region with 10 kb resolution. c Log-log “Distance decay” plot of the expected normalised contact frequency against locus distance. d Log2-observed/expected (O/E) matrix for the same region as in a. e 500 kb resolution correlation matrix/A/B compartment plot of chromosome 1 (top) and its first eigenvector (EV) (bottom). f “Saddle plot” showing preferential interactions of active/active and inactive/inactive regions (top), and bar plot showing the cutoffs used for binning regions by the corresponding EV entry magnitude (bottom). Note the outlier on the far right. g Aggregate TAD plot showing the average log2-O/E in and around arrowhead domains [25]. h Aggregate loop plot showing the average log2-O/E at peaks called by HICCUPS [25]. i–n Example region on chromosome 18 highlighting additional analyses available in FAN-C and the possibility of “genome browser” style plotting. i Triangular Hi-C matrix plot. j Line plot showing CTCF occupancy (fold-change over input) as measured by ChIP. Data from GEO:GSM733752. k Heatmap showing insulation scores calculated using different window sizes. l Insulation score track for a window size of 100 kb. m Heatmap showing directionality index results for multiple window sizes. n Directionality index track for a window size of 1 Mb. o Gene plot using data from Gencode (v19) [57]
Fig. 4
Fig. 4
FAN-C comparison workflow for neuronal differentiation. ESC, embryonic stem cells; NPC, neuronal precursor cells; CN, cortical neurons. a Saddle plots showing contacts relative to expectation among regions with different compartment eigenvector values (binned by 2% percentiles). b Compartment strength barplot. c Heatmap of insulation scores at all boundaries in ESC, NPC, and CN, sorted by insulation score in CN. d Heatmap of insulation scores at differentially insulated regions between ESC and CN. e Aggregate matrices of 1mb windows centred at all boundaries in ESC, NPC, and CN. f Aggregate matrices of 1mb windows centred at ESC-specific boundaries. g Example of a differentially insulated region at the Pbx1 locus, showing Hi-C matrices for ESC and CN, a difference Hi-C matrix of CN- ESC, insulation scores of ESC and CN at various window sizes, insulation score difference between ESC and CN, and genes in the region, coloured by strand (orange = forward, cyan = reverse)

References

    1. Lieberman-Aiden E, Van Berkum NL, Williams L, Imakaev M, Ragoczy T, Telling A, Amit I, Lajoie BR, Sabo PJ, Dorschner MO, et al. Comprehensive mapping of long-range interactions reveals folding principles of the human genome. Science. 2009;326:289–293. doi: 10.1126/science.1181369. - DOI - PMC - PubMed
    1. de Wit E, de Laat W. A decade of 3C technologies: insights into nuclear organization. Genes Dev. 2012;26:11–24. doi: 10.1101/gad.179804.111. - DOI - PMC - PubMed
    1. Denker A, De Laat W. The second decade of 3C technologies: detailed insights into nuclear organization. Genes Dev. 2016;30:1357–1382. doi: 10.1101/gad.281964.116. - DOI - PMC - PubMed
    1. Le TBK, Imakaev MV, Mirny LA, Laub MT. High-resolution mapping of the spatial organization of a bacterial chromosome. Science. 2013;342:731–4. - PMC - PubMed
    1. Gassler J, Brandão HB, Imakaev M, Flyamer IM, Ladstätter S, Bickmore WA, Peters J, Mirny LA, Tachibana K. A mechanism of cohesin-dependent loop extrusion organizes zygotic genome architecture. EMBO J. 2017;36:e201798083. doi: 10.15252/embj.201798083. - DOI - PMC - PubMed

Publication types

LinkOut - more resources