. 2021 Mar:101:16-26.
doi: 10.1016/j.jes.2020.07.029. Epub 2020 Aug 4.

Changes in air pollution during COVID-19 lockdown in Spain: A multi-city study

Affiliations

Changes in air pollution during COVID-19 lockdown in Spain: A multi-city study

Álvaro Briz-Redón et al. J Environ Sci (China). 2021 Mar.

Abstract

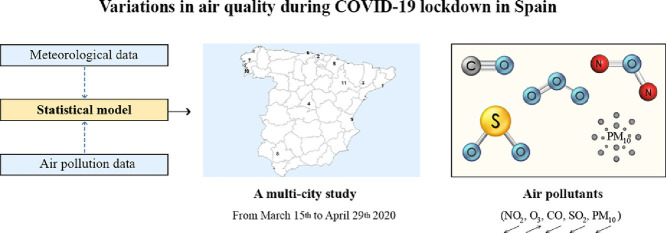
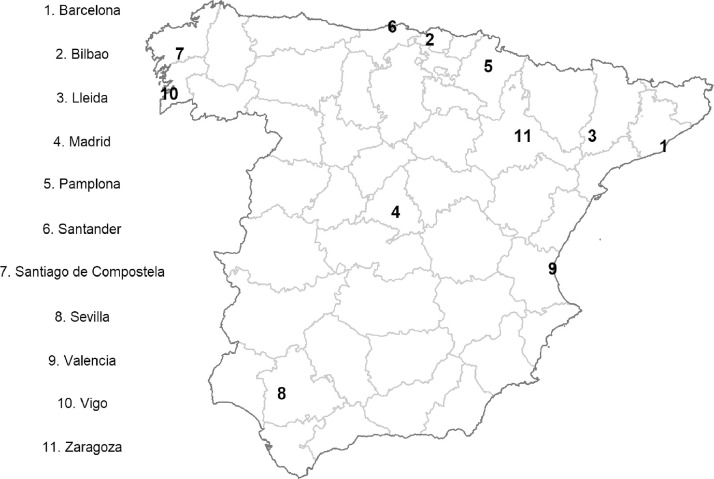
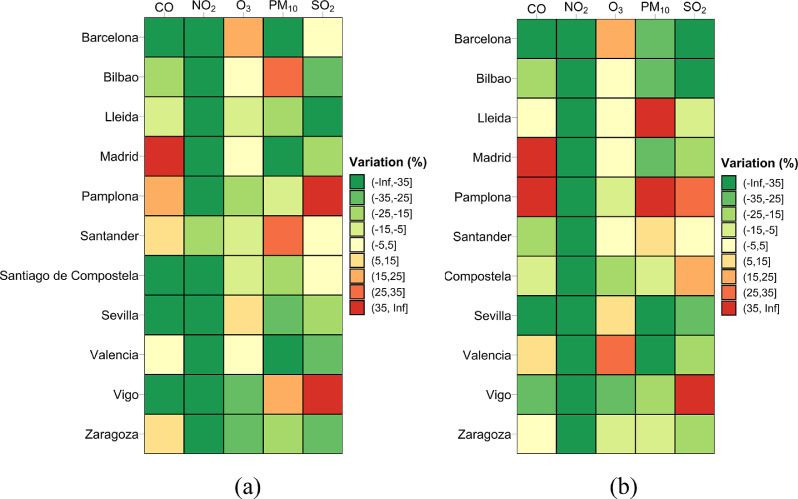
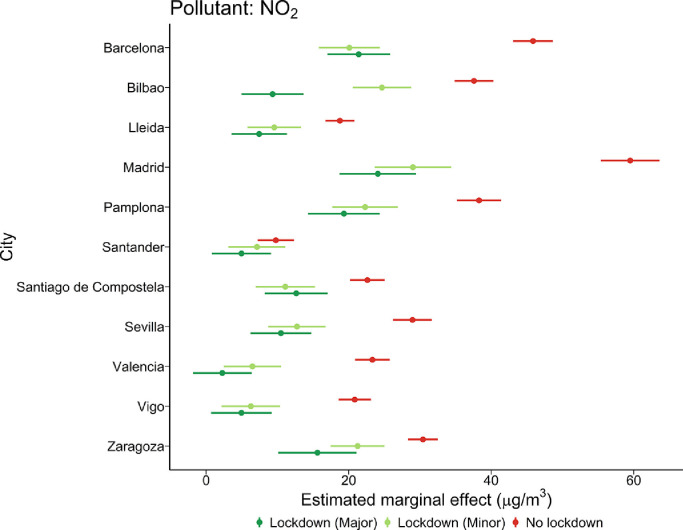
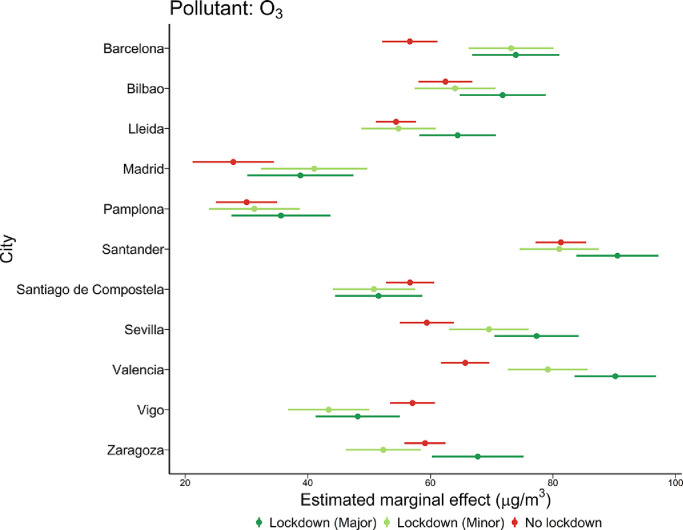
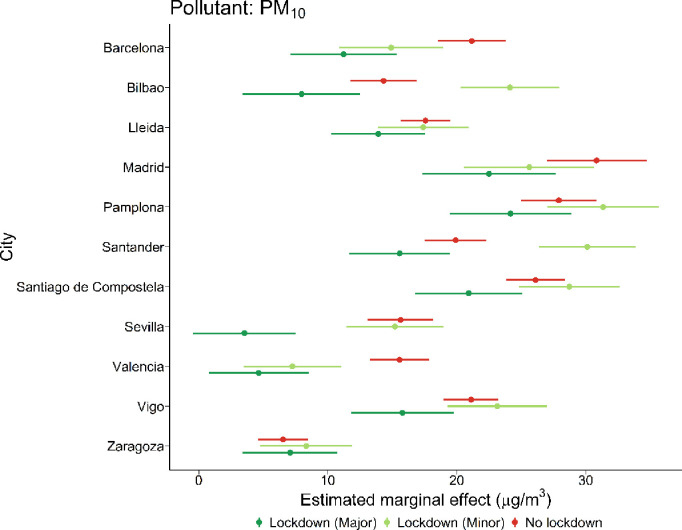
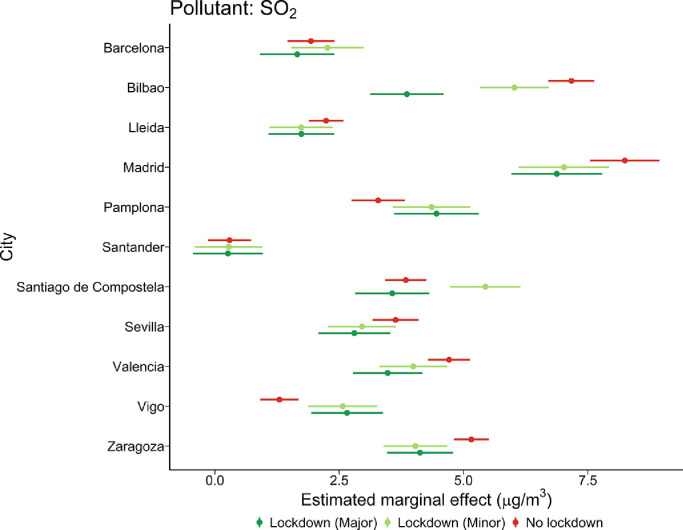
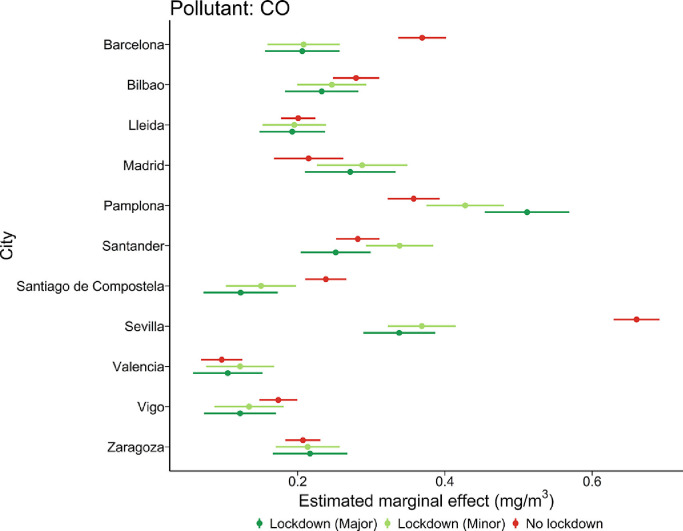
The COVID-19 pandemic has escalated into one of the largest crises of the 21st Century. The new SARS-CoV-2 coronavirus, responsible for COVID-19, has spread rapidly all around the world. The Spanish Government was forced to declare a nationwide lockdown in view of the rapidly spreading virus and high mortality rate in the nation. This study investigated the impact of short-term lockdown during the period from March 15th to April 12th 2020 on the atmospheric levels of CO, SO2, PM10, O3, and NO2 over 11 representative Spanish cities. The possible influence of several meteorological factors (temperature, precipitation, wind, sunlight hours, minimum and maximum pressure) on the pollutants' levels were also considered. The results obtained show that the 4-week lockdown had significant impact on reducing the atmospheric levels of NO2 in all cities except for the small city of Santander as well as CO, SO2, and PM10 in some cities, but resulted in increase of O3 level.

Keywords: Air quality; COVID-19; Lockdown; Meteorology; Pollution.


Figures

Image, graphical abstract
Graphical abstract
Fig 1
Fig. 1
Locations of the 11 cities considered for the analysis. The coordinates used were those of the cities’ pollution stations. The borders of the different Spanish provinces are plotted in gray.
Fig 2
Fig. 2
Percentage variations in pollutant levels in each of the cities under study between March 17th-March 31st 2019 and March 15th-March 29th 2020 (a), and between April 1st-April 14th 2019 and March 30th-April 12th 2020 (b).
Fig 3
Fig. 3
City-specific marginal effects estimated by Eq. (1) for NO2 levels in each of the three study periods. Differences between marginal effects are statistically significant when the associated confidence intervals do not overlap.
Fig 4
Fig. 4
City-specific marginal effects estimated by Eq. (1) for O3 levels in each of the three periods. Differences between marginal effects are statistically significant when the associated confidence intervals do not overlap.
Fig 5
Fig. 5
City-specific marginal effects estimated by Eq. (1) for PM10 levels in the three study periods. Differences between marginal effects are statistically significant when the associated confidence intervals do not overlap.
Fig 6
Fig. 6
City-specific marginal effects estimated by Eq. (1) for SO2 levels in each of the three periods. Differences between marginal effects are statistically significant when the associated confidence intervals do not overlap.
Fig 7
Fig. 7
City-specific marginal effects estimated by Eq. (1) for CO levels in each of the three periods. Differences between marginal effects are statistically significant when the associated confidence intervals do not overlap.

Similar articles

  • A global observational analysis to understand changes in air quality during exceptionally low anthropogenic emission conditions.
    Sokhi RS, Singh V, Querol X, Finardi S, Targino AC, Andrade MF, Pavlovic R, Garland RM, Massagué J, Kong S, Baklanov A, Ren L, Tarasova O, Carmichael G, Peuch VH, Anand V, Arbilla G, Badali K, Beig G, Belalcazar LC, Bolignano A, Brimblecombe P, Camacho P, Casallas A, Charland JP, Choi J, Chourdakis E, Coll I, Collins M, Cyrys J, da Silva CM, Di Giosa AD, Di Leo A, Ferro C, Gavidia-Calderon M, Gayen A, Ginzburg A, Godefroy F, Gonzalez YA, Guevara-Luna M, Haque SM, Havenga H, Herod D, Hõrrak U, Hussein T, Ibarra S, Jaimes M, Kaasik M, Khaiwal R, Kim J, Kousa A, Kukkonen J, Kulmala M, Kuula J, La Violette N, Lanzani G, Liu X, MacDougall S, Manseau PM, Marchegiani G, McDonald B, Mishra SV, Molina LT, Mooibroek D, Mor S, Moussiopoulos N, Murena F, Niemi JV, Noe S, Nogueira T, Norman M, Pérez-Camaño JL, Petäjä T, Piketh S, Rathod A, Reid K, Retama A, Rivera O, Rojas NY, Rojas-Quincho JP, San José R, Sánchez O, Seguel RJ, Sillanpää S, Su Y, Tapper N, Terrazas A, Timonen H, Toscano D, Tsegas G, Velders GJM, Vlachokostas C, von Schneidemesser E, Vpm R, Yadav R, Zalakeviciute R, Zavala M. Sokhi RS, et al. Environ Int. 2021 Dec;157:106818. doi: 10.1016/j.envint.2021.106818. Epub 2021 Aug 20. Environ Int. 2021. PMID: 34425482
  • Impact of Covid-19 lockdown on PM10, SO2 and NO2 concentrations in Salé City (Morocco).
    Otmani A, Benchrif A, Tahri M, Bounakhla M, Chakir EM, El Bouch M, Krombi M. Otmani A, et al. Sci Total Environ. 2020 Sep 15;735:139541. doi: 10.1016/j.scitotenv.2020.139541. Epub 2020 May 19. Sci Total Environ. 2020. PMID: 32445829 Free PMC article.
  • How air quality and COVID-19 transmission change under different lockdown scenarios? A case from Dhaka city, Bangladesh.
    Rahman MS, Azad MAK, Hasanuzzaman M, Salam R, Islam ARMT, Rahman MM, Hoque MMM. Rahman MS, et al. Sci Total Environ. 2021 Mar 25;762:143161. doi: 10.1016/j.scitotenv.2020.143161. Epub 2020 Oct 21. Sci Total Environ. 2021. PMID: 33129520 Free PMC article.
  • Effect of COVID-19 pandemic on air quality: a study based on Air Quality Index.
    Gope S, Dawn S, Das SS. Gope S, et al. Environ Sci Pollut Res Int. 2021 Jul;28(27):35564-35583. doi: 10.1007/s11356-021-14462-9. Epub 2021 May 25. Environ Sci Pollut Res Int. 2021. PMID: 34036496 Free PMC article. Review.
  • Geospatial analysis of COVID-19 lockdown effects on air quality in the South and Southeast Asian region.
    Roy S, Saha M, Dhar B, Pandit S, Nasrin R. Roy S, et al. Sci Total Environ. 2021 Feb 20;756:144009. doi: 10.1016/j.scitotenv.2020.144009. Epub 2020 Nov 21. Sci Total Environ. 2021. PMID: 33250248 Free PMC article.

Cited by

References

    1. Arroyo V., Díaz J., Salvador P., Linares C. Impact of air pollution on low birth weight in Spain: an approach to a National Level Study. Environ. Res. 2019;171:69–79. doi: 10.1016/j.envres.2019.01.030. - DOI - PubMed
    1. Ayuntamiento de Madrid . Bicimad; 2020. Portal De Datos Abiertos Del Ayuntamiento de Madrid.https://datos.madrid.es/portal/site/egob/ [WWW Document]URL.
    1. Ayuntamiento de Zaragoza, 2020. La Ciudad. Medio Ambiente [WWW Document]. URLhttps://www.zaragoza.es/sede/portal/medioambiente/
    1. Becker S., Soukup J.M. Exposure to urban air particulates alters the macrophage-mediated inflammatory response to respiratory viral infection. J. Toxicol. Environ. Heal. - Part A. 1999;57:445–457. doi: 10.1080/009841099157539. - DOI - PubMed
    1. Bourouiba L. Potential implications for reducing transmission of COVID-19. JAMA Insights. 2020 doi: 10.1001/jama.2020.4756. - DOI - PubMed