. 2021 Mar;11(3):599-613.
doi: 10.1158/2159-8290.CD-20-0756. Epub 2020 Dec 17.

A Critical Role for Fas-Mediated Off-Target Tumor Killing in T-cell Immunotherapy

Affiliations

A Critical Role for Fas-Mediated Off-Target Tumor Killing in T-cell Immunotherapy

Ranjan Upadhyay et al. Cancer Discov. 2021 Mar.

Abstract

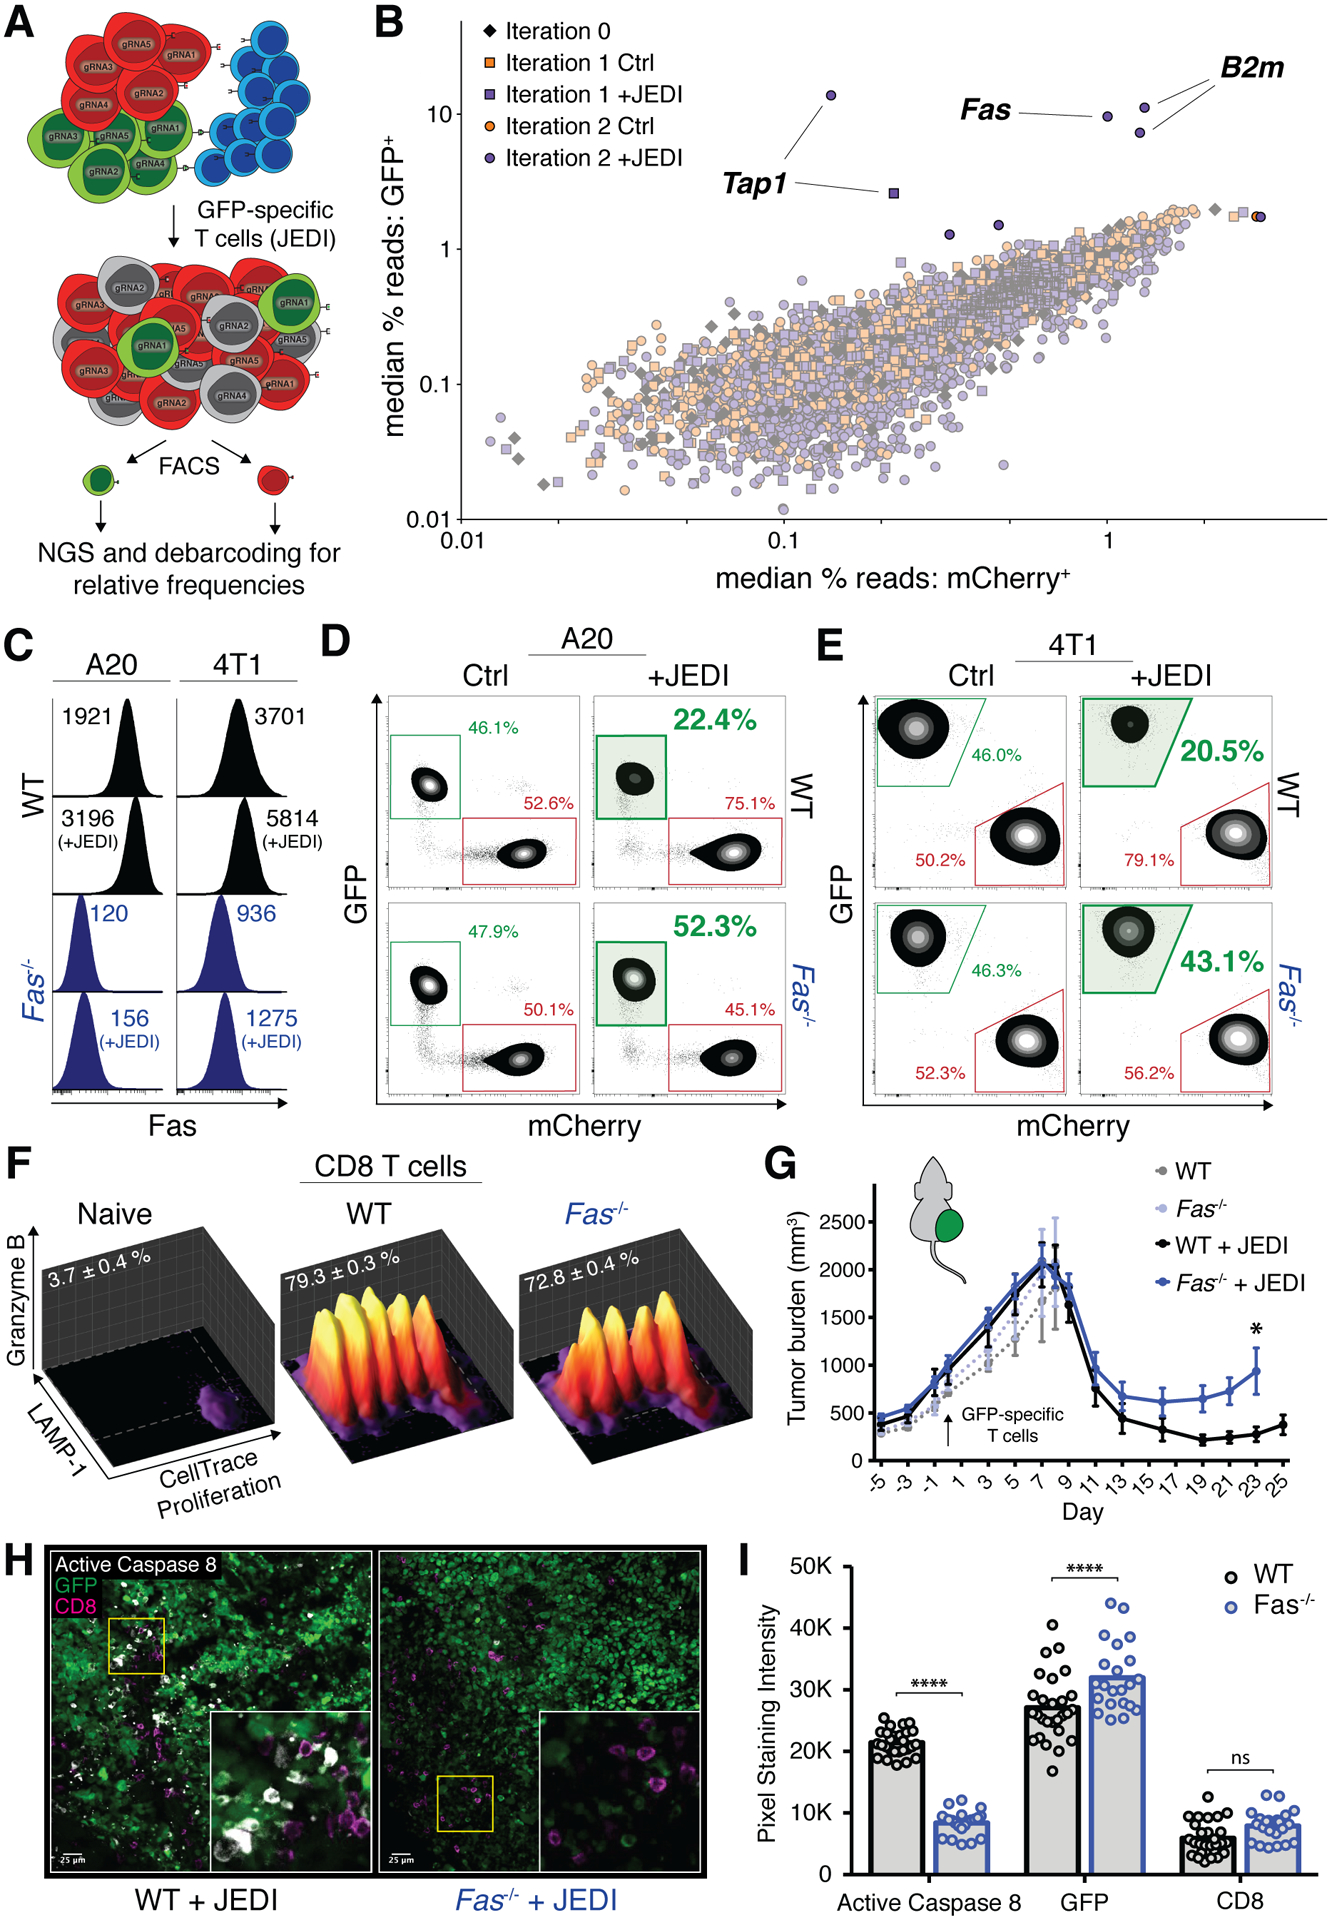
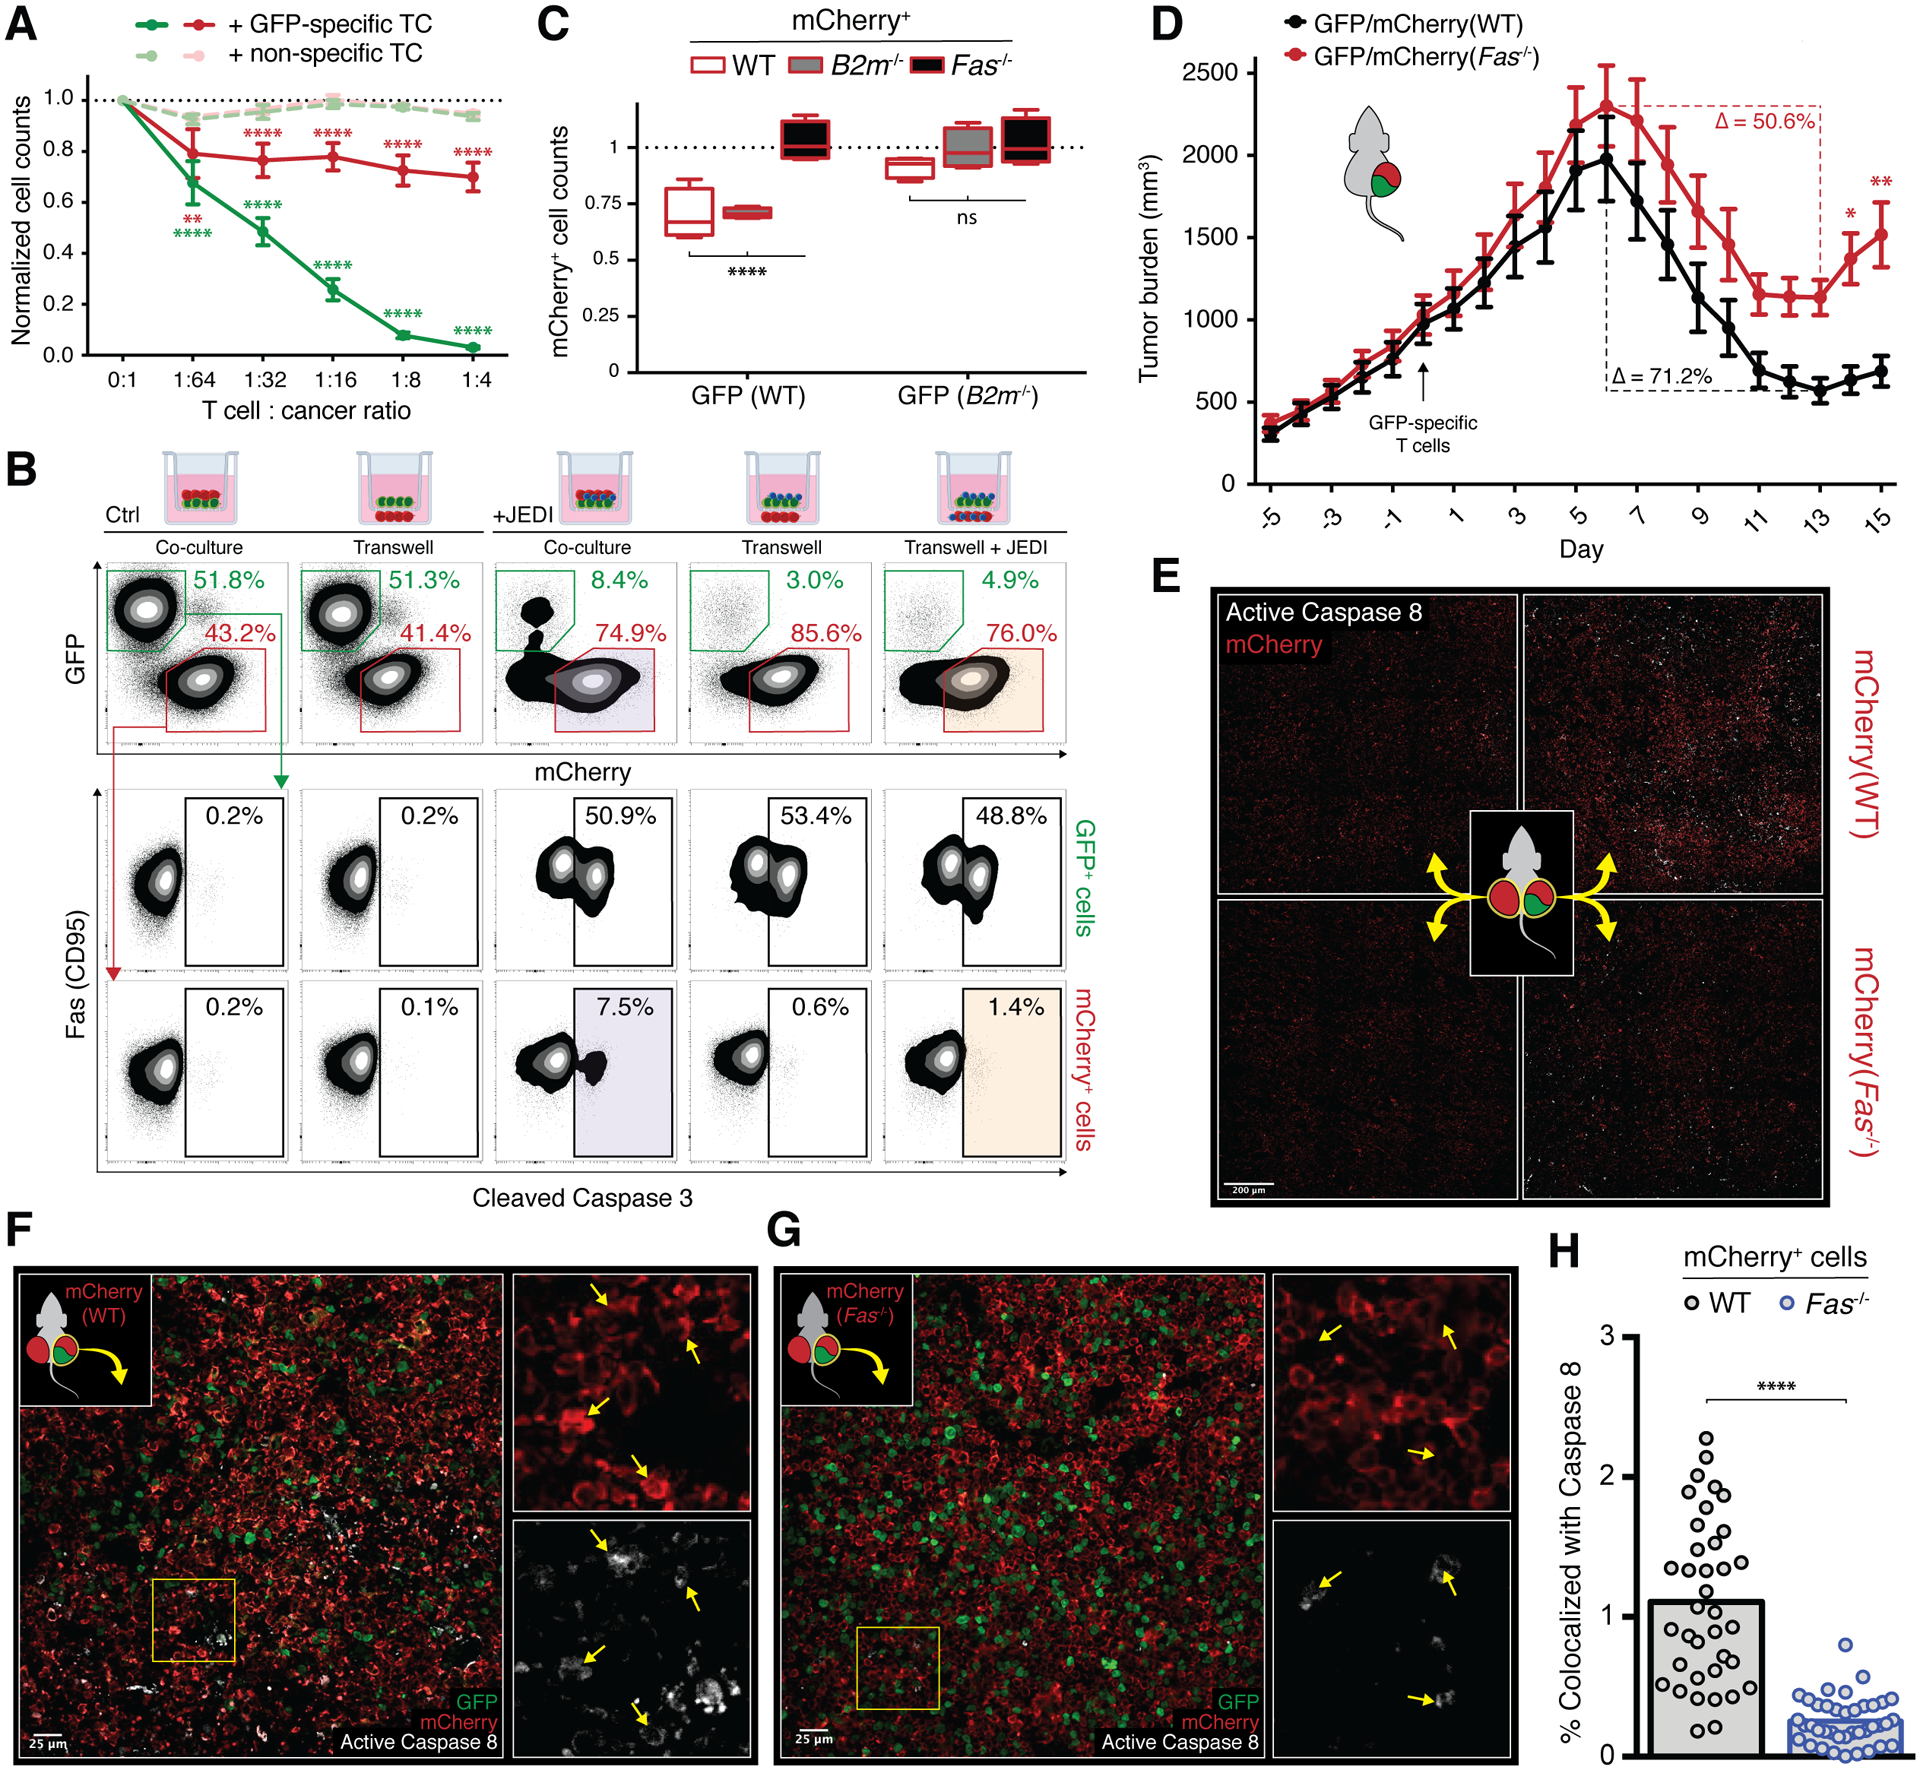
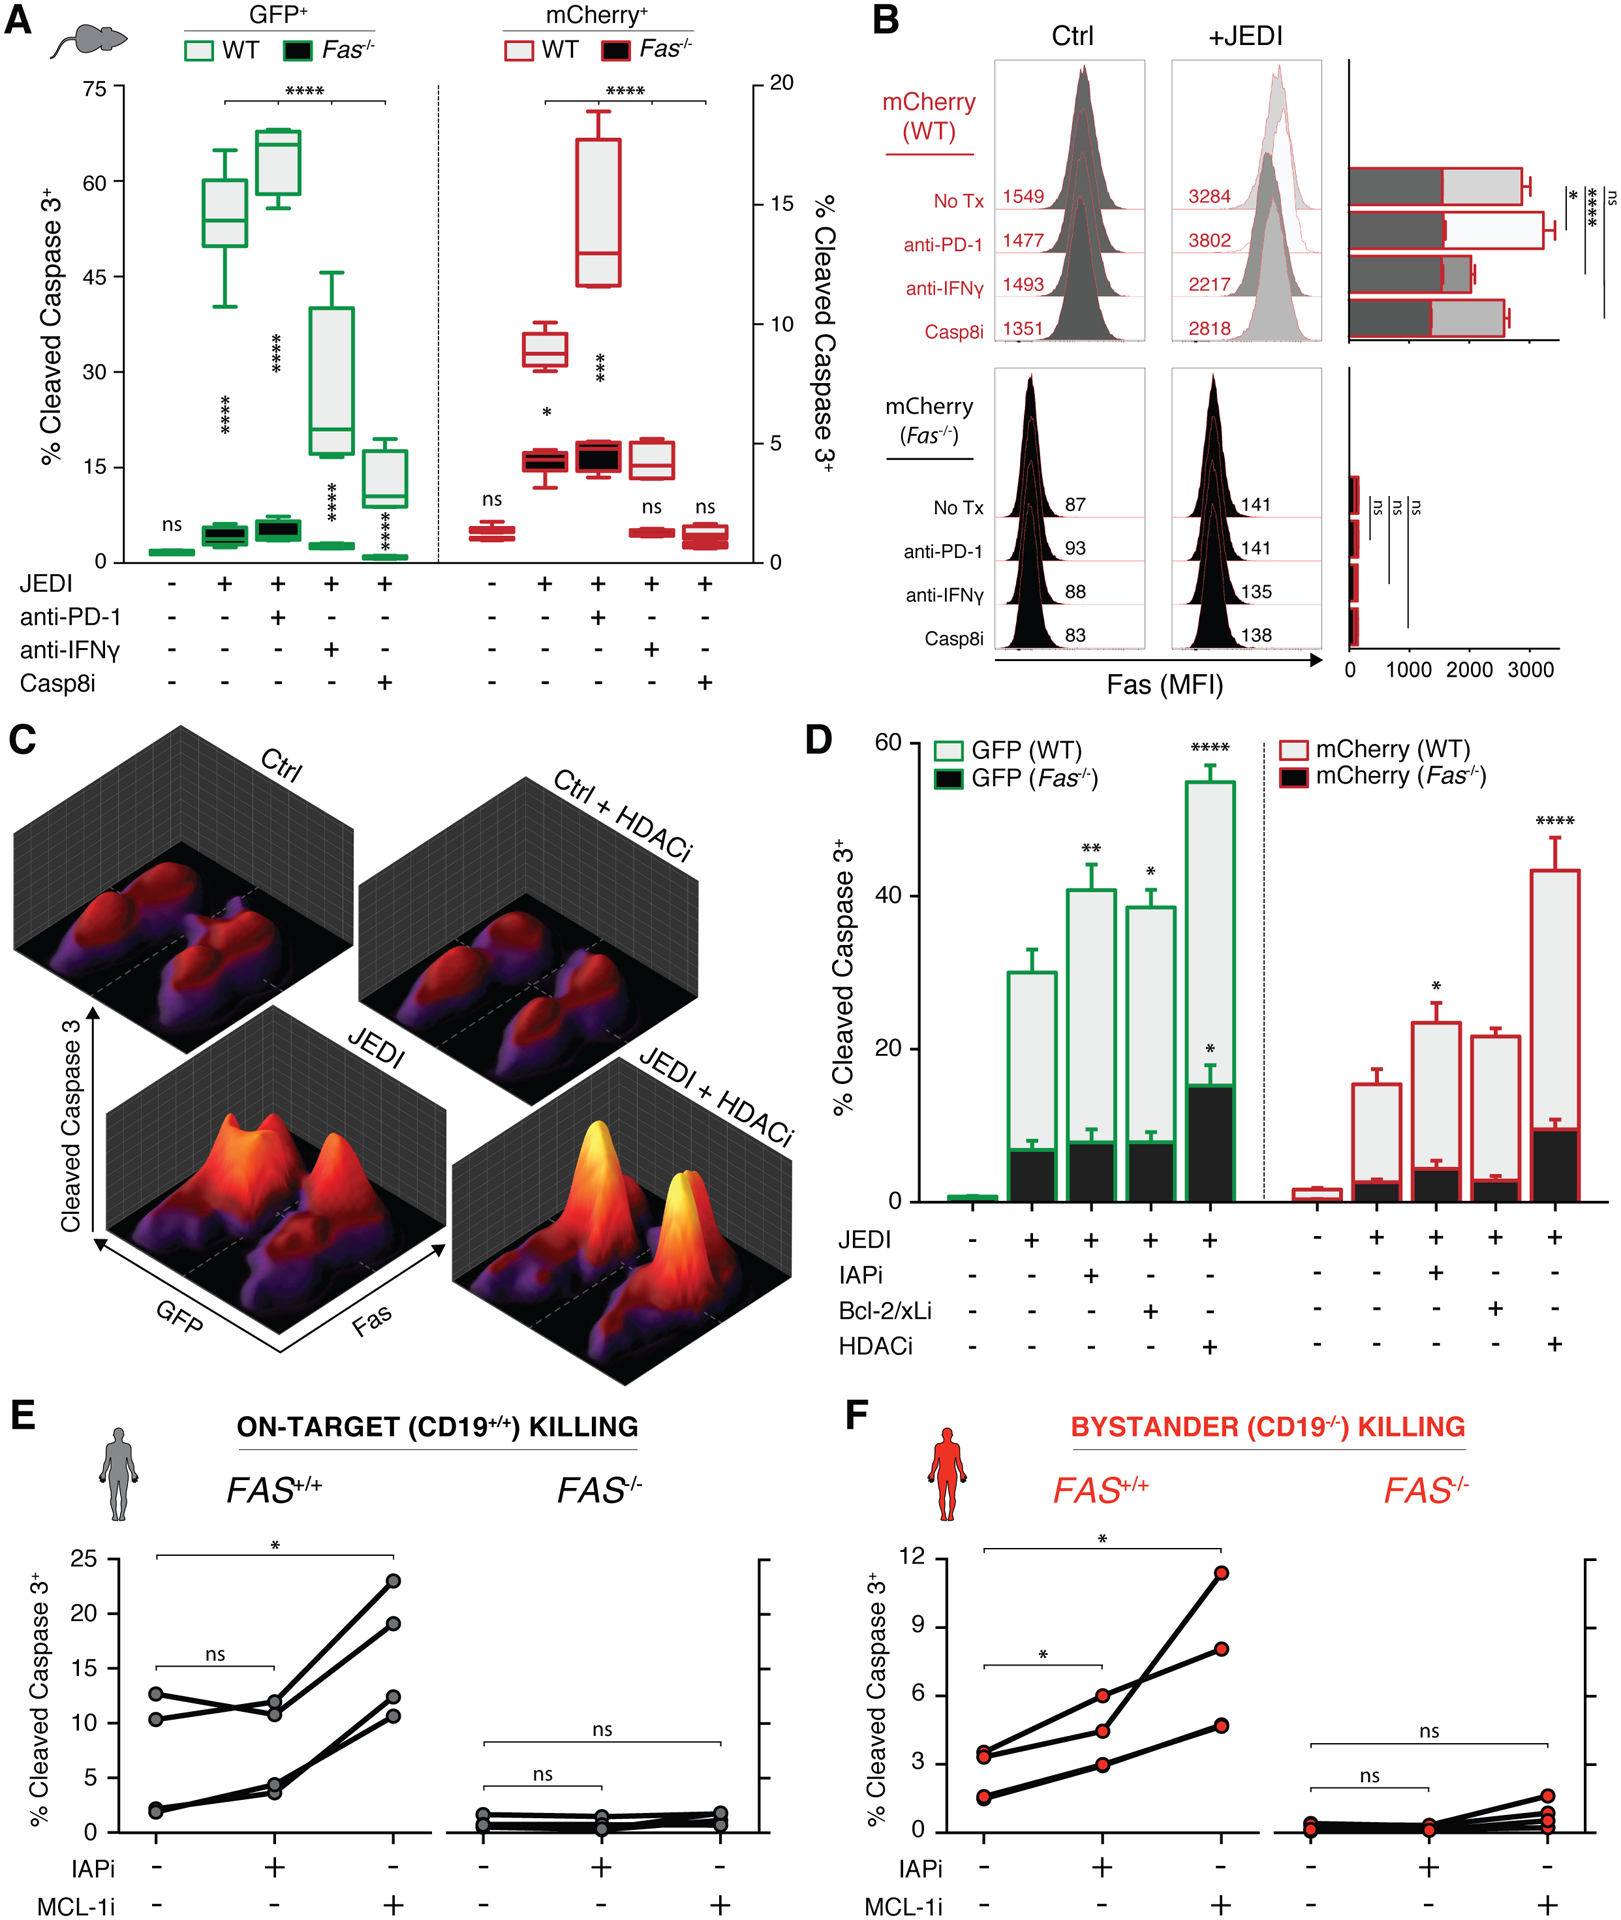
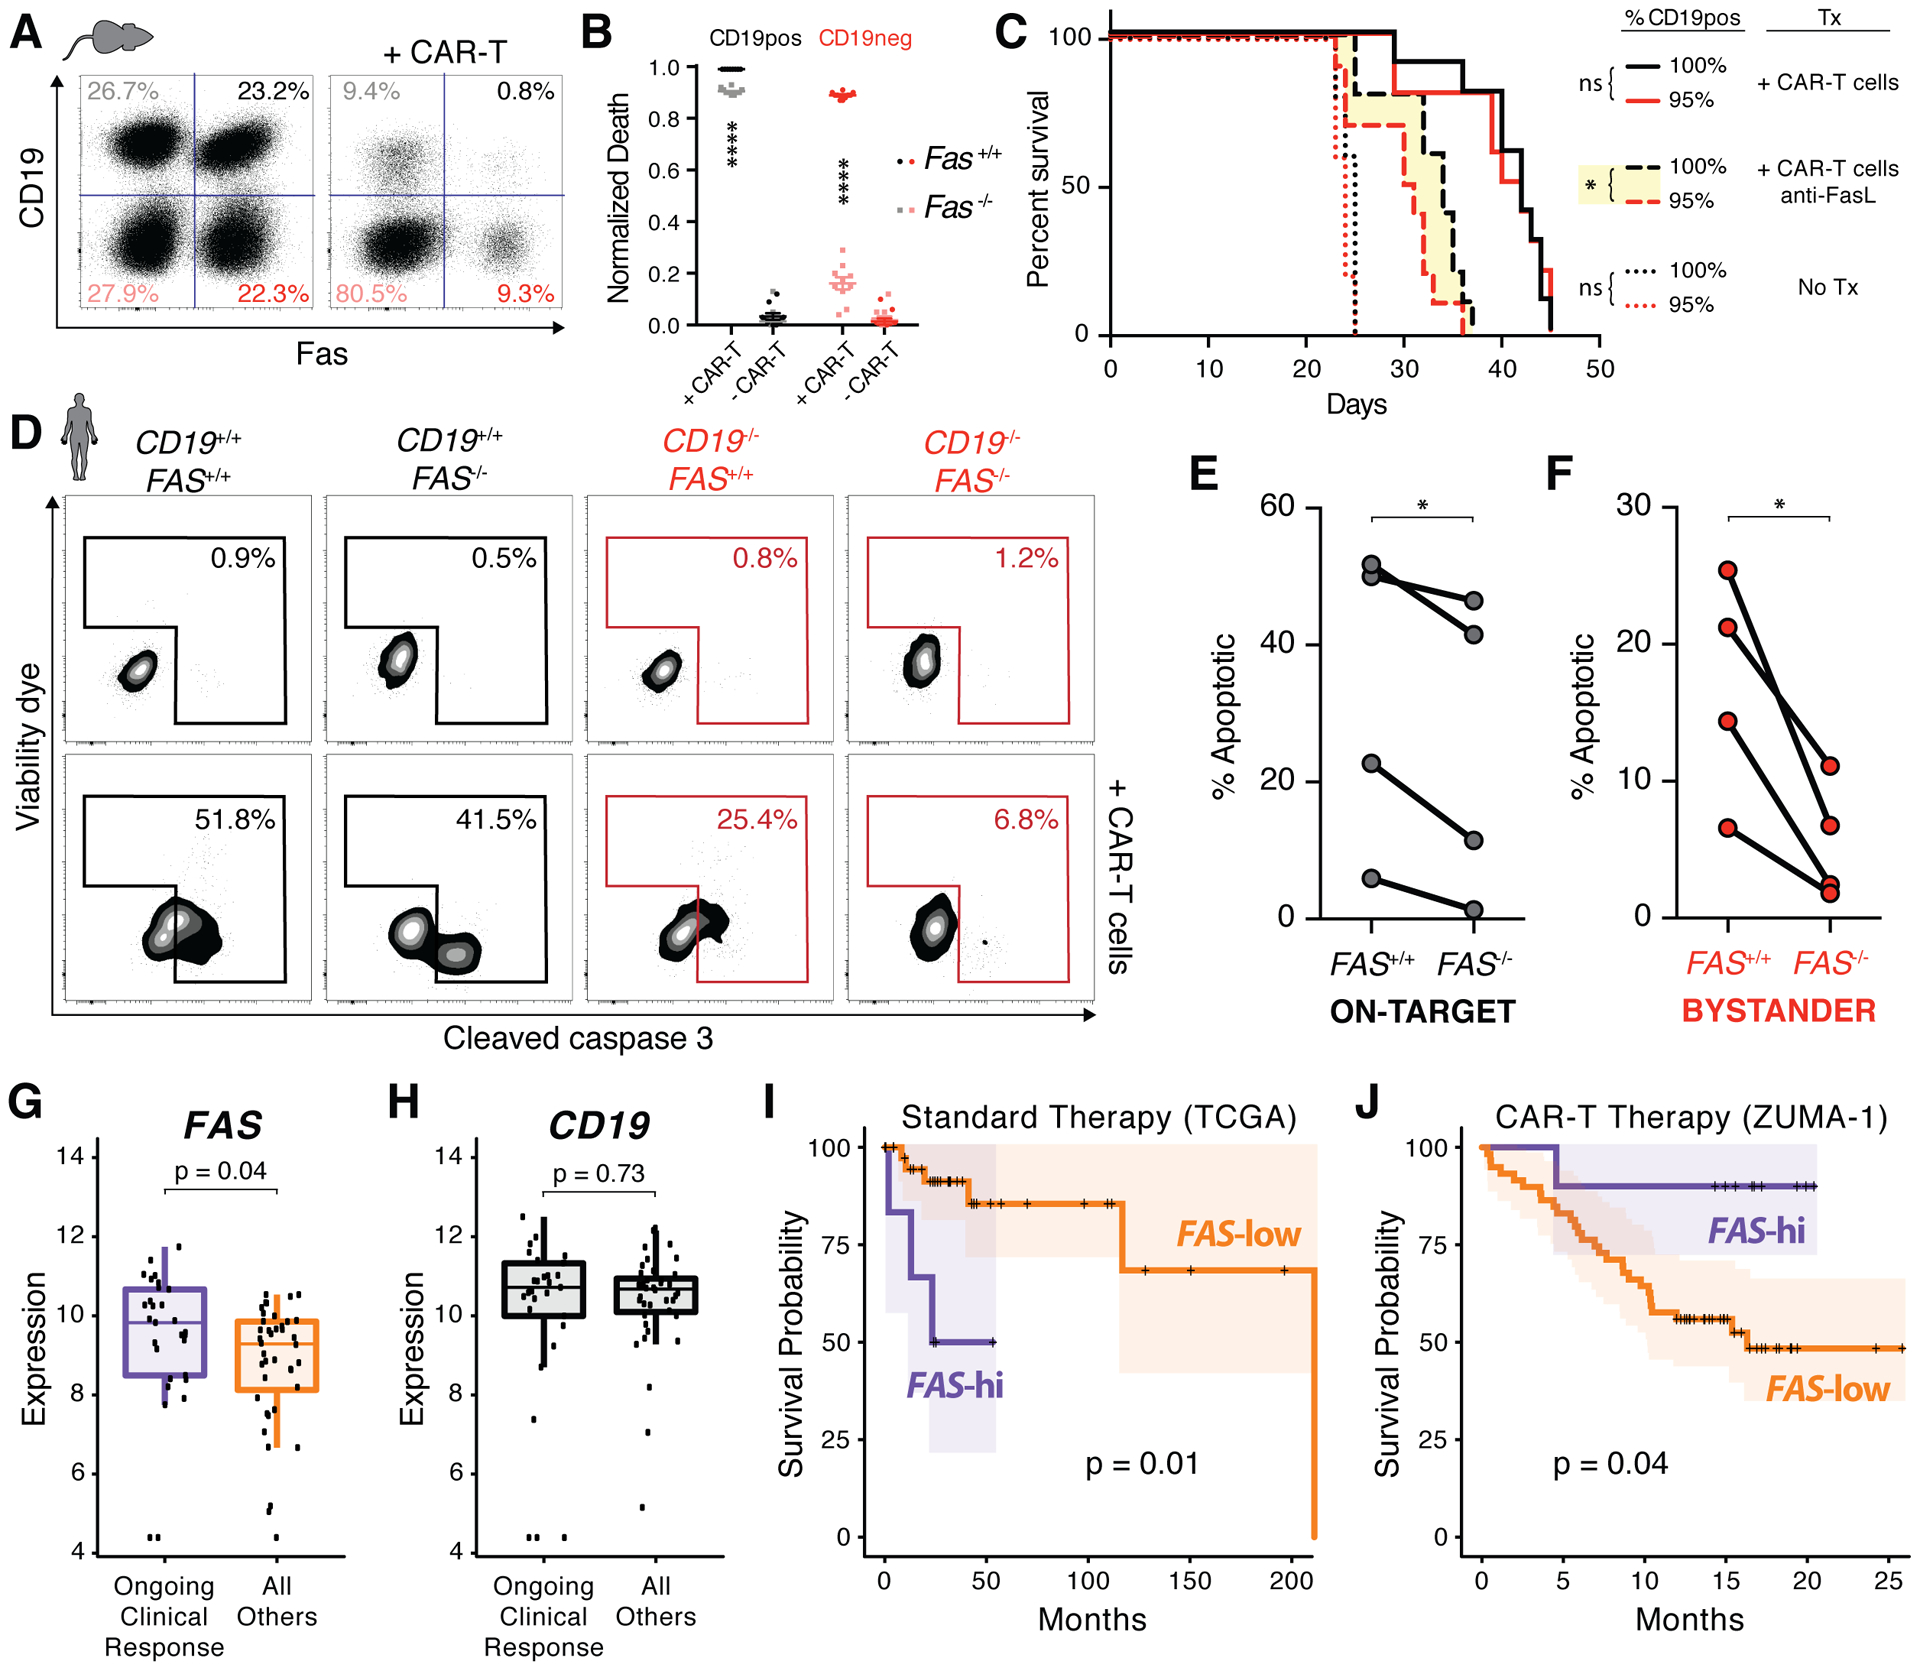
T cell-based therapies have induced cancer remissions, though most tumors ultimately progress, reflecting inherent or acquired resistance including antigen escape. Better understanding of how T cells eliminate tumors will help decipher resistance mechanisms. We used a CRISPR/Cas9 screen and identified a necessary role for Fas-FasL in antigen-specific T-cell killing. We also found that Fas-FasL mediated off-target "bystander" killing of antigen-negative tumor cells. This localized bystander cytotoxicity enhanced clearance of antigen-heterogeneous tumors in vivo, a finding that has not been shown previously. Fas-mediated on-target and bystander killing was reproduced in chimeric antigen receptor (CAR-T) and bispecific antibody T-cell models and was augmented by inhibiting regulators of Fas signaling. Tumoral FAS expression alone predicted survival of CAR-T-treated patients in a large clinical trial (NCT02348216). These data suggest strategies to prevent immune escape by targeting both the antigen expression of most tumor cells and the geography of antigen-loss variants. SIGNIFICANCE: This study demonstrates the first report of in vivo Fas-dependent bystander killing of antigen-negative tumors by T cells, a phenomenon that may be contributing to the high response rates of antigen-directed immunotherapies despite tumoral heterogeneity. Small molecules that target the Fas pathway may potentiate this mechanism to prevent cancer relapse.This article is highlighted in the In This Issue feature, p. 521.


Conflict of interest statement

Conflicts of Interest: NSc, ABo, and JR are employees of Kite Pharma. All other authors declare no competing interests.

Figures

Figure 1.
Figure 1.. A pooled CRISPR/Cas9 screen for T cell cytolytic mechanisms identifies Fas as crucial to on-target anti-cancer immunity.
A, Schema depicting screening strategy; A20-GFP cells (Ag+; green), A20-mCherry cells (Ag; red), GFP specific T cells (blue). B, Summary of 291-gene screen across 4 pooled libraries after 0, 1, or 2 iterations of selection with JEDI; each data point represents median read frequency of one small guide RNA in GFP-sorted vs. mCherry-sorted populations (n=5). C, Mean fluorescent intensity of surface fas expression in WT (black) and Fas-knockout (blue) lymphoma (left panel) and breast cancer (right panel) cell line models. D–E, Representative changes in percentage of surviving WT (top row) or Fas−/− (bottom row) GFP+ lymphoma (D) and breast cancer (E) relative to WT mCherry+ populations; co-culture conditions with JEDI T cells bolded and shaded in green. F, Representative proliferation, degranulation, and granzyme B expression of JEDI T cells, naïve or co-cultured with WT or Fas−/− GFP+ cancer; mean percent in gate ± SEM indicated (n=3). G, Tumor growth of WT (black) or Fas−/− (blue) GFP+ lymphoma in Rag1−/− mice adoptively transferred with tetramer-sorted GFP-specific CD8 T cells (arrow); error bars presented as mean ± SEM; two-way ANOVA with Sidak correction for multiple comparisons, *p<0.05 (n=4–12 mice/group; pooled from 2 independent experiments). Individual tumor curves in Supplemental Fig. S2G. H, Representative confocal IF of tumors cryopreserved from ‘+JEDI’ groups from G on day 8; area outlined in yellow magnified in inset. I, Quantification of fluorescent intensities from 22–27 fields of view as shown in H; pixel staining intensity units on a scale from 0 to 65,536 (16-bit); two-way ANOVA with Sidak correction for multiple comparisons, ****p<0.0001 (n=3–4 mice/group, pooled from 3 independent experiments).
Figure 2.
Figure 2.. Fas mediates geography-dependent off-target bystander killing of Ag tumor by Ag-specific CD8 T cells.
A, Cell counts of WT GFP+ (green) and WT mCherry+ (red) cells co-cultured with FACS purified tetramer+ (dark, GFP-specific) or tetramer (light, non-specific) activated CD8 T cells at indicated ratios; counts relative to beads and normalized to 0:1 condition; error bars presented as mean ± SEM; two-way ANOVA with Sidak correction for multiple comparisons, **p<0.01, ****p<0.0001 (n=4). B, Representative cleaved caspase 3 staining of GFP+ cells (middle row) and mCherry+ cells (bottom row) after co-culture with activated JEDI T cells in transwell configurations (top row, from left to right: GFP+ and mCherry+ in top chamber; GFP+ in top chamber / mCherry+ in bottom chamber; GFP+, mCherry+, and JEDI in top chamber; GFP+ and JEDI in top chamber / mCherry+ in bottom chamber; GFP+ and JEDI in top chamber / mCherry+ and JEDI in bottom chamber). C, Normalized cell counts of WT (white), B2m−/− (gray), or Fas−/− (black) mCherry+ cells when co-cultured with WT (left panel) or B2m−/− (right panel) GFP+ cells in the presence of JEDI T cells; boxplots presented as minimum to maximum; two-way ANOVA with Sidak correction for multiple comparisons, ****p<0.0001 (n=4). D, Growth of mixed tumors with 50% WT GFP+ cells and 50% WT mCherry+ (black) or Fas−/− mCherry+ (red) cells in Rag1−/− mice adoptively transferred with tetramer-sorted GFP-specific CD8 T cells (arrow); percent change from maximum (day 6) to minimum (day 13) of each curve indicated; error bars presented as mean ± SEM; two-way ANOVA with Sidak correction for multiple comparisons, *p<0.05, **p<0.01 (n=9 mice/group; pooled from 2 independent experiments). Individual tumor curves in Supplemental Fig. S3D. E, Tiled confocal IF of tumors from mice bearing mixed primary GFP+/mCherry+ tumors (right column) and distant secondary mCherry+ tumors (left column) with either WT (top row) or Fas−/− (bottom row) mCherry+ cells; tumors cryopreserved on days 6–8 after adoptive transfer of tetramer-sorted GFP-specific CD8 T cells (Supplementary Fig. S3F). F–G, Higher power images of primary GFP+/mCherry+ tumors with either WT (F) or Fas−/− (G) mCherry+ cells from E (right column) with insets showing magnified single channel images of area outlined in yellow; arrows point to areas of active caspase 8 staining (bottom insets) and corresponding areas of mCherry staining (top insets). H, Quantification of percent area of mCherry staining that is colocalized with active caspase 8 staining from 37–39 fields of view as shown in F and G; unpaired two-tailed t test, ****p<0.0001 (n=3–5 mice/group, pooled from 3 independent experiments).
Figure 3.
Figure 3.. Cancer cells can be sensitized to on-target and bystander killing by induced upregulation of Fas or inhibition of downstream regulators.
A, Percent of dying WT (gray) or Fas−/− (black) GFP+ (green, left panel) and mCherry+ (red, right panel) cells after 4 day co-culture with JEDI T cells, 100 μg/mL anti-PD-1, 100 μg/mL anti-IFNγ, and/or 25 μM caspase 8 inhibitor Z-IETD-FMK; boxplots presented as minimum to maximum; two-way ANOVA with Sidak correction for multiple comparisons, *p<0.05, ***p<0.001, ****p<0.0001 (n=4). B, Left panel: representative histograms and mean fluorescent intensities of surface fas expression of mCherry+ cells; right panel: quantification of replicates with error bars presented as mean ± SEM; two-way ANOVA with Sidak correction for multiple comparisons with indicated statistics for ‘+JEDI’ conditions only, *p<0.05, ****p<0.0001 (n=4). C, Representative cleaved caspase 3 expression (z-axis) simultaneously measured in 4 populations of target cancer cells (GFP+/− and fas+/−) when co-cultured with JEDI and/or 1 nM panobinostat (HDACi). D, Percent of dying WT (gray) or Fas−/− (black) GFP+ (green, left panel) and mCherry+ (red, right panel) cells after 2 day co-culture with JEDI T cells, 1 μM birinapant (IAPi), 100 nM ABT-737 (Bcl-2/xLi), and/or 1 nM panobinostat (HDACi); error bars presented as mean ± SEM; two-way ANOVA with Sidak correction for multiple comparisons with indicated statistics relative to second column of each panel, *p<0.05, **p<0.01, ****p<0.0001 (n=3). E–F, Percent of dying CD19+/+ (E) and CD19−/− (F) target Raji cells after co-culture with purified human CD8 T cells in the presence of 100 pM blinatumomab and treated with 100 nM birinapant (IAPi) or 10 nM S63845 (MCL-1i); matched data points from each healthy donor connected by lines; repeated measure one-way ANOVA with Holm-Sidak correction for multiple comparisons, *p<0.05 (n=4).
Figure 4.
Figure 4.. Fas-mediated on-target and bystander killing are critical for the efficacy of T cell immunotherapies.
A, Representative changes in 4 populations of target cells (CD19+/− and fas+/−) after co-culture with balb/c CD8 T cells retrovirally transduced with a CD19-targeting CAR construct. B, Fraction of dying cells within each population from (A) based on normalized cell counts; two-way ANOVA with Sidak correction for multiple comparisons, ****p<0.0001 (n=10). C, Survival curves of mice bearing homogeneous (black) or heterogenous (red) tumor with no therapy (dotted), CAR-T therapy (solid), and CAR-T therapy with FasL antibody blockade (dashed); Gehan-Breslow-Wilcoxon test, *p<0.05 (n=5–10 mice/group). D, Percent of dying Ag+ on-target (black) and Ag bystander (red) Raji cells when co-cultured with human CD19-targeting CAR-T cell product for 6 hours. E–F, Quantification of on-target (E) and bystander (F) apoptosis from D; matched data points from each healthy donor CAR-T cell product connected by lines; paired t-test, *p<0.05 (n=4). G–H, RNA expression (variance stabilizing transformation (VST) normalized count) of FAS (G) and CD19 (H) in pre-treatment tumor samples with ongoing clinical response (n=29) and all others (n=40) from ZUMA-1 CAR-T trial; Wilcoxon test. I–J, Kaplan-Meier survival curves with 95% confidence interval shading of TCGA DLBCL data (I; n=48, median follow-up 32 months) and ZUMA-1 data (J; n=69, median follow-up 16 months); top 14–15% stratified into FAS-hi group by maxstat package described in the methods; log-rank test.

References

    1. Park JH, Rivière I, Gonen M, Wang X, Sénéchal B, Curran KJ, et al. Long-term follow-up of CD19 CAR therapy in acute lymphoblastic leukemia. N Engl J Med 2018;378:449–59. - PMC - PubMed
    1. Maude SL, Laetsch TW, Buechner J, Rives S, Boyer M, Bittencourt H, et al. Tisagenlecleucel in children and young adults with B-Cell lymphoblastic leukemia. N Engl J Med 2018;378:439–48. - PMC - PubMed
    1. Neelapu SS, Locke FL, Bartlett NL, Lekakis LJ, Miklos DB, Jacobson CA, et al. Axicabtagene ciloleucel CAR T-Cell therapy in refractory large B-Cell lymphoma. N Engl J Med 2017;377:2531–44. - PMC - PubMed
    1. Hammerich L, Marron TU, Upadhyay R, Svensson-Arvelund J, Dhainaut M, Hussein S, et al. Systemic clinical tumor regressions and potentiation of PD1 blockade with in situ vaccination. Nat Med 2019;25:814–24. - PubMed
    1. Maier B, Leader AM, Chen ST, Tung N, Chang C, LeBerichel J, et al. A conserved dendritic-cell regulatory program limits antitumour immunity. Nature 2020;580:257–62. - PMC - PubMed

Publication types

MeSH terms

Associated data