

Association of Baseline Characteristics With Insulin Sensitivity and β-Cell Function in the Glycemia Reduction Approaches in Diabetes: A Comparative Effectiveness (GRADE) Study Cohort
- PMID: 33334808
- PMCID: PMC7818323
- DOI: 10.2337/dc20-1787
Association of Baseline Characteristics With Insulin Sensitivity and β-Cell Function in the Glycemia Reduction Approaches in Diabetes: A Comparative Effectiveness (GRADE) Study Cohort
Abstract
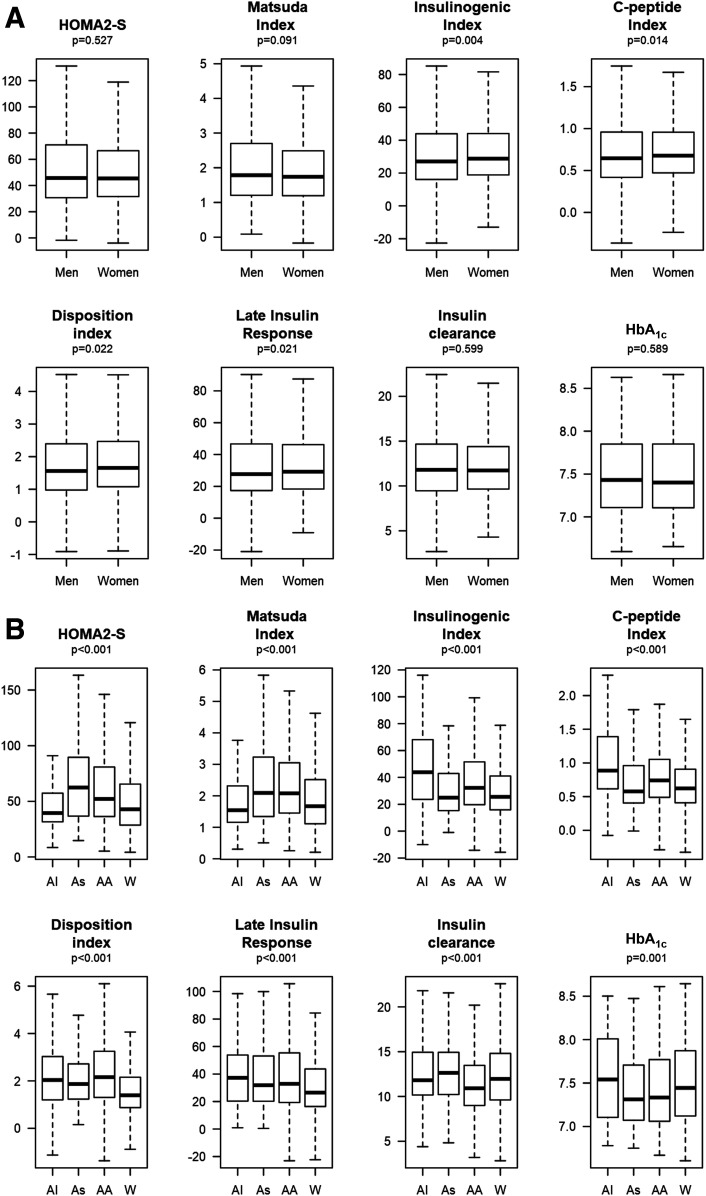
Objective: We investigated sex and racial differences in insulin sensitivity, β-cell function, and glycated hemoglobin (HbA1c) and the associations with selected phenotypic characteristics.
Research design and methods: This is a cross-sectional analysis of baseline data from 3,108 GRADE (Glycemia Reduction Approaches in Diabetes: A Comparative Effectiveness Study) participants. All had type 2 diabetes diagnosed <10 years earlier and were on metformin monotherapy. Insulin sensitivity and β-cell function were evaluated using the HOMA of insulin sensitivity and estimates from oral glucose tolerance tests, including the Matsuda Index, insulinogenic index, C-peptide index, and oral disposition index (DI).
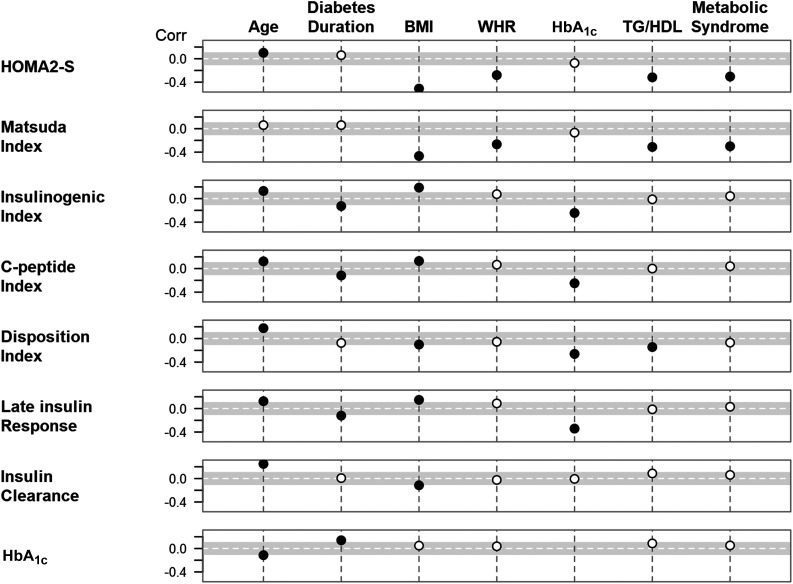
Results: The cohort was 56.6 ± 10 years of age (mean ± SD), 63.8% male, with BMI 34.2 ± 6.7 kg/m2, HbA1c 7.5 ± 0.5%, and type 2 diabetes duration 4.0 ± 2.8 years. Women had higher DI than men but similar insulin sensitivity. DI was the highest in Black/African Americans, followed by American Indians/Alaska Natives, Asians, and Whites in descending order. Compared with Whites, American Indians/Alaska Natives had significantly higher HbA1c, but Black/African Americans and Asians had lower HbA1c. However, when adjusted for glucose levels, Black/African Americans had higher HbA1c than Whites. Insulin sensitivity correlated inversely with BMI, waist-to-hip ratio, triglyceride-to-HDL-cholesterol ratio (TG/HDL-C), and the presence of metabolic syndrome, whereas DI was associated directly with age and inversely with BMI, HbA1c, and TG/HDL-C.
Conclusions: In the GRADE cohort, β-cell function differed by sex and race and was associated with the concurrent level of HbA1c. HbA1c also differed among the races, but not by sex. Age, BMI, and TG/HDL-C were associated with multiple measures of β-cell function and insulin sensitivity.
Trial registration: ClinicalTrials.gov NCT01794143.
© 2020 by the American Diabetes Association.
Figures
References
Publication types
MeSH terms
Substances
Associated data
Grants and funding
- UL1 TR000445/TR/NCATS NIH HHS/United States
- UL1 TR002529/TR/NCATS NIH HHS/United States
- P30 DK020541/DK/NIDDK NIH HHS/United States
- UL1 TR002378/TR/NCATS NIH HHS/United States
- P30 DK020572/DK/NIDDK NIH HHS/United States
- UL1 TR002243/TR/NCATS NIH HHS/United States
- P30 DK124723/DK/NIDDK NIH HHS/United States
- UL1 TR002345/TR/NCATS NIH HHS/United States
- P30 DK017047/DK/NIDDK NIH HHS/United States
- UL1 TR002548/TR/NCATS NIH HHS/United States
- U34 DK088043/DK/NIDDK NIH HHS/United States
- UL1 TR002537/TR/NCATS NIH HHS/United States
- P30 DK092926/DK/NIDDK NIH HHS/United States
- UL1 TR002535/TR/NCATS NIH HHS/United States
- P30 DK072476/DK/NIDDK NIH HHS/United States
- P30 DK079626/DK/NIDDK NIH HHS/United States
- UL1 TR001409/TR/NCATS NIH HHS/United States
- U01 DK098246/DK/NIDDK NIH HHS/United States
- UL1 TR001449/TR/NCATS NIH HHS/United States
- UL1 TR002489/TR/NCATS NIH HHS/United States
- U54 GM104940/GM/NIGMS NIH HHS/United States
- UL1 TR001108/TR/NCATS NIH HHS/United States
- P30 DK045735/DK/NIDDK NIH HHS/United States
- UL1 TR000439/TR/NCATS NIH HHS/United States
