. 2021 Jan 1;35(1-2):157-174.
doi: 10.1101/gad.343053.120. Epub 2020 Dec 17.

Conserved Gsx2/Ind homeodomain monomer versus homodimer DNA binding defines regulatory outcomes in flies and mice

Affiliations

Conserved Gsx2/Ind homeodomain monomer versus homodimer DNA binding defines regulatory outcomes in flies and mice

Joseph Salomone et al. Genes Dev. .

Abstract

How homeodomain proteins gain sufficient specificity to control different cell fates has been a long-standing problem in developmental biology. The conserved Gsx homeodomain proteins regulate specific aspects of neural development in animals from flies to mammals, and yet they belong to a large transcription factor family that bind nearly identical DNA sequences in vitro. Here, we show that the mouse and fly Gsx factors unexpectedly gain DNA binding specificity by forming cooperative homodimers on precisely spaced and oriented DNA sites. High-resolution genomic binding assays revealed that Gsx2 binds both monomer and homodimer sites in the developing mouse ventral telencephalon. Importantly, reporter assays showed that Gsx2 mediates opposing outcomes in a DNA binding site-dependent manner: Monomer Gsx2 binding represses transcription, whereas homodimer binding stimulates gene expression. In Drosophila, the Gsx homolog, Ind, similarly represses or stimulates transcription in a site-dependent manner via an autoregulatory enhancer containing a combination of monomer and homodimer sites. Integrating these findings, we test a model showing how the homodimer to monomer site ratio and the Gsx protein levels defines gene up-regulation versus down-regulation. Altogether, these data serve as a new paradigm for how cooperative homeodomain transcription factor binding can increase target specificity and alter regulatory outcomes.

Keywords: CUT&RUN; Gsx2; Ind; lateral ganglionic eminence (LGE); transcriptional activation versus repression.


Figures

Figure 1.
Figure 1.
Gsx2 binds and negatively regulates its own expression in the mouse telencephalon. (A,B) Increased EGFP expression from the Gsx2 locus in the LGE of E12.5 Gsx2EGFP/RA (i.e., null) embryos compared with a Gsx2EGFP/+ sibling. (C) RNA-seq analysis from wild-type and Gsx2EGFP/RA LGE shows significant up-regulation of the Gsx2 first exon (bracket). The experiment was performed using biological quadruplicates. (*) Log2 fold change = 1.24; FDR = 7.7 × 10⁻³³ by EdgeR exact test. The black triangle represents a loxP site. (D) ChIP-seq for P300 and H3K27ac reveals potential regulatory elements around the Gsx2 locus. The locations of the 687 and 678 enhancers are highlighted and vertebrate conservation is noted at the bottom. (E) ChIP-PCR data showing Gsx2 binds to 687 in E12.5 LGEs relative to both input chromatin and control IgG samples. Blue bars denote fold enrichment using 687-specific primers, whereas gray bars denote fold enrichment for the control Actb open reading frame (ORF). (*) P-value < 0.05 using an unpaired two-tailed Student's t-test.
Figure 2.
Figure 2.
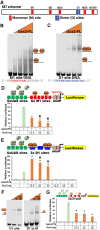
Gsx2 differentially regulates gene expression via two types of binding sites. (A) Schematic of the 687 enhancer with the M sites (red, M1–M9) and D site (blue, D1) noted. Sequence of 687 is reported in Supplemental Document 1. (B,C) Comparative EMSAs using an M1 and D1 probe with equal amounts of full-length Gsx2 reveals monomer and dimer binding, which are highlighted using schematics at right of each gel. The sequences of each site (M1 and D1) are noted below each EMSA. (D) Schematic of Luciferase reporter containing five UAS sites, six M1 sites, and a minimal promoter that encodes a predicted M site (red bar). Luciferase assay from mK4 cells transfected with 25 ng of UAS-6xM1-Luciferase, 5 ng of Gal4VP16 alone (green bar), and the indicated amounts of Gsx2 (orange bars) revealed that Gsx2 represses Gal4VP16-mediated activation. An ANOVA with Tukey post-hoc was used to determine significance. (*) P < 0.01 compared with Gal4VP16 alone, (╪) P < 0.01 compared with 12.5 ng of Gsx2. (E) Schematic of Luciferase reporter containing five UAS sites, three D1 sites, and a minimal promoter that encodes a predicted M site (red bar). Luciferase assays from mK4 cells transfected with 25 ng of UAS-3xD1-Luciferase, 5 ng of Gal4VP16 alone (green bar), and the indicated amounts of Gsx2 (orange bars) revealed enhanced Gal4VP16 activation in presence of Gsx2. Note, Gsx2 does not induce gene expression in the absence of Gal4-VP16, suggesting it is insufficient to activate transcription. An ANOVA with Tukey post-hoc was used to determine significance. (*) P < 0.01 compared with Gal4VP16 alone, (╪) P < 0.01 compared with 12.5 ng of Gsx2. (F) EMSAs using purified Gsx2 (167–305) protein reveals cooperative dimer binding to the D1 site but noncooperative monomer binding to the D1-to-M probe. Each EMSA binding reaction had a final concentration of 34 nM labeled DNA probe with either no protein added (first lane) or with 140 or 280 nM purified Gsx2 (167–305) protein. (G) UAS-3xD1toM-luciferase activity is repressed, and not up-regulated by Gsx2. Twenty-five nanograms of luciferase reporter, 5 ng of Gal4-VP16 if indicated by a plus sign, and the noted amount of Gsx2 were transfected. An ANOVA with Tukey post-hoc was used to determine significance. (*) P < 0.01 compared with Gal4VP16 alone.
Figure 3.
Figure 3.
Gsx2 requires domains flanking the homeodomain and precisely spaced and oriented DNA sites to cooperatively bind D sites. (A) EMSAs using the 687-D1 probe and purified Gsx2 proteins containing the flanking regions plus homeodomain (167–305, left) or only the HD (light blue, right). Each EMSA binding reaction had 34 nM labeled DNA probe with the following concentrations of either the Gsx2 (167–305) or Gsx2 HD protein: 0 nM (i.e., probe alone), and 2.34, 4.69, 9.38, 18.75, 37.5, 75, and 150 nM. Note, the purity of the Gsx2 (167–305) and Gsx2-HD proteins are shown by SDS-PAGE analysis and gel staining in Supplemental Figure S2A. Schematics highlight the fact that the Gsx2 + flanking region protein more readily forms dimer complexes than the HD only protein. (B) Hill coefficient calculations from EMSAs reveal that the Gsx2+flanking protein binds D sites cooperatively (Hill coefficient = 1.84), whereas the HD alone does not (Hill coefficient = 1.17). (C) Summary of scanning mutagenesis and Gsx2 EMSA data highlighting the nucleotides in the 687 D1 probe required for cooperative (C) versus noncooperative (N) binding. EMSAs are shown in Supplemental Figure S2B–M. (D) Summary of Gsx2 EMSA data using probes with insertion of different numbers of nucleotides reveals that a 7-bp spacer is required for cooperative binding to the D1 probe. Note, the +3-bp insertion generated a new “D site” with the required 7-bp spacing. EMSAs are shown in Supplemental Figure S2N–R. (E) Summary of Gsx2 EMSA data using probes engineered with a nonpalindromic D site in different orientations and spacing. Note, only the F3F probe contains the required orientation and spacing to mediate cooperative binding. EMSAs are shown in Supplemental Figure S2S–BB. (F) Optimal Gsx2 D site with a 7-bp spacer as defined by EMSAs.
Figure 4.
Figure 4.
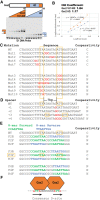
Analysis of HT-SELEX data reveals that the human GSX2 protein enriches for dimer DNA binding sites. (A) The percentage of sequences that contain an optimal D site motif as a function of SELEX cycle. Note, the “0” cycle is the starting library and enrichment for D sites is observed in successive SELEX cycles using the human GSX2 protein. (B) The percentage of sequences with two sites by spacer length. Note, the highest frequency occurs with the 7-bp spacer. (C) The D site PWM motif from MEME de novo motif search on the human GSX2 HT-SELEX data after the fourth round of selection. (D) ChIP-seq for P300 and H3K27ac in E12.5 forebrain tissue revealed strong signals at the characterized Gsx2 DSG enhancer. The location of DSG is boxed and the sequence of an optimal D site (blue) as well as predicted M sites (red) within the DSG are noted. Sequence of the DSG is reported in Supplemental Document 1. (E) EMSA using Gsx2 (167-305) reveals cooperative dimer binding to the DSG D site. Each EMSA binding reaction had 34 nM of labeled DNA probe and the following concentrations of the Gsx2 (167–305) protein: 0 nM (i.e., probe alone), or 46.5, 93, 186, or 372 nM. Note, a larger image of this exact same gel is shown in Supplemental Figure S2CC. (F) UAS-3xDSGD-Luciferase activity revealed enhanced Gal4VP16 activation in the presence of Gsx2. The amounts of transfected plasmid are noted. (*) P < 0.05 using an unpaired two-tailed Student's t-test compared with Gal4VP16 alone.
Figure 5.
Figure 5.
Genomic analysis of Gsx2 binding in the mouse LGE reveals enrichment of monomer and dimer sites. (A) Schematic of the 2XFLAG-Gsx2 with the homeodomain (HD) highlighted in light blue. (B) Immunostaining of an E12.5 Gsx22XFLAG/2XFLAG mouse telencephalon reveals extensive colocalization of Gsx2 (green) and FLAG (red) in the expected LGE expression pattern. (C) Gsx2/Pax6 double staining shows that Dorsal-Ventral patterning in the E12.5 Gsx22XFLAG/2XFLAG telencephalon appears normal. (D) Replicate CUT&RUN analysis of FLAG-Gsx2 genomic binding to the Gsx2 locus in comparison with IgG controls. Note, significant FLAG-Gsx2 binding to both the 687 and DSG enhancers. (E) Genomic annotation of Gsx2 peaks using HOMER. Note, most peaks are found in intergenic and intronic regions. (F) Top motifs identified by HOMER reveal significant M and D site enrichment. (G) The number of occurrences of two ATTA sites by spacer length in Gsx2 CUT&RUN peaks. Note, like with the SELEX assay (Fig. 4B), the strongest peak occurs with the 7-bp spacer. (H) Alignment of the top 2126 sites containing Gsx2 D sites identified by MEME and secondary filtering for footprint contrast. Sequences are color-coded and outside of the ATTA motifs, there is limited sequence similarity between sites. (I) MNase digestion footprint of the genomic Gsx2 D sites. All sequences were aligned centered on the D motif with the most highly protected sites overlapping the D motif. (J) CUT&RUN signal at Gsx2 peaks either containing at least one D site (1591 peaks, Red) or lacking a D site (1441 peaks, blue). (K) Normalized tag counts (RPM) within a 300-bp window around Gsx2 peaks containing at least one D site versus all other peaks. (*) Wilcoxon test. (L) Alignment of the top 5591 sites containing Gsx2 M sites that do not overlap with a D site. (M) MNase digestion footprint of the genomic Gsx2 M sites. All sequences were aligned centered on the M motif.
Figure 6.
Figure 6.
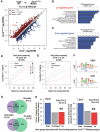
Peaks containing D and M sites are associated with gene expression changes in the LGE of Gsx2-null embryos. (A) RNA-seq analysis from LGE tissue of E12.5 WT (Gsx2+/+) and Gsx2-null (Gsx2EGFP/RA) embryos reveals genes that are significantly up-regulated (red) and down-regulated (blue) in the absence of Gsx2. Significantly altered expression of transcription factors important for forebrain patterning and neurogenesis are labeled. Differentially expressed genes were defined by fold change >1.5 and FDR < 0.05. (B,C) GO analysis on genes upregulated (B) and downregulated (C) in Gsx2-null embryos reveals Biological Process GO terms related to neural development. (D,E) Genes were divided into down-regulated (blue), up-regulated (red), or unchanged (gray) groups. The cumulative percentage of genes in each group that had a Gsx2 CUT&RUN peak with an M and D site (D) or with no M or D site (E) within a certain distance up to 100 kb from their TSS is plotted. Note, only those peaks with an M and D site are significantly associated with up-regulated and down-regulated genes in Gsx2-null LGEs, whereas those lacking M and D sites are not associated with gene expression changes of nearby genes. (*) P-value < 0.05. Similar analysis for Gsx2 CUT&RUN peaks selected only on the basis of having a D site (F) or a M site (G) is shown in Supplemental Figure S6. (F) Comparative PWM logos generated from previously published HT-SELEX assays (Jolma et al. 2013) reveals nearly identical GSX2 monomer (top) and DLX1 (bottom) DNA-binding sites, consistent with these TFs binding largely the same DNA sites. (G) Comparative genomic binding analysis of the Gsx2 CUT&RUN data from E12.5 mouse LGEs and the previously published Dlx (Lindtner et al. 2019) ChIP-seq data from E11.5 (top) and E13.5 (bottom) mouse forebrains reveals significant overlap in genomic binding between Gsx2 and the Dlx factors. (H) Analysis of Gsx2 and Dlx binding to the same genomic regions associated within a 100 kb window around gene TSSs that are either down-regulated (blue bars), unchanged (gray bars), or up-regulated (red bars) in Gsx2 mutant LGEs. The percentage of Gsx2 genomic binding events that were also bound by at least two Dlx factors (see the Materials and Methods) for each group of genes is calculated using the published E11.5 (left) and E13.5 (right) ChIP-seq data for Dlx1, Dlx2, and Dlx5 (Lindtner et al. 2019). Note, those genes that are down-regulated in Gsx2 mutant LGEs are significantly enriched for nearby genomic regions that bind both Dlx and Gsx2 factors compared with the unchanged group (P-value by Fisher's exact test). In contrast, the up-regulated gene group is not significantly different from the unchanged gene group. Thus, a substantial portion of genes down-regulated in Gsx2 mutant animals is likely due to the indirect loss of Dlx transcription factor expression.
Figure 7.
Figure 7.
Relative numbers of monomer and dimer sites determine transcriptional response to Ind in Drosophila embryos. (A) Comparative EMSAs using the 687 M1 and D1 probes with equal amounts of full-length Ind reveals monomer versus dimer binding, which are schematically highlighted adjacent to each gel. (BD) Ventral view of stage 10 Drosophila embryos with wild type ind-lacZ, M mut ind-lacZ, and D mut ind-lacZ immunostained for β-gal (green). Note, the two stripes of β-gal-positive cells are neuroblasts that express endogenous Ind (red). (E,F) Box plot of β-gal (E) and Ind (F) intensities from at least 10 embryos for each transgene. Each dot represents average β-gal or Ind intensity in an embryo, center lines show median, box limits indicate 25th and 75th percentile, and asterisks denotes significance (P < 0.01).
Figure 8.
Figure 8.
Relative numbers of monomer and dimer sites and concentration of Gsx2 determine transcriptional response in mouse mK4 cells. (A) Gsx2 EMSA competition for binding to the DSG-D site probe (magenta) and the M1 probe (green) in the same reaction. Each EMSA binding reaction had 3.4 nM each labeled DNA probe with either no protein added (first lane) or with 20, 28, 40, 56, 80, or 113 nM purified Gsx2 (167–305). Note, the free D site probe is depleted more rapidly than free M site probe as Gsx2 protein is increased. (B) EMSA in A was performed in quadruplicate and quantified. The Gsx2 concentration in each lane is indicated. The ratio of free probe to total probe is plotted as a function of Gsx2 protein concentration with error bars indicating standard deviation. (*) P < 0.05 using an unpaired two-tailed Student's t-test comparing M and D values at each Gsx2 concentration. (C) Schematics of Luciferase reporters containing three DSG-D sites, and either two wild-type or mutant M1 sites. (D) Luciferase assays in mammalian mK4 cells using reporters containing 3xDSG D sites and either 2× wild-type M1 (red bars) or mutant M sites (gray bars). Note, Gsx2 strongly stimulates the construct containing the mutant M site but only weakly stimulates the reporter with the wild-type M sites. 25 ng of indicated luciferase reporter and 5 ng of Gal4-VP16 expression vector were transfected where indicated (+). The amount of Gsx2 plasmid transfected is noted. A two-way ANOVA with Tukey post hoc was used to determine significance. (*) P < 0.05 compared with Gal4VP16 alone, (*) P < 0.05 comparing M site reporter with M mutant reporter at indicated concentration of Gsx2. (EG) Model of Gsx regulation of enhancers containing different ratios of D and M sites. (E) At low concentrations, Gsx factors bind dimer sites, and stimulate target gene transcription on each enhancer with D sites. (F) At moderate concentrations, Gsx factors differentially regulate target gene expression based on the ratio of D-to-M sites: Those enhancers with a relatively high D-to-M site ratio will increase in activity, whereas those with low D-to-M site ratios will recruit Gsx2 to M sites and repress gene expression. (G) At high Gsx concentrations, Gsx2 will bind M sites to repress enhancers with both high and low D-to-M site ratios. As examples, we are modeling two different enhancers; one that represents the fly ind enhancer and the other is the mouse 687 enhancer.

Similar articles

Cited by

References

    1. Berger MF, Badis G, Gehrke AR, Talukder S, Philippakis AA, Peña-Castillo L, Alleyne TM, Mnaimneh S, Botvinnik OB, Chan ET, et al. 2008. Variation in homeodomain DNA binding revealed by high-resolution analysis of sequence preferences. Cell 133: 1266–1276. 10.1016/j.cell.2008.05.024 - DOI - PMC - PubMed
    1. Bischof J, Maeda RK, Hediger M, Karch F, Basler K. 2007. An optimized transgenesis system for Drosophila using germ-line-specific φC31 integrases. Proc Natl Acad Sci 104: 3312–3317. 10.1073/pnas.0611511104 - DOI - PMC - PubMed
    1. Bürglin TR, Affolter M. 2016. Homeodomain proteins: an update. Chromosoma 125: 497–521. 10.1007/s00412-015-0543-8 - DOI - PMC - PubMed
    1. Castro DS, Martynoga B, Parras C, Ramesh V, Pacary E, Johnston C, Drechsel D, Lebel-Potter M, Garcia LG, Hunt C, et al. 2011. A novel function of the proneural factor Ascl1 in progenitor proliferation identified by genome-wide characterization of its targets. Genes Dev 25: 930–945. 10.1101/gad.627811 - DOI - PMC - PubMed
    1. Corbin JG, Gaiano N, Machold RP, Langston A, Fishell G. 2000. The Gsh2 homeodomain gene controls multiple aspects of telencephalic development. Development 127: 5007–5020. - PubMed

Publication types