. 2021 Jan-Jun:296:100192.
doi: 10.1074/jbc.RA120.015995. Epub 2020 Dec 20.

Post-translational modification analysis of Saccharomyces cerevisiae histone methylation enzymes reveals phosphorylation sites of regulatory potential

Affiliations

Post-translational modification analysis of Saccharomyces cerevisiae histone methylation enzymes reveals phosphorylation sites of regulatory potential

Ryan J Separovich et al. J Biol Chem. 2021 Jan-Jun.

Abstract

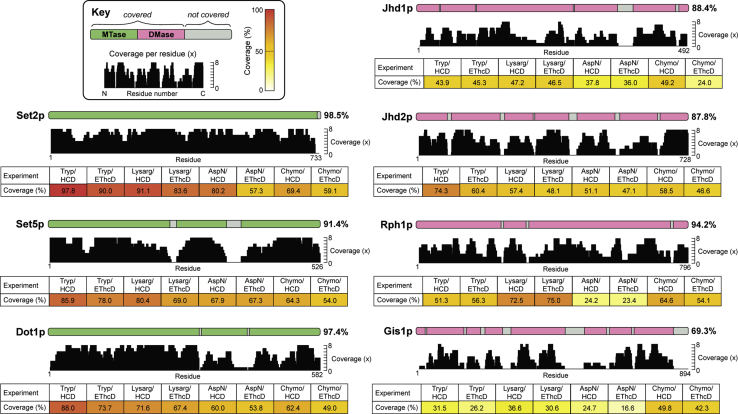
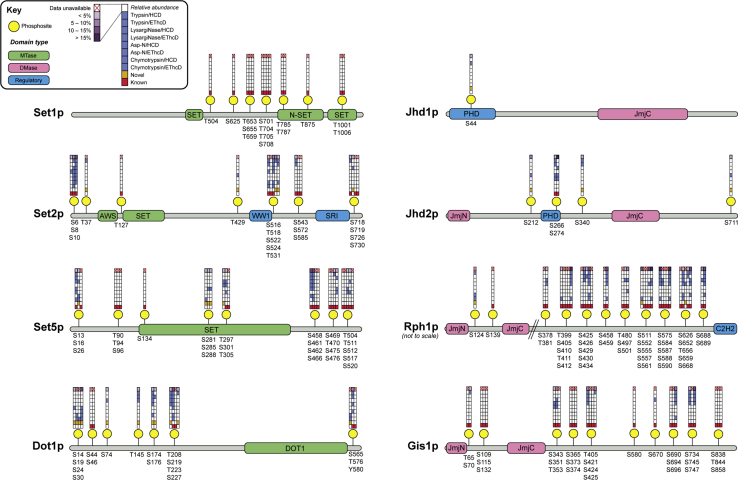
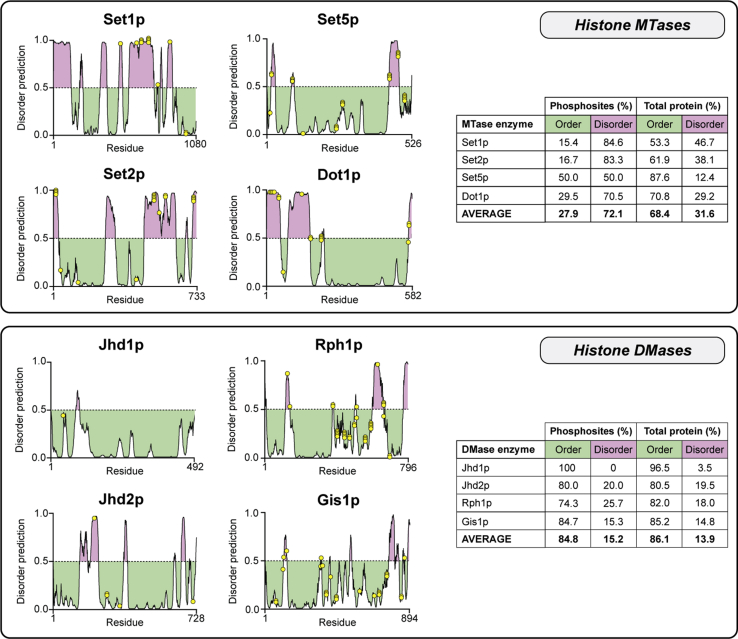
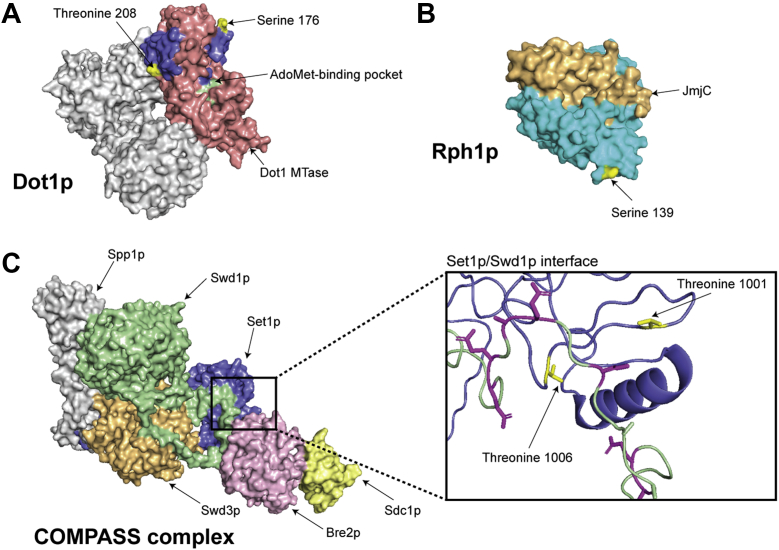
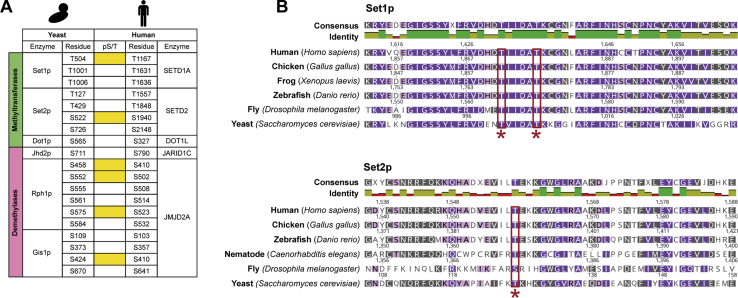
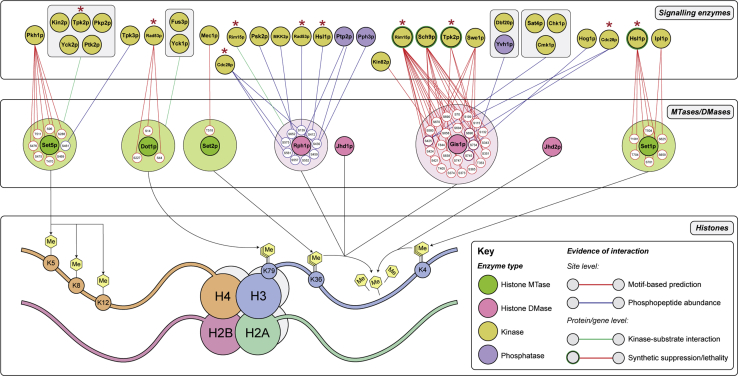
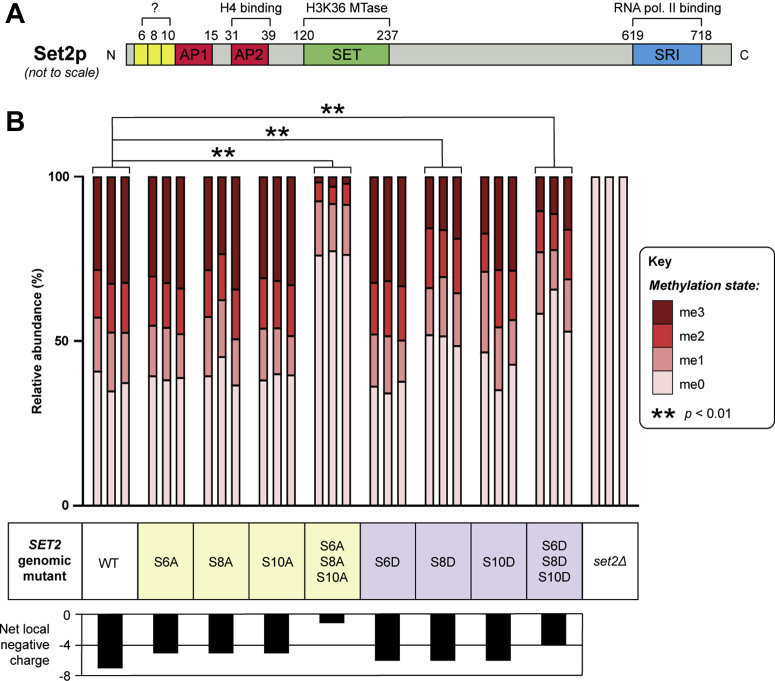
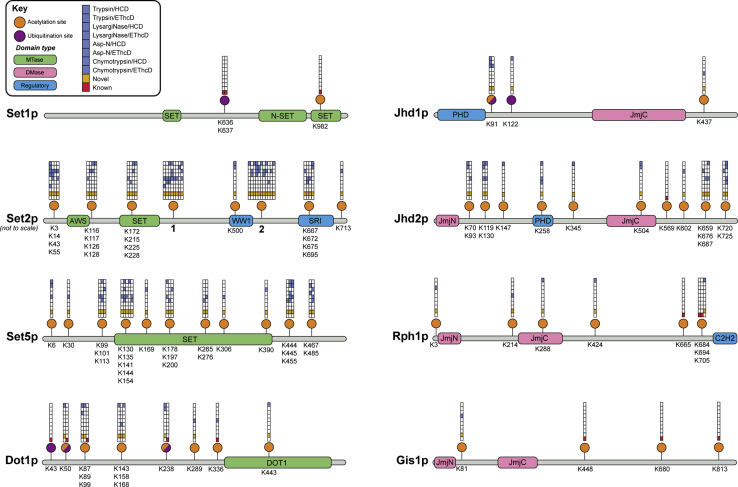
Histone methylation is central to the regulation of eukaryotic transcription. In Saccharomyces cerevisiae, it is controlled by a system of four methyltransferases (Set1p, Set2p, Set5p, and Dot1p) and four demethylases (Jhd1p, Jhd2p, Rph1p, and Gis1p). While the histone targets for these enzymes are well characterized, the connection of the enzymes with the intracellular signaling network and thus their regulation is poorly understood; this also applies to all other eukaryotes. Here we report the detailed characterization of the eight S. cerevisiae enzymes and show that they carry a total of 75 phosphorylation sites, 92 acetylation sites, and two ubiquitination sites. All enzymes are subject to phosphorylation, although demethylases Jhd1p and Jhd2p contained one and five sites respectively, whereas other enzymes carried 14 to 36 sites. Phosphorylation was absent or underrepresented on catalytic and other domains but strongly enriched for regions of disorder on methyltransferases, suggesting a role in the modulation of protein-protein interactions. Through mutagenesis studies, we show that phosphosites within the acidic and disordered N-terminus of Set2p affect H3K36 methylation levels in vivo, illustrating the functional importance of such sites. While most kinases upstream of the yeast histone methylation enzymes remain unknown, we model the possible connections between the cellular signaling network and the histone-based gene regulatory system and propose an integrated regulatory structure. Our results provide a foundation for future, detailed exploration of the role of specific kinases and phosphosites in the regulation of histone methylation.

Keywords: Saccharomyces cerevisiae; chromatin; demethylase; epigenetics; histone methylation; kinase; mass spectrometry; methyltransferase; phosphorylation; post-translational modification.


Conflict of interest statement

Conflict of interest The authors declare that they have no conflicts of interest with the contents of this article.

Figures

Figure 1
Figure 1
Sequence coverage maps of histone MTase and DMase enzymes. Homologously overexpressed and purified yeast histone MTases and DMases were subject to four separate proteolytic digestions (trypsin, LysargiNase, Asp-N, and chymotrypsin) and two mass spectrometric analyses with different fragmentation types (HCD and EThcD), giving eight experiments per enzyme. Residues covered in at least one mass spectrometry experiment are shown as colored bars along the linear protein maps (MTases in green, DMases in pink), while residues not covered are shown in gray. A histogram depicts the number of times each amino acid residue was covered across the eight experiments. The protein sequence coverage obtained for each protease/fragmentation method combination is tabulated per protein and colored according to the color scale (top left).
Figure 2
Figure 2
Phosphorylation sites on yeast histone MTases and DMases. Collation of phosphorylation sites identified in this study and from previous high-throughput phosphoproteomic analyses (Table S2). Phosphosites (yellow) are displayed to scale along linear protein sequence maps comprising MTase (green), DMase (pink), and other regulatory domains (blue). Grids above each phosphorylation site give details about the site’s identification and are arranged according to the key (top left). Phosphorylation sites that have previously been reported in the literature are denoted by a red square, while novel sites identified in this study are shown with a gold square. Blue squares illustrate the identification of phosphosites using different protease/fragmentation method combinations. The uppermost grid square denotes the relative occupancy of phosphorylation at a given residue, shaded in purple according to the color intensity scale (top left). Phosphosite abundance measurements were determined by mass spectrometric label-free quantification of phosphopeptides and their unmodified counterparts (Table S3). Where sites occur proximally to one another, grids are merged, and each column (left to right) corresponds to the phosphorylated residues listed below the protein map (top to bottom).
Figure 3
Figure 3
Histone MTase and DMase enzymes are differentially phosphorylated within predicted regions of order and disorder. DISOPRED3 was used to predict the propensity of local amino acid sequences, within histone MTase (top) and DMase (bottom) enzymes, to adopt an ordered or disordered conformation. Predicted regions of disorder are above the dotted midline and shaded in purple, while predicted ordered sequences are below the midline and shaded in green. Phosphorylated residues are shown as yellow dots along each disorder plot, and their occurrence within ordered and disordered regions is tabulated per protein. Histone MTases are predominantly phosphorylated in disordered regions while DMases tend to be phosphorylated in ordered stretches.
Figure 4
Figure 4
Phosphorylation sites on yeast histone MTase and DMase enzymes, in the context of crystal structures. Structures for four yeast histone MTase and DMase enzymes have been resolved to date. All structures were visualized with PyMOL. A, homotrimeric Dot1p structure (PDB ID: 1U2Z). An individual Dot1p monomer (blue) and its catalytic MTase domain (pink) are shown, while both other subunits are grayed out. Two novel phosphorylation sites identified at serine 176 and threonine 208 (yellow) lie structurally adjacent to the cofactor-binding pocket (green). B, partial Rph1p structure spanning its N-terminal 370 amino acid residues (PDB ID: 3OPW). A known phosphorylation site at serine 139 (yellow) is spatially exposed on the Rph1p structure (cyan) but is not located in its JmjC DMase domain (gold). C, multimeric structure of the yeast COMPASS complex (Set1C, PDB ID: 6BX3). The C-terminal 280 amino acid residues of MTase Set1p (blue) have been resolved. Other constituents of the complex include Bre2p (pink), Sdc1p (light yellow), Spp1p (gray), Swd1p (green), and Swd3p (orange), as well as accessory proteins Shg1p and Swe2p (not shown). Inset, phosphorylation sites on threonine residues 1001 and 1006 (yellow) of Set1p (blue) reside at its interaction interface with Swd1p (green). Negatively charged aspartate and glutamate residues on Swd1p (magenta) may be affected by proximal Set1p phosphorylation.
Figure 5
Figure 5
Conservation of yeast phosphorylation sites on orthologous histone MTase and DMase enzymes.A, pairwise protein sequence alignments were performed between all yeast histone MTase and DMase enzymes and their respective human orthologs, with the exception of Set5p, which is not conserved in mammalian cells. Residues that are phosphorylated in S. cerevisiae and are conserved at the sequence level in human are tabulated. Conservation of phosphorylation at these residues is shown by yellow squares. B, representative portions of multiple sequence alignments for yeast Set1p (top) and Set2p (bottom) with several eukaryotic orthologs. Conservation of chemically similar amino acid residues is as follows: 100% = violet, 80 to 100% = mauve, 60 to 80% = khaki, < 60% = white. Residue numbers for each species are shown above their respective sequences. Instances where a phosphorylated serine or threonine residue on a yeast protein is conserved across all organisms are denoted by a red box and asterisk below the alignment. Sequence alignments were generated in Geneious Prime (version 2020.1.2).
Figure 6
Figure 6
Draft regulatory network of histone methylation in S. cerevisiae showing phosphosites with a known or predicted upstream kinase or phosphatase. Model of the possible connections between the yeast histone methylation system and the intracellular signaling network. Histone MTase (green) and DMase (pink) enzymes and their respective histone targets are shown in the middle/lower panels. Known phosphorylated residues with putative links to upstream kinases (yellow) or phosphatases (purple) are displayed around their cognate histone MTase/DMase enzyme. For ease of visualization, only phosphosites with a known or predicted relationship with an upstream signaling protein are shown. Potential interactions between phosphosites and upstream regulators are shown as edges in the upper/middle panels and colored by evidence type according to the key (bottom right). Motif-based kinase prediction (red) was performed using NetworKIN3.0 (52), while quantitative phosphopeptide data (blue) were collected from Bodenmiller et al. (53) and Holt et al. (54). At the protein level, putative kinase–substrate interactions (green) were from Ptacek et al. (55). Where at least one other line of evidence was available for a connection, genetic relationships (e.g., synthetic suppression, lethality) were obtained from the Yeast Kinase Interaction Database (56) and depicted by a green border around kinase nodes. Instances where a single kinase is predicted to interact with multiple histone methylation enzymes are shown by a red asterisk. While provisional, our network reveals a highly interconnected and integrated regulatory structure for histone methylation in yeast and highlights the diverse signaling pathways that may transmit information to histone MTases and DMases to regulate enzyme function.
Figure 7
Figure 7
Phosphorylation within an N-terminal intrinsically disordered region of MTase Set2p regulates H3K36 methylation levels in vivo.A, schematic of Set2p sequence features. Phosphorylation sites (yellow) lie immediately adjacent to an acidic patch at residues 11 to 15 (AP1; sequence EDEKE). A similar downstream acidic patch at residues 31 to 39 (AP2; sequence DQEPDLTEE) is known to regulate Set2p histone H4-binding affinity and is required for its H3K36 MTase activity (58). For simplicity, the AWS domain shown in Figure 2 has been omitted. B, mutagenesis of Set2p phosphorylation sites affects H3K36 methylation in vivo. Phosphonull (serine-to-alanine; yellow) and phosphomimetic (serine-to-aspartate; lilac) mutations of Set2p phosphorylation sites, either alone or in combination, were engineered into the S. cerevisiae chromosome. For each mutant, the net local negative charge within the N-terminal 15 amino acid residues of Set2p, after considering phosphorylation and charge changes due to mutation, is depicted as a bar chart. H3K36 methylation levels in wild-type (WT) and SET2 genomic mutant yeast strains were quantified by label-free mass spectrometric analysis of a triply-charged, K36-containing tryptic peptide (sequence KSAPSTGGVKKPHR), in its unmodified (m/z = 539.97; me0, triply propionylated), monomethylated (m/z = 544.65; me1, triply propionylated), dimethylated (m/z = 530.64; me2, doubly propionylated), and trimethylated (m/z = 535.31; me3, doubly propionylated) forms (see Fig. S3 for extracted ion chromatograms). The in vivo distribution of H3K36 methylation states across the different mutants is visualized as a stacked bar chart with n = 3 biological replicates. A SET2 deletion strain (set2Δ) was included as a control, confirming ablation of all H3K36 methylation states upon methyltransferase knockout. Statistical comparisons between each mutant and the wild-type control (∗∗p < 0.01 versus WT) were carried out using an ordinal logistic regression model with a proportional odds assumption (see Fig. S4 for details).
Figure 8
Figure 8
Acetylation and ubiquitination sites on yeast histone MTases and DMases. Collation of acetylation and ubiquitination sites identified in this study and from previous high-throughput proteomic analyses (Tables S4 and S5). Acetylation (orange) and ubiquitination (purple) sites are displayed along linear protein sequence maps comprising MTase (green), DMase (pink), and other regulatory domains (blue). Sites that have evidence for both acetylation and ubiquitination are depicted as half orange/half purple circles. Grids above each PTM site give details about the site’s identification and are arranged according to the key (top left). Sites that have been previously reported in the literature are denoted by a red square, while novel sites identified in this study are shown with a gold square. Blue squares illustrate the identification of PTM sites using different protease/fragmentation method combinations. Where sites occur proximally to one another, grids are merged, and each column (left to right) corresponds to the modified residues listed below the protein map (top to bottom). To accommodate the large number of modification sites, Set2p is not illustrated to scale, and residue labels have been removed in instances where more than five grids have been merged (see numbering). These numbered grids correspond to the following residues from left to right: 1 = K329, K340, K412, K428, K433, K447, K450, K459; 2 = K510, K530, K541, K566, K574, K578, K584, K598, K602, K607, K620.

Similar articles

Cited by

References

    1. Black J.C., Van Rechem C., Whetstine J.R. Histone lysine methylation dynamics: establishment, regulation, and biological impact. Mol. Cell. 2012;48:491–507. - PMC - PubMed
    1. Martin C., Zhang Y. The diverse functions of histone lysine methylation. Nat. Rev. Mol. Cell Biol. 2005;6:838–849. - PubMed
    1. Margueron R., Trojer P., Reinberg D. The key to development: interpreting the histone code? Curr. Opin. Genet. Dev. 2005;15:163–176. - PubMed
    1. Shi Y., Whetstine J.R. Dynamic regulation of histone lysine methylation by demethylases. Mol. Cell. 2007;25:1–14. - PubMed
    1. Greer E.L., Shi Y. Histone methylation: a dynamic mark in health, disease and inheritance. Nat. Rev. Genet. 2012;13:343–357. - PMC - PubMed

Publication types

MeSH terms