. 2021 Jan-Jun:296:100200.
doi: 10.1074/jbc.RA120.016127. Epub 2020 Dec 23.

A novel soluble complement receptor 1 fragment with enhanced therapeutic potential

Affiliations

A novel soluble complement receptor 1 fragment with enhanced therapeutic potential

Sandra Wymann et al. J Biol Chem. 2021 Jan-Jun.

Abstract

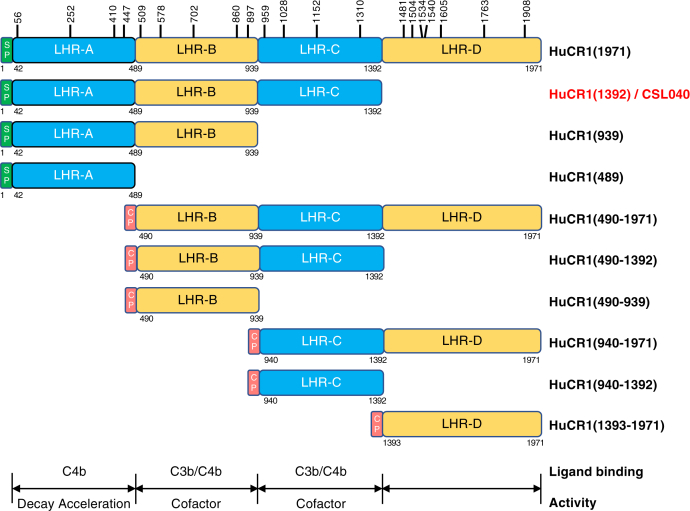
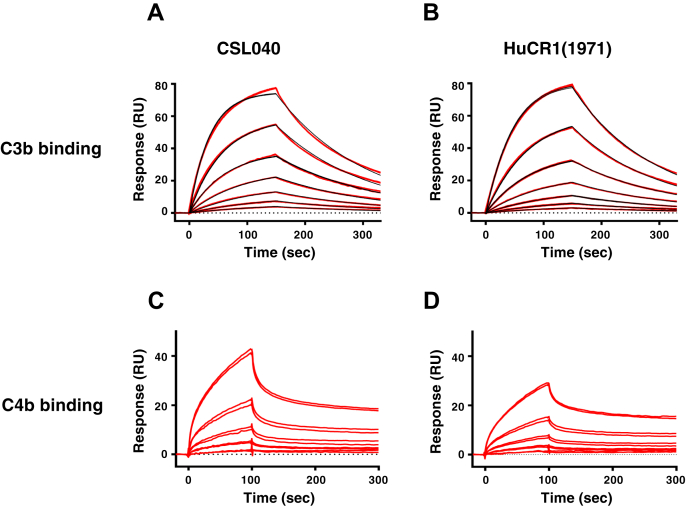
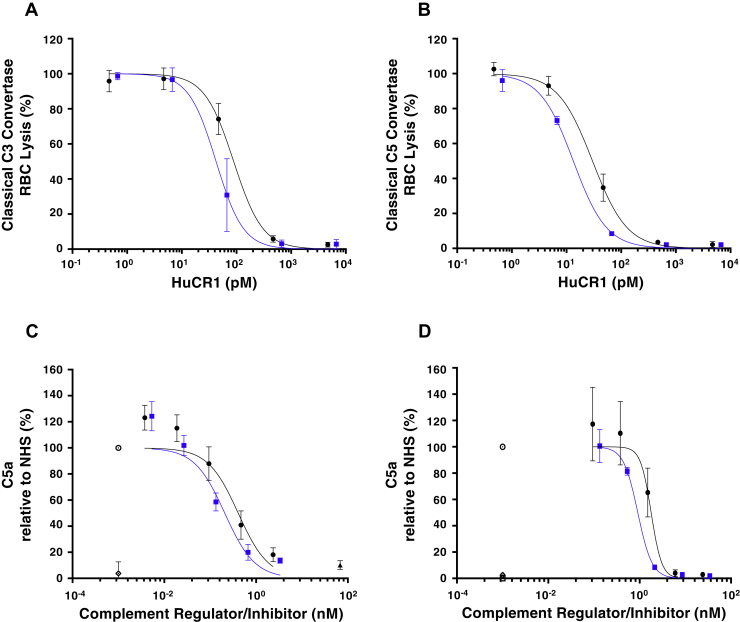
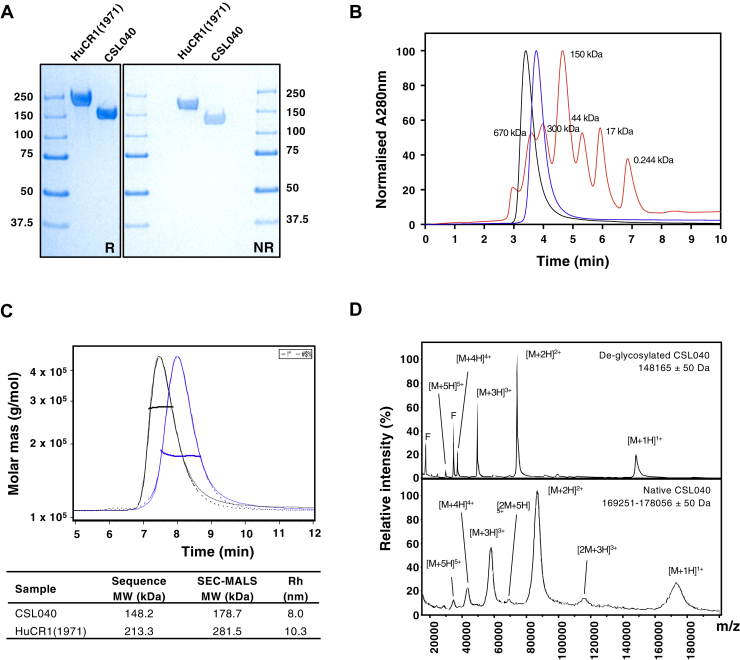
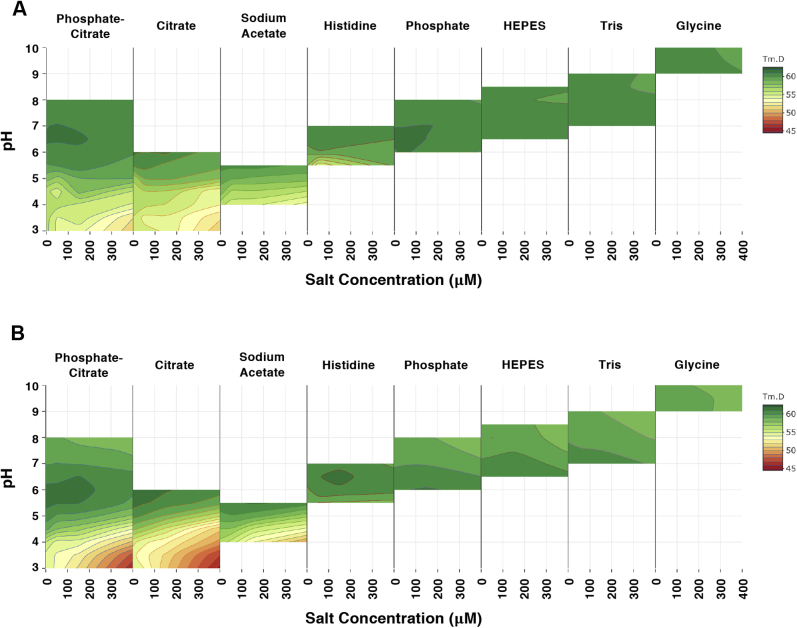
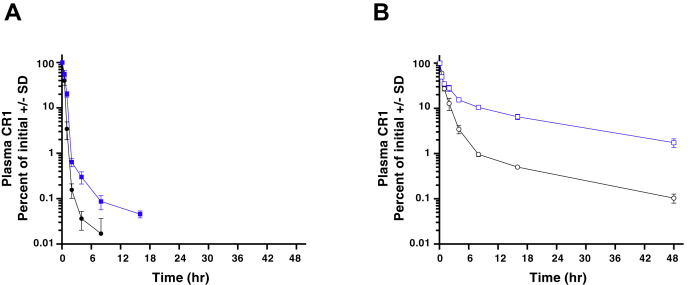
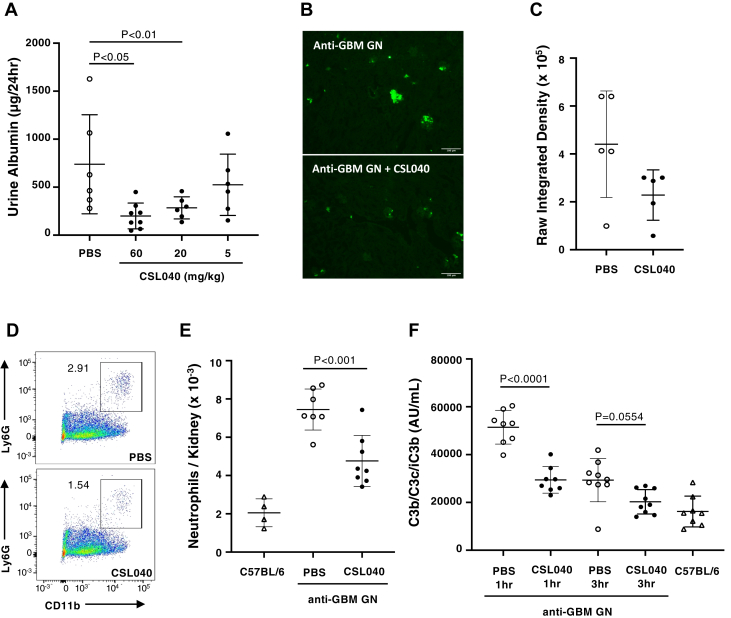
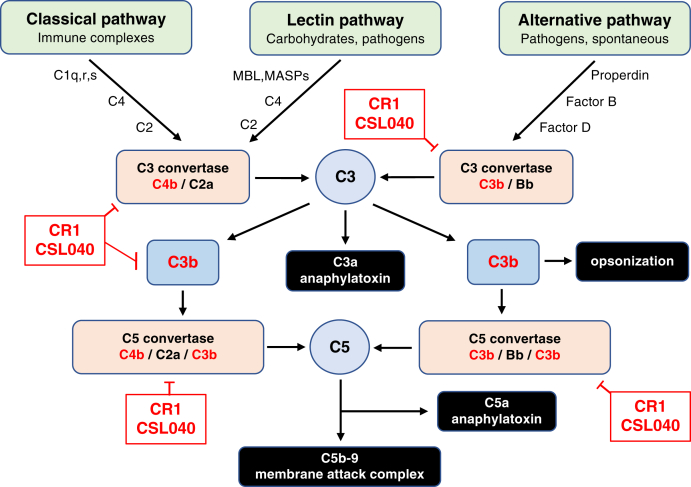
Human complement receptor 1 (HuCR1) is a pivotal regulator of complement activity, acting on all three complement pathways as a membrane-bound receptor of C3b/C4b, C3/C5 convertase decay accelerator, and cofactor for factor I-mediated cleavage of C3b and C4b. In this study, we sought to identify a minimal soluble fragment of HuCR1, which retains the complement regulatory activity of the wildtype protein. To this end, we generated recombinant, soluble, and truncated versions of HuCR1 and compared their ability to inhibit complement activation in vitro using multiple assays. A soluble form of HuCR1, truncated at amino acid 1392 and designated CSL040, was found to be a more potent inhibitor than all other truncation variants tested. CSL040 retained its affinity to both C3b and C4b as well as its cleavage and decay acceleration activity and was found to be stable under a range of buffer conditions. Pharmacokinetic studies in mice demonstrated that the level of sialylation is a major determinant of CSL040 clearance in vivo. CSL040 also showed an improved pharmacokinetic profile compared with the full extracellular domain of HuCR1. The in vivo effects of CSL040 on acute complement-mediated kidney damage were tested in an attenuated passive antiglomerular basement membrane antibody-induced glomerulonephritis model. In this model, CSL040 at 20 and 60 mg/kg significantly attenuated kidney damage at 24 h, with significant reductions in cellular infiltrates and urine albumin, consistent with protection from kidney damage. CSL040 thus represents a potential therapeutic candidate for the treatment of complement-mediated disorders.

Keywords: C3b; CSL040; complement; glomerulonephritis; glycosylation; pharmacokinetics; receptor; recombinant protein expression.


Conflict of interest statement

Conflict of interest S. W., H. C., A. B. M., T. R., and M. P. H. are listed as inventors on International Patent Publication number WO2019/218009. All authors with the exception of A. G. N., G. A. P., G. M.- R., M. M., and M. S. are CSL shareholders.

Figures

Figure 1
Figure 1
Schematic representation of N- and C-terminal soluble recombinant truncation mutants of HuCR1. LHR domain boundaries are based on (27) and from UniProt P17927 (https://www.uniprot.org). The green boxes denoted SP indicate the endogenous signal peptide, and red boxes denoted CP indicate the 19aa signal peptide from ceruloplasmin (GenBank accession number: NP_000087). Vertical bars with numbers above HuCR1(1971) denote the amino acid position of N-glycosylation sites. Amino acid numbering is based on Met + 1. Numbers below each construct indicate the amino acid position of the C-terminal end of the LHR domain boundaries, with the exception being at the N-terminal end of the mature sequence where the numbering denotes the start of the respective domain. Underneath the schematic is shown the known LHR domain(s) within CR1 responsible for both C3b/C4b ligand binding, decay acceleration activity, and cofactor activity, based on (5). HuCR1, human complement receptor 1; LHR, long homologous repeat.
Figure 2
Figure 2
Comparative affinity of CSL040 and CR1(1971) to human C3b and C4b. Biosensor data of plasma-derived human C3b binding to (A) CSL040 and (B) HuCR1(1971). Panels show double-referenced sensorgrams from a series of seven analyte concentrations (15.6, 31.3, 62.5, 125, 250, 500, and 1000 nM), injected for 150 s with dissociation monitored for 180 s. Each red line represents two overlaid sensorgrams. All C3b data were fit to a kinetic 1:1 model (black lines) including a term for mass transport. Calculated kinetic data are shown in Table 2. Biosensor data of plasma-derived human C4b binding to (C) CSL040 and (D) HuCR1(1971). Panels show double-referenced sensorgrams from a series of five analyte concentrations (12.5, 25, 50, 100, and 200 nM) in twofold dilutions, injected for 120 s with dissociation monitored for 180 s. Each double red line represents two overlaid sensorgrams of same concentrations. C4b binding data cannot be fitted to a 1:1 model because of its biphasic binding nature. HuCR1, human complement receptor 1.
Figure 3
Figure 3
In vitro characterization of CSL040 in complement decay acceleration and C5a quantification assays. CSL040 (blue squares) was analyzed in the following in vitro assays: the classical pathway C3 (A) or C5 (B) decay acceleration assay, and in C5a quantification assays following CH50 (C) or ApH50 (D) hemolytic assays. HuCR1(1971) was used as a comparator (black circles). For (C) and (D), results were calculated relative to NHS (open circles), and an anti-C5 mAb (filled triangle, panel C) was used to show reduced C5a formation. Samples without NHS (open squares) and NHS samples containing 20 mM EDTA (open diamonds) served as negative controls. N = 3 for both CSL040 and HuCR1(1971). Statistically significant differences in values between groups were calculated using an unpaired t test. HUCR1, human complement receptor 1; NHS, normal human serum; RBC, red blood cell.
Figure 4
Figure 4
Biophysical characterization of CSL040.A, SDS–PAGE of HuCR1(1971) and CSL040. About 3 μg of each purified protein was electrophoresed under either reducing (R) or nonreducing (NR) conditions alongside molecular weight (MW) standards. Numbers on both sides of the gel refer to the MW sizes of the standards in kilodaltons. B, analytical SEC of HuCR1 variants. The purity of CSL040 (blue) and HuCR1(1971) (black) was analyzed and compared with MW standards (red; sizes indicated in kilodaltons above each peak) with all absorbance at 280 nm being normalized. C, SEC-MALS analyses of CSL040 (blue) and HuCR1(1971) (black). The chromatogram shows the normalized refractive index (RI) signal (solid lines) overlaid with the light scattering (LS) signal (dotted lines). The horizontal lines display the weight-averaged molar mass of the eluted peak. The table below shows the predicted and SEC-MALS–derived MW of each protein in kilodaltons, as well as the hydrodynamic radius (Rh) in nanometers (nm). D, comparison of MALDI-TOF mass spectrometry spectra for PNGase F-treated deglycosylated CSL040 (top panel) and native CSL040 (bottom panel). F denotes the position of the signal corresponding to PNGase F single and doubly charged forms. [M + nH]n+ denotes the molecular mass ion, whereby M is the mass peak observed, H is the proton adduct, and + being the number of charges carried by the ion. Estimated glycosylated mass ranges for CSL040 were based on the full width at half maximum of the triple-charged form. HUCR1, human complement receptor 1.
Figure 5
Figure 5
Comparison of HuCR1 protein thermal stability by differential scanning fluorimetry. A, CSL040. B, HuCR1(1971). Each column represents a different buffer condition. Within each box, a range of pH values (3.0–10.0) are shown on the y-axis and a range of NaCl concentrations (0–500 mM) on the x-axis. For each condition (HuCR1 in a particular buffer, pH, and NaCl concentration), the melting temperature is depicted as a color based on the key, with the contour lines representing a 1 °C change.
Figure 6
Figure 6
Pharmacokinetics of CSL040 in vivo. Wildtype mice were administered 30 mg/kg CSL040 (blue squares) or a molar equivalent 43 mg/kg HuCR1(1971) (black circles) as an i.v. bolus and CR1 concentrations from three serum samples per set time point were measured by a CR1-specific ELISA and plotted as a percentage of the first dose. The recombinant protein used was generated with either high asialo content (filled squares, circles; panel A) or low asialo content (open squares, circles; panel B). See Table 3 for N-glycan content of each test article. CR1, complement receptor 1.
Figure 7
Figure 7
The effect of CSL040 in an attenuated-passive anti-GBM glomerulonephritis mouse model. Glomerulonephritis was induced in C57BL/6 mice by i.v. injection of rabbit anti-GBM polyclonal antibody followed 6 days later by i.p. administration of MsαRb antibody. CSL040 (filled circles) or a PBS control (open circles) was given by i.p. administration 1 h prior to MsαRb. Naive C57BL/6 mice (open triangles) were used as an additional control. Urine was collected using metabolic cages, and mice were sacrificed after 24 h (for albuminuria and complement deposition) or 1 to 24 h (neutrophils staining in kidneys and measurement of plasma complement components). N = 6 to 8 per group. A, urine albumin levels in mice treated with PBS or CSL040 at 5, 20, or 60 mg/kg. B, intraglomerular infiltration of neutrophils 3 h after MsαRb administration was diminished by 60 mg/kg CSL040 as shown by the representative images of immunofluorescence staining of mouse kidneys (magnification 100×; the bar represents 100 μm). C, quantification of raw integrated density. D, infiltrating neutrophils in kidney were quantified by flow cytometry using the Ly6G and CD11b markers. The number next to the gate (outlined with a box) is neutrophils as a percentage of CD45+ cells in the plot of one representative mouse. E, neutrophil numbers from mice in each group were calculated from flow cytometry. F, effect of PBS or CSL040 (60 mg/kg) treatment on the plasma levels of complement activation fragment C3b/C3c/iC3b after induction of glomerulonephritis. Data shown are mean ± SD. Statistically significant differences in values between groups were calculated using ordinary one-way ANOVA with the Tukey's test for multiple comparisons. GBM, glomerular basement membrane; GN, glomerulonephritis.
Figure 8
Figure 8
Involvement of CR1/CSL040 in complement pathway inhibition. The three pathways of the complement systems are the classical, lectin, and alternative pathways, each activated by specific mechanisms. All pathways converge at the level of C3 before diverging to form the key complement end products: the C3a and C5a anaphylatoxins that mediate inflammatory processes; the opsonin C3b; and the lytic membrane attack complex. The activated fragments of C3 and C4, C3b and C4b, are key components in all three complement pathways, and CR1/CSL040 (red boxes) can bind both C3b and C4b, thereby inhibiting further complement activation. One mechanism is via CR1/CSL040 displacement of C2a or Bb in the C3 and C5 convertases (decay acceleration); the other is promotion of factor I-mediated cleavage of C3b/C4b into inactive fragments (cofactor activity). CR1, complement receptor 1.

Similar articles

Cited by

References

    1. Ricklin D., Hajishengallis G., Yang K., Lambris J.D. Complement: a key system for immune surveillance and homeostasis. Nat. Immunol. 2010;11:785–797. - PMC - PubMed
    1. Kolev M., Le Friec G., Kemper C. Complement--tapping into new sites and effector systems. Nat. Rev. Immunol. 2014;14:811–820. - PubMed
    1. Amara U., Rittirsch D., Flierl M., Bruckner U., Klos A., Gebhard F., Lambris J.D., Huber-Lang M. Interaction between the coagulation and complement system. Adv. Exp. Med. Biol. 2008;632:71–79. - PMC - PubMed
    1. Lachmann P.J. The amplification loop of the complement pathways. Adv. Immunol. 2009;104:115–149. - PubMed
    1. Liu D., Niu Z.X. The structure, genetic polymorphisms, expression and biological functions of complement receptor type 1 (CR1/CD35) Immunopharmacol. Immunotoxicol. 2009;31:524–535. - PubMed

Publication types