. 2021 Mar 15;27(6):1792-1806.
doi: 10.1158/1078-0432.CCR-20-2483. Epub 2020 Dec 17.

Attenuation of SRC Kinase Activity Augments PARP Inhibitor-mediated Synthetic Lethality in BRCA2-altered Prostate Tumors

Affiliations

Attenuation of SRC Kinase Activity Augments PARP Inhibitor-mediated Synthetic Lethality in BRCA2-altered Prostate Tumors

Goutam Chakraborty et al. Clin Cancer Res. .

Abstract

Purpose: Alterations in DNA damage repair (DDR) pathway genes occur in 20%-25% of men with metastatic castration-resistant prostate cancer (mCRPC). Although PARP inhibitors (PARPis) have been shown to benefit men with mCRPC harboring DDR defects due to mutations in BRCA1/2 and ATM, additional treatments are necessary because the effects are not durable.

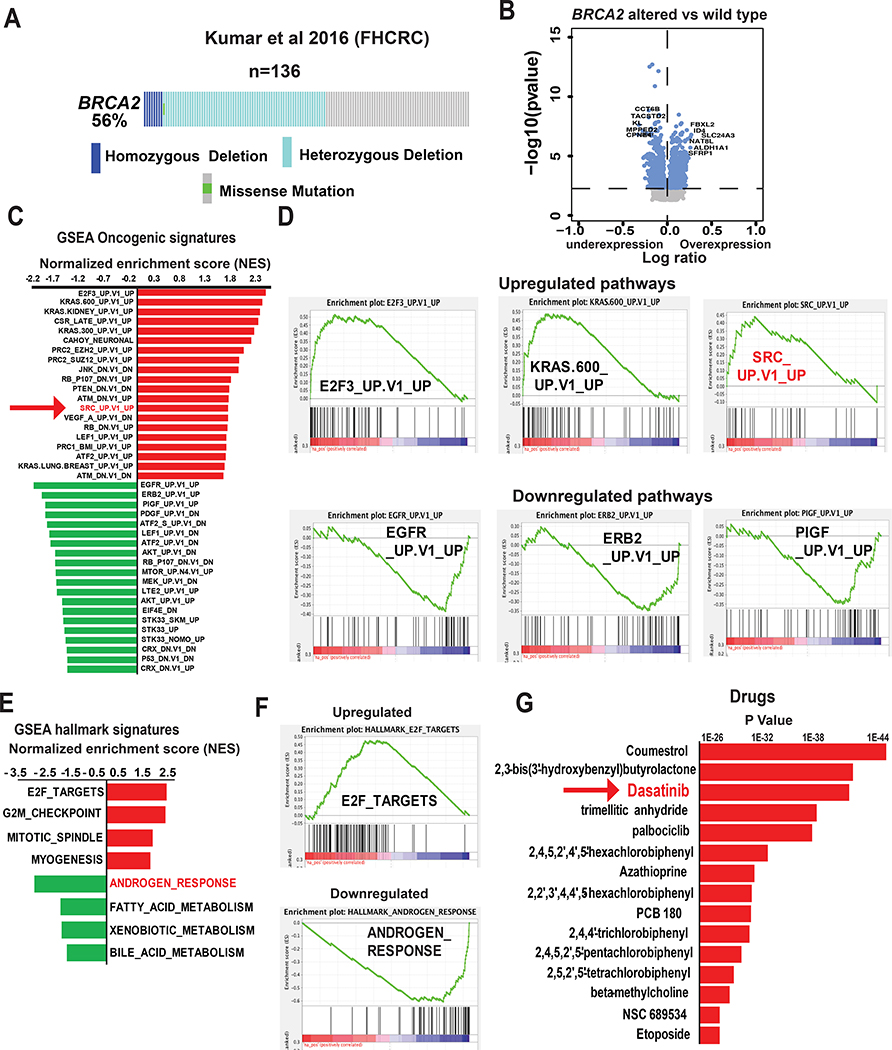
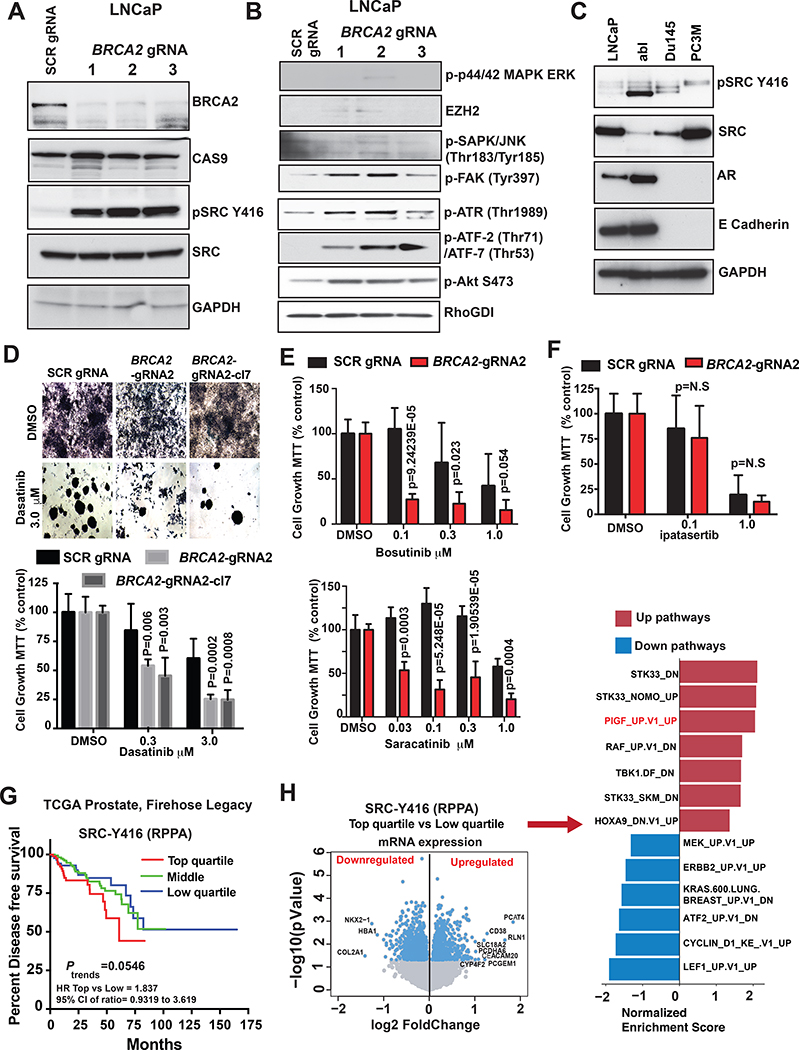
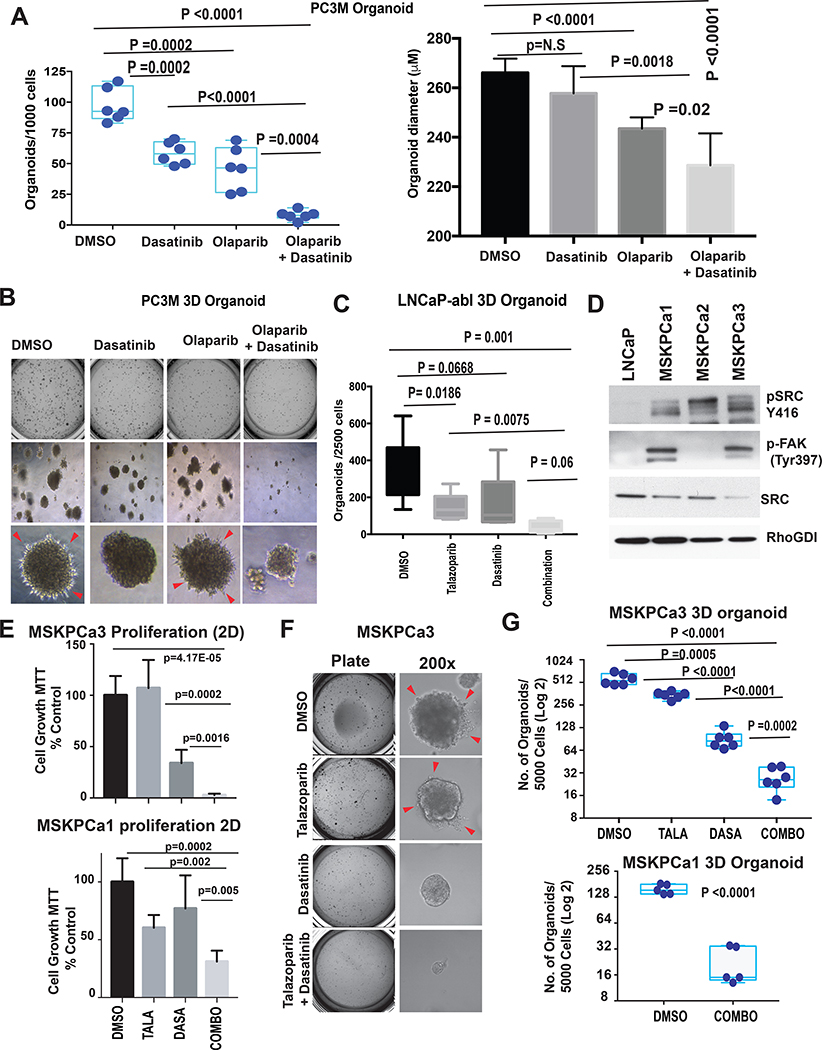
Experimental design: We performed transcriptomic analysis of publicly available mCRPC cases, comparing BRCA2 null with BRCA2 wild-type. We generated BRCA2-null prostate cancer cells using CRISPR/Cas9 and treated these cells with PARPis and SRC inhibitors. We also assessed the antiproliferative effects of combination treatment in 3D prostate cancer organoids.

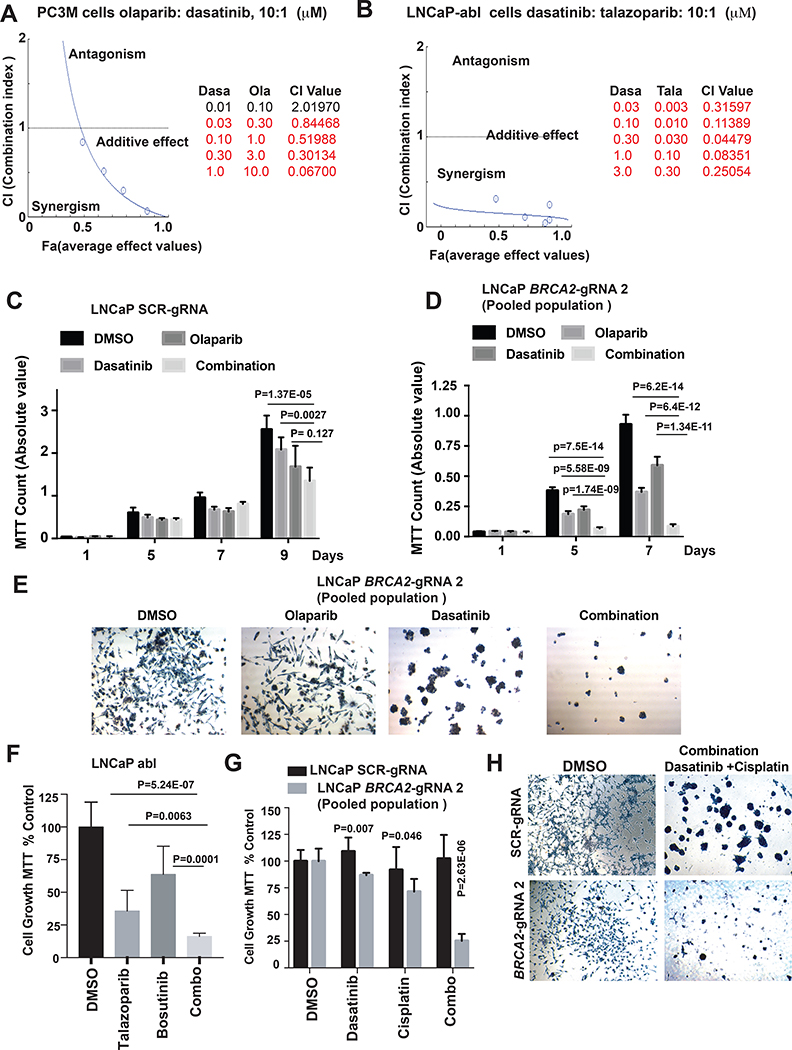
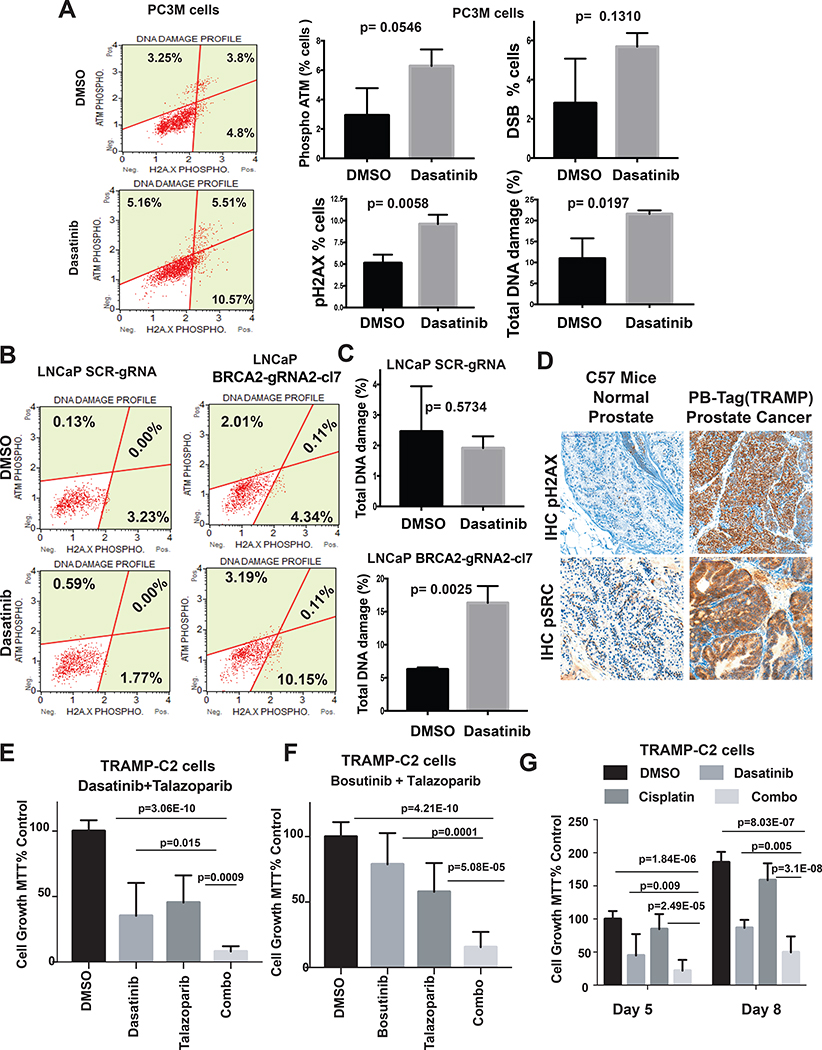
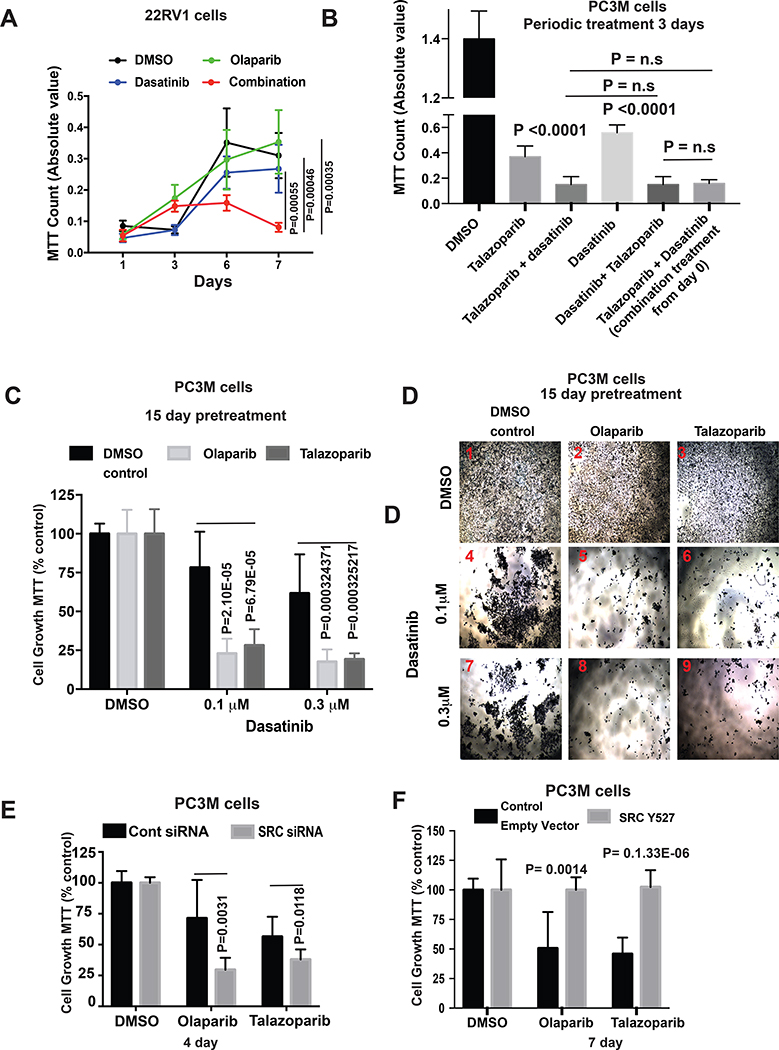
Results: We observed significant enrichment of the SRC signaling pathway in BRCA2-altered mCRPC. BRCA2-null prostate cancer cell lines had increased SRC phosphorylation and higher sensitivity to SRC inhibitors (e.g., dasatinib, bosutinib, and saracatinib) relative to wild-type cells. Combination treatment with PARPis and SRC inhibitors was antiproliferative and had a synergistic effect in BRCA2-null prostate cancer cells, mCRPC organoids, and Trp53/Rb1-null prostate cancer cells. Inhibition of SRC signaling by dasatinib augmented DNA damage in BRCA2-null prostate cancer cells. Moreover, SRC knockdown increased PARPi sensitivity in BRCA2-null prostate cancer cells.

Conclusions: This work suggests that SRC activation may be a potential mechanism of PARPi resistance and that treatment with SRC inhibitors may overcome this resistance. Our preclinical study demonstrates that combining PARPis and SRC inhibitors may be a promising therapeutic strategy for patients with BRCA2-null mCRPC.


Conflict of interest statement

The other authors have no potential conflicts of interest to disclose.

Figures

Figure 1.
Figure 1.. Activation of SRC signaling pathway in BRCA2-deleted prostate cancer
(A) BRCA2 alteration status of samples in the Kumar et al. 2016 metastatic castration-resistant prostate cancer (mCRPC) cohort. Data from patients with complete mutation and copy number alteration (CNA) information were analyzed (134 samples from 54 patients). (B) Volcano plot shows genes that are altered in BRCA2-deleted (homozygous + heterozygous) compared to samples with wild-type BRCA2. (C) The bar graph shows the oncogenic pathways that are altered in BRCA2-deleted (homozygous + heterozygous) mCRPC tumors in Kumar et al. cohort. Pathway analyses were performed using GSEA (c6 oncogenic signature). The 20 most upregulated and downregulated (based on normalized enrichment score [NES]) pathways are shown. (D) Enrichment plots show the represented oncogenic pathways including upregulation of SRC oncogenic signatures (NES = 1.78, P = 0.003, Q = 0.05). (E, F) The bar graph and enrichment plots represent the hallmark signaling pathways that are significantly altered in BRCA2-deleted (homozygous + heterozygous) mCRPC tumors in the Kumar et al. cohort. Pathway analyses were performed using gene set enrichment analysis (GSEA) (Hallmark signature). (G) The bar graph shows the drugs which are significantly associated with the genes that are upregulated in BRCA2-deleted mCRPC described in Fig 1B. The gene-drug association analysis was performed using Toppgene Suite.
Figure 2.
Figure 2.. BRCA2 deletion induces SRC kinase activation and increases sensitivity of prostate cancer cells to dasatinib
(A&B) LNCaP cells were transduced with three different guide RNAs (gRNAs) targeting BRCA2. Cells infected with scrambled (SCR) gRNA were used as control. CAS9, total SRC, GAPDH and RhoGDI served as loading controls. (C) Levels of phosphorylated SRC at tyrosine 416 (pSRC Y416), total SRC, androgen receptor (AR), and E-cadherin were assessed by western blot in prostate cancer cell lines. GAPDH was used as loading control. (D) Cells were treated with 0.3 and 3.0 μM dasatinib for 7 days. The equivalent volume of DMSO was used as placebo treatment. After 7 days cells were treated with 0.5 mg/mL MTT and micrographed in 40x magnification (top). The bar graph shows the changes in cell growth percentage compared to scrambled (SCR) gRNA and DMSO treated samples (bottom). P values were calculated by Student t-test. (E) LNCaP SCR control and BRCA2-gRNA 2 cells were counted and plated in 96-well plates (2500 cells/well in 100 μL media). Cells were treated with Indicated concentration of bosutinib (top) or saracatinib (bottom) for 7 days. The equivalent volume of DMSO was used as a placebo treatment. Cells were treated with 0.5 mg/mL MTT and the graphs represent cell viability (MTT count, % control). P values were calculated by Student t-test. (F) Indicated cells (LNCaP SCR control and BRCA2-gRNA 2) were counted and plated in 96-well plates (2500 cells/well in 100 μL media) and treated with 0.1 and 1.0 μM concentration of ipatasertib for 7 days. The equivalent volume of DMSO was used as a placebo treatment. Cells were treated with 0.5 mg/mL MTT, measured in a plate reader at 570 nM and represented in the form of a bar graph. P values were calculated by Student t-test. (G) Samples from patients in The Cancer Genome Atlas (TCGA) Firehose Legacy cohort were divided into 4 quartiles based on levels of phospho-SRC at Y416, reverse-phase protein arrays (RPPA). Kaplan-Meier curves were used to compare disease-free survival. Log-rank test was performed to examine significance. (H) Volcano plot shows genes that are altered in phospho-SRC Y416 high (upper quartile RPPA value) cases compared to samples with phospho-SRC Y416 low (lower quartile RPPA value). The bar graph to the right of the volcano plot shows the oncogenic pathways that are altered in phospho-SRC Y416 high vs low localized PC tumors of The Cancer Genome Atlas (TCGA) Firehose Legacy cohort. Pathway analyses were performed using GSEA (c6 oncogenic signature). The altered (based on normalized enrichment score [NES]) pathways are shown.
Figure 3.
Figure 3.. Synergistic effect of dasatinib and PARPi on BRCA2-null prostate cancer cell viability
(A,B) PC3M and LNCaP-abl cells were treated with indicated drugs alone or in combination for 4 days. Drug synergy was calculated using Chou-Talay Method/Compusyn. Left, graphs show the combination index (CI) plot for dasatinib with olaparib/talazoparib combination obtained from Compusyn. Right, tables show dose-dependent CI and average effect (Fa) values. (C,D) LNCaP SCR controls and BRCA2-gRNA 2 cells were counted and plated in 96-well plates (2500 cells/well in 100 μL media). Cells were treated with dasatinib (0.3 μM) and olaparib (3 μM) alone or in combination. The equivalent volume of DMSO was used as a placebo treatment. After indicated days, cells were treated with 0.5 mg/mL MTT. The graphs represent the inhibition of cell viability by combination treatment. P values were calculated by Student t-test. (E) MTT-treated LNCaP-BRCA2-gRNA 2 cells from D were photographed at 40X magnification. Representative images are shown. (F) LNCaP abl cells were counted and plated in 96-well plates (2500 cells/well in 100 μL media). Cells were treated with bosutinib (0.3 μM) and talazoparib (0.03 μM) alone or in combination. The equivalent volume of DMSO was used as a placebo treatment. After 7 days, cells were treated with 0.5 mg/mL MTT, measured in a plate reader at 570 nM, and represented as a bar graph. (G) LNCaP SCR controls and BRCA2-gRNA 2 cells were counted and plated in 96-well plates (2500 cells/well in 100 μL media). Cells were treated with dasatinib (0.3 μM) and cisplatin (0.1 μM; dissolved in DMSF) alone or in combination. The equivalent volume of DMSO was used as a placebo treatment. After the indicated number of days, cells were treated with 0.5 mg/mL MTT. The graph represents the inhibition of cell viability by single and combination treatment. P values were calculated by Student t-test. (H) MTT-treated cells from G (DMSO and combination treatment) were photographed at 40X magnification. Representative images are shown.
Figure 4.
Figure 4.. Dasatinib induces DNA damage in BRCA2 null prostate cancer cells
(A) PC3M cells treated with dasatinib (0.3 μM) for 24 hours. The equivalent volume of DMSO was used as a placebo treatment. Left, dot plots show the percentage of cells with phospho-ATM, phospho-H2A.X, and both phospho-ATM and phospho-H2A.X. Right, bar graphs compare the percentages of cells between DMSO- and dasatinib-treated conditions (± SD). DSB (double-strand break) represents the percentage of cells with dual activation of ATM and H2A.X. Total DNA damage represents the percentage of cells with either activated ATM, activated H2A.X, or dual activation. P values were calculated by Student t-test. (B &C) LNCaP SCR-gRNA and BRCA2-gRNA2 cl7 cells were treated with dasatinib (0.3 μM) for 24 hours. The equivalent volume of DMSO was used as a placebo treatment. Left, dot plots show the percentage of cells with phospho-ATM, phospho-H2A.X, and both phospho-ATM and phospho-H2A.X. Right, total DNA damage represents the percentage of cells with either activated ATM, activated H2A.X, or dual activation. P values were calculated by Student t-test. (D) Representative immunohistochemistry (IHC) images of paraffin-embedded sections of normal prostate from wild-type C57BL/6J mice and localized prostate tumors from PB-Tag mice. Sections were stained immunohistochemically with indicated antibodies (Brown). Nuclei were co-stained with hematoxylin (blue). The micrographs were captured in 200x magnification. Note that prostate tumors of PB-Tag mice exhibit higher DNA damage (increased phosphorylation of γH2AX) and Src activation (Src y416 phosphorylation) compared to normal mice prostate. (E &F) TRAMP-C2 cells (2500 cells/well in 100 μL media) were treated with dasatinib/bosutinib (0.3 μM) and talazoparib (0.03 μM) alone or in combination for 7 days. DMSO was used as a placebo treatment. Cell viability (± SD) was measured by MTT assay. (G) TRAMP-C2 cells were treated with dasatinib (0.3 μM) and cisplatin (0.1 μM; dissolved in DMSF) alone or in combination for 5 and 8 days. The equivalent volume of DMSO was used as a placebo treatment. After indicated number of days, cells were treated with 0.5 mg/mL MTT. The graphs represent the inhibition of cell viability by single and combination treatment. P values were calculated by Student t-test.
Figure 5.
Figure 5.. SRC activation leads to PARPi resistance
A) Viability (± SD) of 22RV1 cells treated with dasatinib (0.3 μM) ± olaparib (3.0 μM) as assessed by MTT assay. DMSO was used as a placebo control. (B) Viability (± SD) of PC3M cells subject to periodic treatment with talazoparib followed by dasatinib or vice versa, as assessed by MTT assay. DMSO was used as a placebo control. See Supplementary Fig. S5A for experimental schematic. P values were calculated by Student t-test. (C&D) PC3M cells were incubated in either olaparib (3.0 μM) or talazoparib (0.03 μM) supplemented media for 15 days to develop partial PARPi resistance. PARPi-resistant cells were counted and treated with dasatinib (see Supplementary Fig. S5B for experimental schematic). Cell viability was assessed by MTT assay. Viability (± SD) of PC3M cells after 7 days of dasatinib treatment is shown in C. Representative images of MTT-treated cells are shown in D. P values were calculated by Student t-test. (E) SRC or scrambled SMARTpool siRNA-transfected PC3M cells were cultured in olaparib (3.0 μM) or talazoparib (0.03 μM) supplemented medium for 4 days post-transfection. The equivalent volume of DMSO was used as a placebo treatment. Cell viability (± SD) was measured by MTT assay. P values determined by Student’s t-test. (F) PC3M cells that transiently overexpressed Y527F SRC (constitutively active SRC) were treated with olaparib (3.0 μM) or talazoparib (0.03 μM) for 7 days. Control cells were transfected with GFP expressing empty vector. Viability (± SD) of cells at 7 days as determined by MTT assay is shown. P values determined by Student’s t-test.
Figure 6.
Figure 6.. Synergistic effect of dasatinib and PARPi on 3D prostate cancer organoid growth
(A) PC3M cells (103 cells/well) were mixed with Matrigel, and 3D cell cultures (organoids) were grown in growth factor–enriched media. (See Supplementary Fig. S6A for schematic representation.) The number of 3D organoids (>200 μM diameter, ± SD) is shown. Each point represents the number of organoids (A) and average diameter of PC3M 3D organoids in (B) grown from 103 cells in each well. P value determined by Student’s t-test. (B) Top, images of wells plate at Day 21. Middle, organoids at 40X magnification. Bottom, organoids at 100X magnification. Cells invading through Matrigel are indicated by arrows. (C) Average number of 3D organoids (> 100 μM diameter, ± SD) derived from LNCaP-abl cells (plated at 5×10³ cells/well). P value determined by Student’s t-test. (D) Activation of SRC-FAK pathway in mCRPC-derived organoids (MSKPCa1–3) were analyzed by western blot using indicated antibodies. Lysate from parental LNCaP cells was used as cell line control. RhoGDI was used as loading control (E) Organoids (MSKPCa1 [bottom] and MSKPCa 3 [top]) were counted and plated to collagen-coated (Collagen I 50 μg/ml) 96-well plates (5000 cells/well in 100 μL media) and treated with dasatinib (0.3 μM) and talazoparib (0.03 μM) alone or in combination. The equivalent volume of DMSO was used as a placebo treatment. After 10 days, cells were treated with 0.5 mg/mL MTT. The graphs represent the inhibition of cell viability by single and combination treatment. P values were calculated by Student t-test. (F) MSKPCa3 cells (5× 10³ cells/well) were mixed with Matrigel, and 3D cell cultures (organoids) were grown in growth factor–enriched media and treated with dasatinib (0.3 μM) and talazoparib (0.03 μM) alone or in combination. Left, images of MSKPCa3 cell-derived 3D organoid in 24-well plate at Day 21. Right, organoids at 200X magnification. Cells invading through Matrigel are indicated by arrows. (G) The number of 3D organoids (>150 μM diameter, ± SD) derived from MSKPCa3 (top) and MSKPCa1 (bottom) are shown. Each point represents the number of organoids grown from 5×10³ cells in each well of 24-well plate (after 4 weeks of plating the cells). P value determined by Student’s t-test.

Similar articles

Cited by

References

    1. Dong L, Zieren RC, Xue W, de Reijke TM, Pienta KJ. Metastatic prostate cancer remains incurable, why? Asian J Urol 2019;6(1):26–41. doi 10.1016/j.ajur.2018.11.005. - DOI - PMC - PubMed
    1. Robinson D, Van Allen EM, Wu YM, Schultz N, Lonigro RJ, Mosquera JM, et al. Integrative clinical genomics of advanced prostate cancer. Cell 2015;161(5):1215–28. doi 10.1016/j.cell.2015.05.001. - DOI - PMC - PubMed
    1. Abida W, Cyrta J, Heller G, Prandi D, Armenia J, Coleman I, et al. Genomic correlates of clinical outcome in advanced prostate cancer. Proc Natl Acad Sci U S A 2019;116(23):11428–36. doi 10.1073/pnas.1902651116. - DOI - PMC - PubMed
    1. Jeggo PA, Pearl LH, Carr AM. DNA repair, genome stability and cancer: a historical perspective. Nat Rev Cancer 2016;16(1):35–42. doi 10.1038/nrc.2015.4. - DOI - PubMed
    1. Armenia J, Wankowicz SAM, Liu D, Gao J, Kundra R, Reznik E, et al. The long tail of oncogenic drivers in prostate cancer. Nat Genet 2018;50(5):645–51. doi 10.1038/s41588-018-0078-z. - DOI - PMC - PubMed

Publication types

MeSH terms