. 2020 Dec 18;370(6523):eabd5059.
doi: 10.1126/science.abd5059.

Cerebellar nuclei evolved by repeatedly duplicating a conserved cell-type set

Affiliations

Cerebellar nuclei evolved by repeatedly duplicating a conserved cell-type set

Justus M Kebschull et al. Science. .

Abstract

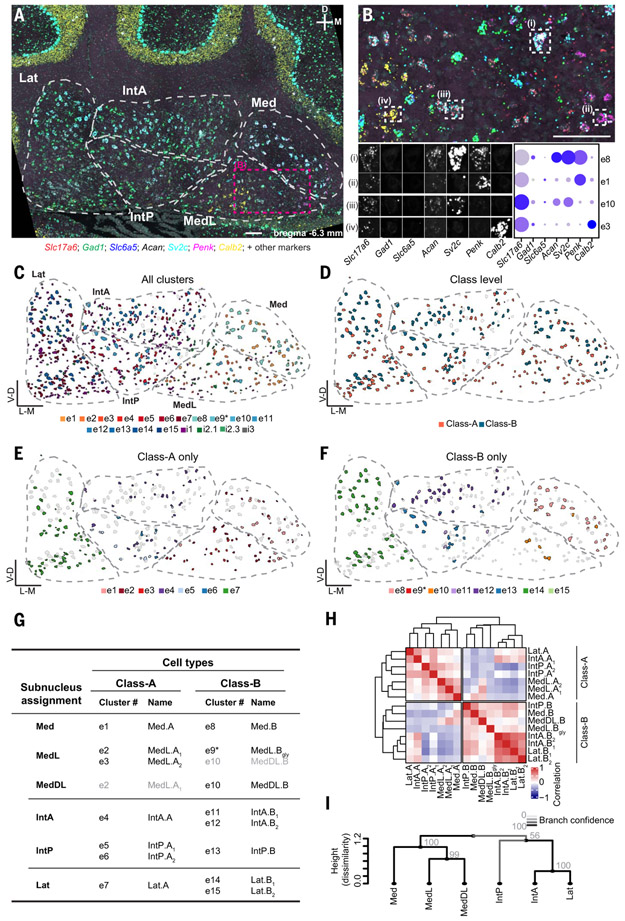
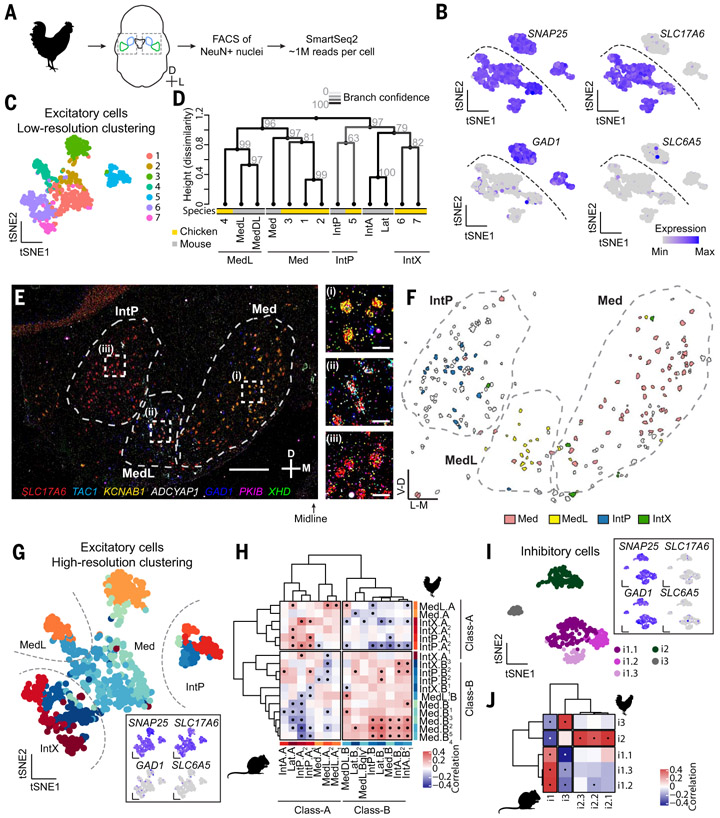
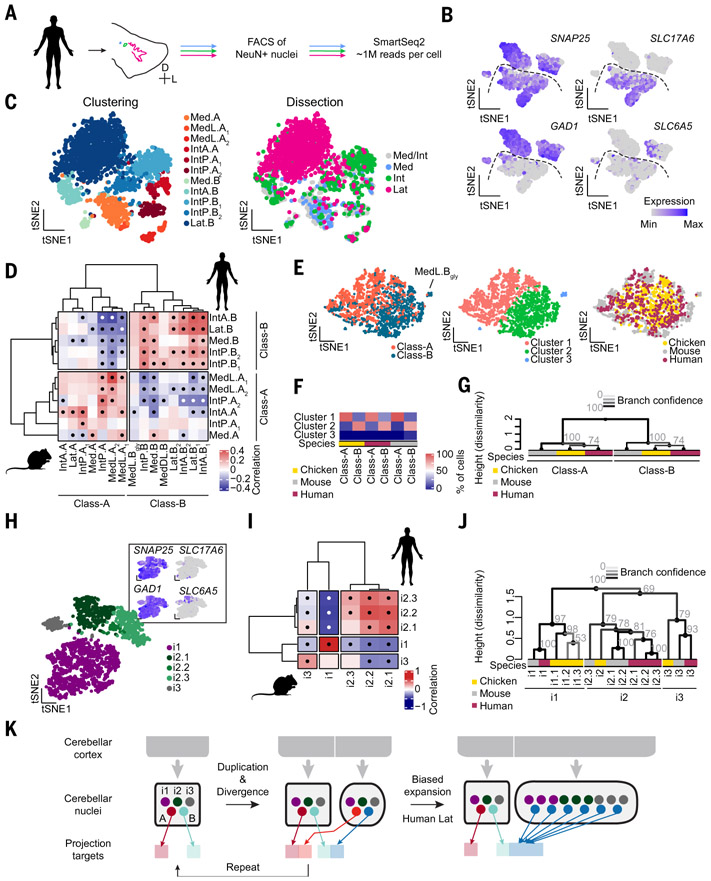
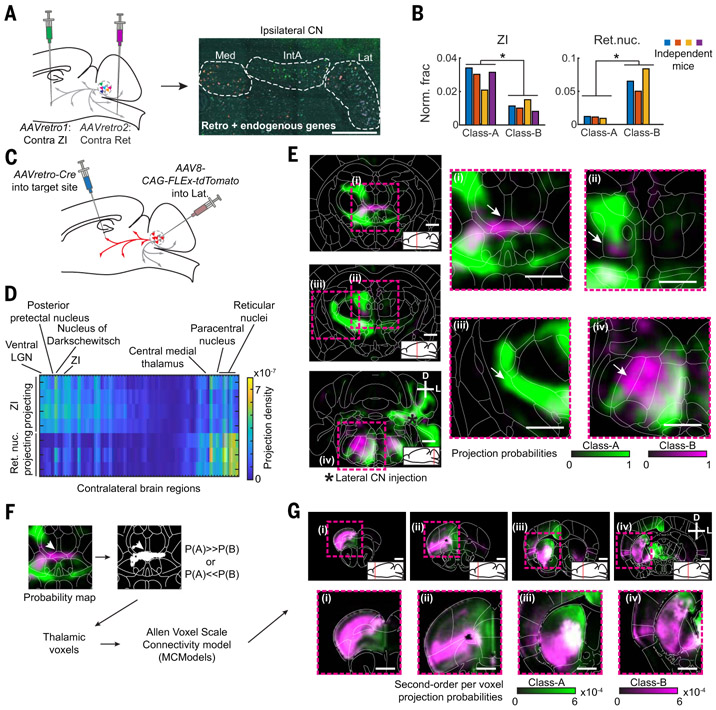
How have complex brains evolved from simple circuits? Here we investigated brain region evolution at cell-type resolution in the cerebellar nuclei, the output structures of the cerebellum. Using single-nucleus RNA sequencing in mice, chickens, and humans, as well as STARmap spatial transcriptomic analysis and whole-central nervous system projection tracing, we identified a conserved cell-type set containing two region-specific excitatory neuron classes and three region-invariant inhibitory neuron classes. This set constitutes an archetypal cerebellar nucleus that was repeatedly duplicated to form new regions. The excitatory cell class that preferentially funnels information to lateral frontal cortices in mice becomes predominant in the massively expanded human lateral nucleus. Our data suggest a model of brain region evolution by duplication and divergence of entire cell-type sets.


Figures

Fig. 1.
Fig. 1.. Brain-wide projections of mouse cerebellar nuclei (CN).
(A) Schematic of the cerebellar circuit. Information enters the cerebellar cortex through mossy fibers (MF) and climbing fibers (CF). Purkinje cells (PC) send cerebellar cortex output to the CN, which project to many brain regions. PN, pontine nuclei; Thal, thalamus; VN, vestibular nuclei; RN, red nucleus; SC, superior colliculus; IO, inferior olive; GC, granule cells. (B) Vertebrate cladogram, annotated with the number of CN pairs. (C) Schematic of the medial, interposed, and lateral CN in mice. (D) Schematic of experimental workflow. Anterograde tracers were injected into individual nuclei. Brains were cleared and imaged, and images were registered, showing a dorsal view of a representative brain volume with axons in red. Asterisk (*), tracer injection site. Dashed line denotes the midline. (E) Heat maps showing the mean projection strengths to the top innervated brain regions of each injection site. For abbreviations, see table S5. (F) Dendrogram showing hierarchical clustering of axon projections from 23 brains with indicated injection sites. Medial CN is most distinct from the other CN. Line color and gray numbers indicate bootstrapping-based branch confidence. Values >40 indicate good support. (G) Coronal heat maps of axonal innervation from the three mouse CN, with Allen compartments in background. Heat maps were derived from N = 5, 5, 6, and 7 anterior medial, posterior medial, interposed, and lateral CN injections, respectively. Asterisk (*), average tracer injection sites. Arrowheads and insets show shifted projections in contralateral thalamus [G(i)], ipsilateral brainstem [G(ii)], and cerebellar cortex [(G), middle panel]. (H) Sagittal heat map, showing shifted projection patterns in the contralateral superior colliculus. Scale bar: main panel, 1 mm; inset, 500 μm. In this and all subsequent figures: A, anterior; P, posterior; D, dorsal; V, ventral; M, medial; L, lateral.
Fig. 2.
Fig. 2.. Mouse cerebellar nuclei cell types.
(A) Workflow of snRNAseq. The three regions were dissected separately, and cell nuclei were liberated, sorted for NeuN expression, and sequenced. (B) Marker expression for all neurons. Dashed line divides rhombic lip (RL)– and ventricular zone (VZ)-derived cells. N = 6 rounds of FACS using nine mice each. (C) Representative image of permanently labeled RL-derived cells probed for endogenous marker expression. Arrow, excitatory neuron; arrowhead, inhibitory neuron. Asterisk (*) in (B) and (C) labels Slc6a5+ RL-derived cluster e9*. Scale bar, 50 μm. N = 2 sections. (D and E) Clustering results for VZ- and RL-derived cells, labeled by clustering result (top) and CN dissection (middle), with marker expression at the bottom. Dissection labels are imperfect owing to close apposition of individual cerebellar nuclei in space. (F) Marker expression for all cell types. (G) Hierarchical clustering of excitatory cell types in the space of differentially expressed genes, using a correlation-based distance metric. Line color and gray numbers indicate bootstrapping-based branch confidence as in Fig. 1F. Class-A and Class-B neurons are color-coded with red and blue hues, respectively, in this and subsequent figures.
Fig. 3.
Fig. 3.. Spatial organization of mouse cell types.
(A) A STARmap coronal section of the cerebellar nuclei, showing seven markers for illustration; representative of two animals, each including two hemispheres of three to six coronal sections spanning the anterior–posterior axis of the cerebellar nuclei. Cytoarchitectonic subnuclei boundaries are indicated. Scale bar, 100 μm. (B) Enlargement of the area marked in (A). Scale bar, 100 μm. Four excitatory cells are marked and decomposed into the seven illustrated STARmap channels. Comparison to snRNAseq data (dot plot) yields the classification of the cells into transcriptomic cell types. (C to F) Classification results of the same section shown in (A). All excitatory and inhibitory neurons are colored by their assigned transcriptomic cell type in Fig. 2C; excitatory neurons only colored by class (D); Class-A–only (E) and Class-B–only (F) excitatory neurons colored by their transcriptomic cluster showing subnuclei specificity. Unassigned neurons are in gray. (G) Summary of STARmap results for all excitatory cell types, noting the location of each cell type and new cell type names. Gray entries signify minor contributions to the indicated subnuclei. (H) Correlation matrix of all excitatory cell types annotated by subnuclei location. IntA correlates well with Lat in both Class-A and Class-B, whereas IntP is more similar to medial nucleus cell types. (I) Hierarchical clustering of subnuclei. Line color and numbers indicate bootstrapping-based branch confidence.
Fig. 4.
Fig. 4.. Cerebellar nuclei cell types in the chicken.
(A) Workflow for chicken snRNAseq. The entire cerebellar nuclei were dissected together from frozen tissue. (B) Marker expression in all neurons. Dashed line divides excitatory and inhibitory neurons. N = 3 chickens. (C) Coarse clustering result of all excitatory neurons. (D) Dendrogram showing hierarchical clustering of coarse excitatory chicken clusters and mouse excitatory neurons averaged by subnuclei. Line color and gray numbers indicate bootstrapping-based branch confidence. (E) A STARmap coronal section of the chicken cerebellar nuclei, representative of N = 7 sections from three animals. Scale bar: main panel, 500 μm; inset, 50 μm. (F) Classification results of the excitatory cells shown in (E) into subnuclei inferred in (D). The subnuclei form spatially distinct structures. Unassigned neurons are in gray. (G) High-resolution clustering results of chicken excitatory neurons. Inset shows marker expression. (H) Correlation matrix between mouse and chicken excitatory cell types. A division of chicken excitatory neuron types into Class-A and Class-B is apparent. Dots indicate significant correlations. (I) Clustering results of inhibitory neurons. Inset shows marker expression. (J) Correlation matrix between mouse and chicken inhibitory neurons. Dots indicate significant correlations.
Fig. 5.
Fig. 5.. Class-B neurons expanded in human lateral nucleus.
(A) Workflow for human snRNAseq. The three cerebellar nuclei are separately dissected from frozen tissue. (B) Marker expression for all neurons. N = 3 donors. Dashed line divides excitatory and inhibitory neurons. (C) Clustering results of human excitatory neurons, colored by cluster assignment and dissection. Dissection labels are imperfect, owing to close apposition of individual cerebellar nuclei. Med/Int indicates a mixed dissection. (D) Correlation matrix of mouse and human excitatory cell types. Medial and interposed nuclei contain cell types that correlate with both mouse Class-A and Class-B cell types. Lateral nucleus neurons only correlate with Class-B neurons. Dots indicate significant correlations. (E) Seurat integration of excitatory neurons from three species, colored by class (left), clustering results in integrated space (middle), and species (right). (F) Quantification of membership to the integrated clusters of Class-A and Class-B cells. Across species, Class-A and Class-B cells fall into the same clusters. (G) Hierarchical clustering of excitatory neurons averaged by class, showing conservation of excitatory cell classes across amniotes. Grayscales of line and numbers indicate bootstrapping-based branch confidence. (H) Clustering results of human inhibitory neurons. Cells are colored by cluster assignment. Marker expression is indicated in the inset. (I) Correlation matrix of mouse and human inhibitory neurons, showing one-to-one correspondences. Dots indicate significant correlations. (J) Hierarchical clustering of inhibitory cell types across all three species (color coded), showing conservation of three inhibitory classes across amniotes. Grayscales of line and numbers as above. (K) Schematic illustrating the proposed model of subnucleus duplication-and-divergence (left) and biased expansion of Class-B excitatory neurons in human lateral nucleus (right).
Fig. 6.
Fig. 6.. Differential projections of lateral nucleus Class-A and Class-B neurons in mice.
(A) Schematic of retrograde tracing and STARmap identification of Class-A and Class-B neurons in the lateral nucleus. Contralateral zona incerta (ZI) and contralateral parvocellular reticular nucleus were injected with different AAVretro tracers. Gene expression was then measured by STARmap in the ipsilateral lateral nucleus. Scale bar, 500 μm. (B) Quantification of retrograde tracing results across N = 3 or 4 independent mice in the lateral nucleus at class resolution. *p < 0.05, paired t test without corrections for multiple comparisons. (C) Schematic of collateralization mapping experiments. (D) Heat map showing all differentially innervated contralateral regions (p < 0.05, no multiple comparison correction) from Ret-projecting (N = 3) and ZI-projecting (N = 4) lateral nucleus cells. Brain regions are sorted by mean innervation difference. (E) Probability maps of Class-A and Class-B projection patterns as computed from ZI and Ret collateralization patterns. Regions of differential intralaminar thalamus innervation ((i) and (ii)) and of the AAVretro-Cre injection sites ((iii) and (iv)) by Class-A and Class-B neurons are highlighted. Scale bar, 1 mm. (F) Workflow for in silico tracing of second-order projections from preferentially Class-A– or Class-B-innervated thalamic voxels. Starting voxels are identified and fed into a brain-wide voxel scale connectivity model (33). (G) Coronal sections showing brain-wide normalized projection probabilities from thalamic voxels preferentially innervated by Class-A (green) or Class-B (magenta). Scale bar, 1 mm.

Comment in

References

    1. Arendt D et al., The origin and evolution of cell types. Nat Rev. Genet 17, 744–757 (2016). doi: 10.1038/nrg.2016.127; pmid: 27818507 - DOI - PubMed
    1. Tosches MA, Developmental and genetic mechanisms of neural circuit evolution. Dev. Biol 431, 16–25 (2017). doi: 10.1016/j.ydbio.2017.06.016; pmid: 28645748 - DOI - PubMed
    1. Chakraborty M, Jarvis ED, Brain evolution by brain pathway duplication. Philos. Trans. R. Soc. Lond. B Biol. Sci 370, 20150056 (2015). doi: 10.1098/rstb.2015.0056; pmid: 26554045 - DOI - PMC - PubMed
    1. Grillner S, Robertson B, The Basal Ganglia Over 500 Million Years. Curr. Biol 26, R1088–R1100 (2016). doi: 10.1016/j.cub.2016.06.041; pmid: 27780050 - DOI - PubMed
    1. Frangeul L et al., A cross-modal genetic framework for the development and plasticity of sensory pathways. Nature 538, 96–98 (2016). doi: 10.1038/nature19770; pmid: 27669022 - DOI - PubMed

Publication types