. 2020 Dec 17;11(1):6410.
doi: 10.1038/s41467-020-19917-0.

Single cell analysis reveals distinct immune landscapes in transplant and primary sarcomas that determine response or resistance to immunotherapy

Affiliations

Single cell analysis reveals distinct immune landscapes in transplant and primary sarcomas that determine response or resistance to immunotherapy

Amy J Wisdom et al. Nat Commun. .

Abstract

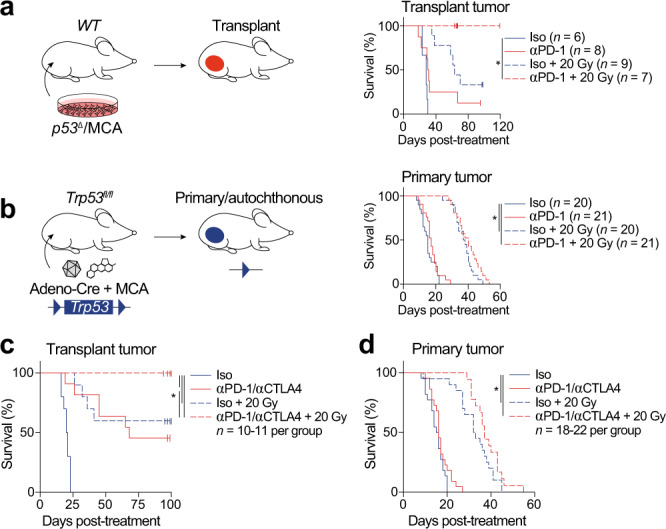
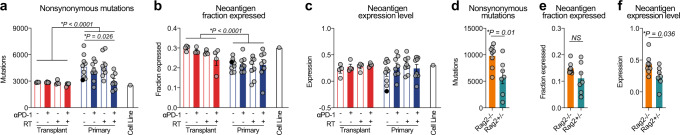
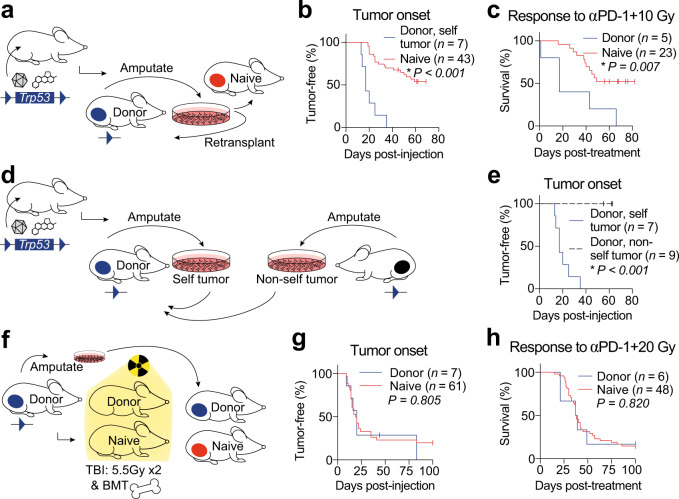
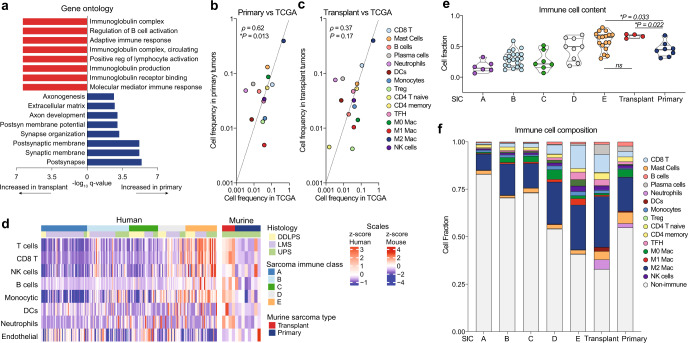
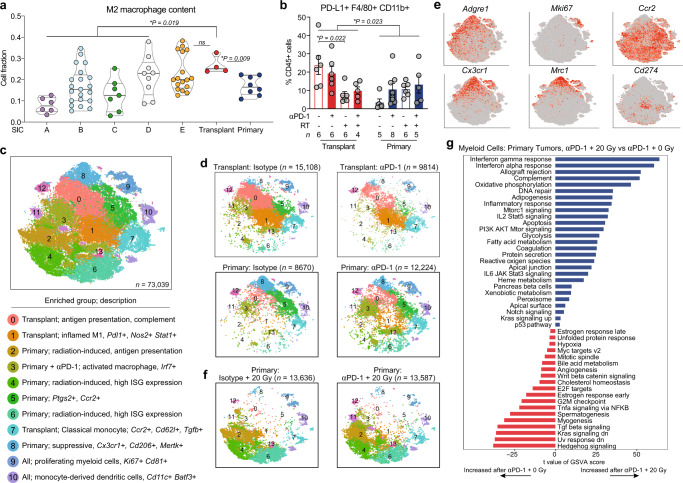
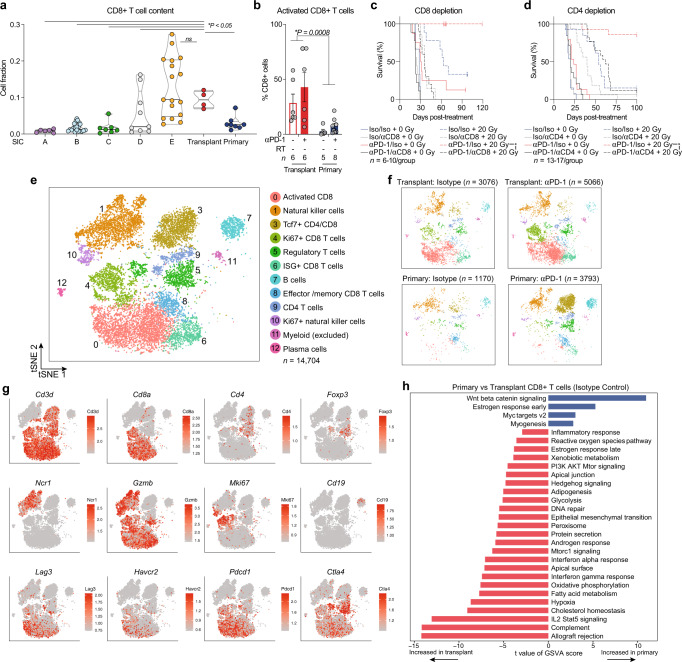
Immunotherapy fails to cure most cancer patients. Preclinical studies indicate that radiotherapy synergizes with immunotherapy, promoting radiation-induced antitumor immunity. Most preclinical immunotherapy studies utilize transplant tumor models, which overestimate patient responses. Here, we show that transplant sarcomas are cured by PD-1 blockade and radiotherapy, but identical treatment fails in autochthonous sarcomas, which demonstrate immunoediting, decreased neoantigen expression, and tumor-specific immune tolerance. We characterize tumor-infiltrating immune cells from transplant and primary tumors, revealing striking differences in their immune landscapes. Although radiotherapy remodels myeloid cells in both models, only transplant tumors are enriched for activated CD8+ T cells. The immune microenvironment of primary murine sarcomas resembles most human sarcomas, while transplant sarcomas resemble the most inflamed human sarcomas. These results identify distinct microenvironments in murine sarcomas that coevolve with the immune system and suggest that patients with a sarcoma immune phenotype similar to transplant tumors may benefit most from PD-1 blockade and radiotherapy.


Conflict of interest statement

D.G.K. is a cofounder of XRAD Therapeutics, which is developing radiosensitizers. D.G.K. and Y.M.M. are recipients of a Stand Up To Cancer (SU2C) MSD Catalyst Grant studying pembrolizumab and radiation therapy in sarcoma patients. D.G.K. has received research funding from XRAD Therapeutics, Eli Lilly & Co., Bristol Myers Squibb, Varian Medical Systems, and served as chair of the Developmental Therapeutics Committee for the Sarcoma Alliance for Research through Collaboration. E.S.M. and L.C. are employees of Merck Sharp & Dohme Corp, a subsidiary of Merck & Co., Inc., Kenilworth, NJ, USA. The other authors declare no competing interests.

Figures

Fig. 1
Fig. 1. Immune checkpoint blockade and radiation therapy cure transplant but not primary sarcomas.
a Transplant tumor initiation by p53/MCA cell injection into the gastrocnemius. Mice were treated with anti (α)-PD-1 (red) or isotype control (blue) antibody and 0 (solid) or 20 (dashed) Gy when tumors reached >70 mm3. b Primary sarcoma initiation by intramuscular injection of Adeno-Cre and MCA. Treatment as in panel (a). c Mice with transplant sarcomas received either both isotype control antibodies with 0 Gy (solid blue, n = 10), αPD-1 and αCTLA-4 with 0 Gy (solid red, n = 11), both isotype control antibodies with 20 Gy (dashed blue, n = 10), or αPD-1 and αCTLA-4 with 20 Gy (dashed red, n = 10). d Mice with transplant sarcomas received either both isotype control antibodies with 0 Gy (solid blue, n = 22), αPD-1 and αCTLA-4 with 0 Gy (solid red, n = 22), both isotype control antibodies with 20 Gy (dashed blue, n = 20), or αPD-1 and αCTLA-4 with 20 Gy (dashed red, n = 18). Survival curves estimated using Kaplan–Meier method; pairwise significance determined by log-rank test and Bonferroni correction. *P < 0.05. Source data are provided as a Source data file.
Fig. 2
Fig. 2. Evidence of immune editing at the DNA and RNA levels in primary tumors.
a Nonsynonymous mutations in transplant and primary p53/MCA tumors harvested 3 days after specified treatment. The original primary tumor (filled, black) used to generate the cell line (right) from which the transplant tumors were derived is also shown. P < 0.001 for transplant vs primary tumors, P = 0.026 for primary tumors with isotype vs primary tumors with anti-PD-1 and 20 Gy. b Fraction of neoantigenic mutations expressed by RNA sequencing (>5 mutant and >5 WT reads). P < 0.001 for transplant vs primary tumors. c Average expression level of genes with neoantigens in transplant tumors, primary tumors, and the cell line quantified as fragments per kilobase of transcript per million mapped reads (FPKM), upper quartile normalized, log2 transformed. d Nonsynonymous mutations in primary p53/MCA tumors from Rag2−/− and Rag2+/− mice harvested when tumor volume reached 70–150 mm3. P = 0.01 for Rag2−/− vs Rag2+/−. e Fraction of neoantigenic mutations expressed by RNA sequencing (>5 mutant and >5 WT reads). f Average expression level of genes with neoantigens, calculated as in (c). P = 0.036 in Rag2−/− vs Rag2+/−. For af, each symbol represents an individual mouse. Mean ± SEM. For ac transplant tumors: n = 4; primary tumors: n = 8; significance determined by three-way ANOVA with Tukey’s multiple comparisons test. For df Rag2−/− tumors: n = 8; Rag2+/− tumors: n = 7; significance determined by unpaired two-tailed t-test. Source data are provided as a Source data file.
Fig. 3
Fig. 3. Primary tumors induce immune tolerance.
a Transplant tumors generated by injecting cells from a primary tumor into naive mice or donor mice. b Time to tumor onset in donor (blue) or naive (red) mice. c Survival after αPD-1 and 10 Gy RT. d Cell lines from primary tumors in donor (“self”) or other (“non-self”) mice were injected into donor mice. e Time to tumor onset after self (blue) or non-self (black, dashed) cells injected into donor mice. f Cell lines from amputated primary sarcomas were injected into donor or naive mice after total body irradiation (TBI) followed by bone marrow transplant (BMT). g Time to tumor onset in donor (blue) or naive (red) mice. h Survival after αPD-1 and 20 Gy RT in donor (blue) or naive (red) mice that developed tumors. Survival curves estimated using Kaplan–Meier method; significance determined by log-rank test and Bonferroni correction. Source data are provided as a Source data file.
Fig. 4
Fig. 4. Transcriptional signatures in mouse and human sarcomas.
a Gene ontology analysis of differentially regulated processes in primary (blue) versus transplant (red) sarcomas after isotype treatment. b Spearman correlation analysis of bulk tumor RNA from primary tumors (n = 8) and untreated human UPS (TCGA, n = 87). c Spearman correlation of bulk tumor RNA from transplant tumors (n = 4) and untreated human UPS (TCGA, n = 87). d Cellular composition of TCGA sarcomas (DDLPS, dedifferentiated liposarcoma; LMS, leiomyosarcoma; UPS, undifferentiated pleomorphic sarcoma) (n = 218) separated by previously defined sarcoma immune class (SIC, left) and murine primary sarcomas (right). Sample sizes: SIC A (n = 57), SIC B (n = 52), SIC C (n = 36), SIC D (n = 34), SIC E (n = 39), primary (n = 8), and transplant (n = 4). e Immune cell content of TCGA sarcomas by sarcoma immune class (SIC) and murine sarcomas. Sample sizes: SIC A (n = 6), SIC B (n = 21), SIC C (n = 7), SIC D (n = 9), SIC E (n = 17), primary (n = 8), and transplant (n = 4). Significance determined by two-sided Wilcoxon test. f Immune cell composition of TCGA sarcomas by sarcoma immune class (SIC) and murine sarcomas. In bf, cell proportions enumerated by CIBERSORTx. Source data are provided as a Source data file.
Fig. 5
Fig. 5. Tumor and treatment promote myeloid cell remodeling.
a M2 macrophage content of TCGA UPS (by SIC) and murine sarcomas by CIBERSORTx. P values shown for SIC A-D, E, and primary tumors each vs transplant tumors by two-sided Wilcoxon test. Sample sizes as follows: SIC A (n = 6), SIC B (n = 21), SIC C (n = 7), SIC D (n = 9), SIC E (n = 17), primary (n = 8), and transplant (n = 4). b Frequency of PD-L1+ macrophages by CyTOF. Data show mean ± SEM, analyzed by three-way ANOVA. c tSNE plot of myeloid cell scRNA-seq subclustering from all tumor and treatment groups. For major clusters, legend lists tumor/treatment group(s) where each cluster is enriched and description. ISG, interferon-stimulated gene. d Distribution of myeloid cells, separated by tumor and treatment type. n = 4 tumors per group for transplant, n = 5 tumors per group for primary. e Expression levels of marker genes. f Distribution of myeloid cells from primary tumors treated with 20 Gy RT and isotype (left) or αPD-1 (n = 5 per group). g Pathways with significantly different activities per cell using GSVA between myeloid cells from primary tumors treated with αPD-1 and 20 Gy vs αPD-1 and 0 Gy (n = 25,811 cells analyzed). Pathways shown are significant at false-discovery rate <0.01. Source data are provided as a Source data file.
Fig. 6
Fig. 6. Tumor and treatment promote lymphoid cell remodeling.
a CD8+ T cell content of TCGA UPS by sarcoma immune class (SIC) and murine sarcomas by CIBERSORTx. P values shown for each group vs transplant tumors by two-sided Wilcoxon test. Sample sizes as follows: SIC A (n = 6), SIC B (n = 21), SIC C (n = 7), SIC D (n = 9), SIC E (n = 17), primary (n = 8), and transplant (n = 4). b Frequency of activated (Lag3+ Tim3+) CD8+ T cells by CyTOF. Data show mean ± SEM by two-way ANOVA. c Mice with transplant sarcomas received either αPD-1 or isotype control antibodies, αCD8 or isotype control, and 0 Gy (solid) or 20 Gy (dashed) when tumors reached >70 mm3. Surviving mice were censored 164 days after treatment (*P = 0.002). Sample sizes: Iso/Iso + 0 Gy n = 6, Iso/αCD8 + 0 Gy n = 9, αPD-1/Iso + 0 Gy n = 8, αPD-1/αCD8 + 0 Gy n = 9, Iso/Iso + 20 Gy n = 9, Iso/αCD8 + 20 Gy n = 7, αPD-1/Iso + 20 Gy n = 7, αPD-1/αCD8 + 20 Gy n = 10. d Mice with transplant sarcomas received either αPD-1 or isotype control antibodies, αCD4 or isotype control, and 0 Gy (solid) or 20 Gy (dashed) when tumors reached >70 mm3. Surviving mice were censored 100 days after treatment (*P = 0.002). Sample sizes: Iso/Iso + 0 Gy n = 13, Iso/αCD4 + 0 Gy n = 15, αPD-1/Iso + 0 Gy n = 15, αPD-1/αCD4 + 0 Gy n = 14, Iso/Iso + 20 Gy n = 13, Iso/αCD4 + 20 Gy n = 16, αPD-1/Iso + 20 Gy n = 14, αPD-1/αCD4 + 20 Gy n = 17. e tSNE plot of lymphoid cell scRNA-seq subclustering from all tumor and treatment groups. f Distribution of lymphoid cells, separated by tumor and treatment type. n = 4 tumors per group for transplant, n = 5 tumors per group for primary. g Expression levels of marker genes. h Pathways with significantly different activities per cell using GSVA between CD8+ T cells from untreated (isotype control) primary tumors versus transplant tumors (n = 2473 cells analyzed). Pathways shown are significant at false-discovery rate <0.01. For c and d, survival curves estimated using Kaplan–Meier method; pairwise significance determined by log-rank test and Bonferroni correction. Source data are provided as a Source data file.

References

    1. Moding EJ, Kastan MB, Kirsch DG. Strategies for optimizing the response of cancer and normal tissues to radiation. Nat. Rev. Drug Discov. 2013;12:526–542. doi: 10.1038/nrd4003. - DOI - PMC - PubMed
    1. Demaria S, Bhardwaj N, McBride WH, Formenti SC. Combining radiotherapy and immunotherapy: a revived partnership. Int. J. Radiat. Oncol. Biol. Phys. 2005;63:655–666. doi: 10.1016/j.ijrobp.2005.06.032. - DOI - PMC - PubMed
    1. Vanpouille-Box C, Pilones KA, Wennerberg E, Formenti SC, Demaria S. In situ vaccination by radiotherapy to improve responses to anti-CTLA-4 treatment. Vaccine. 2015;33:7415–7422. doi: 10.1016/j.vaccine.2015.05.105. - DOI - PMC - PubMed
    1. Formenti SC, Demaria S. Radiation therapy to convert the tumor into an in situ vaccine. Int. J. Radiat. Oncol. Biol. Phys. 2012;84:879–880. doi: 10.1016/j.ijrobp.2012.06.020. - DOI - PMC - PubMed
    1. Burnette BC, et al. The efficacy of radiotherapy relies upon induction of type i interferon-dependent innate and adaptive immunity. Cancer Res. 2011;71:2488–2496. doi: 10.1158/0008-5472.CAN-10-2820. - DOI - PMC - PubMed

Publication types

MeSH terms

Substances