. 2020 Dec 17;10(1):22137.
doi: 10.1038/s41598-020-78790-5.

Analysis of mutant and total huntingtin expression in Huntington's disease murine models

Affiliations

Analysis of mutant and total huntingtin expression in Huntington's disease murine models

Valentina Fodale et al. Sci Rep. .

Abstract

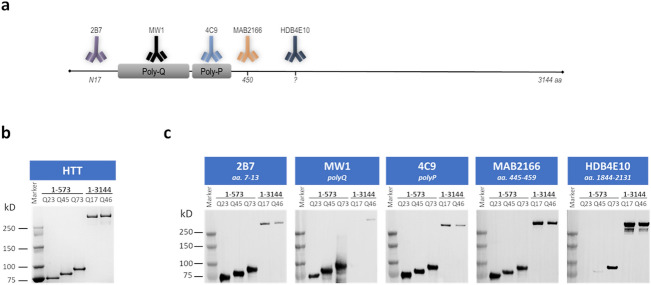
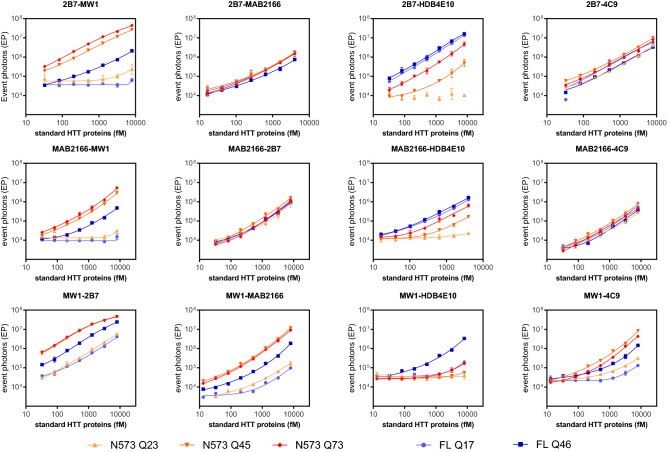
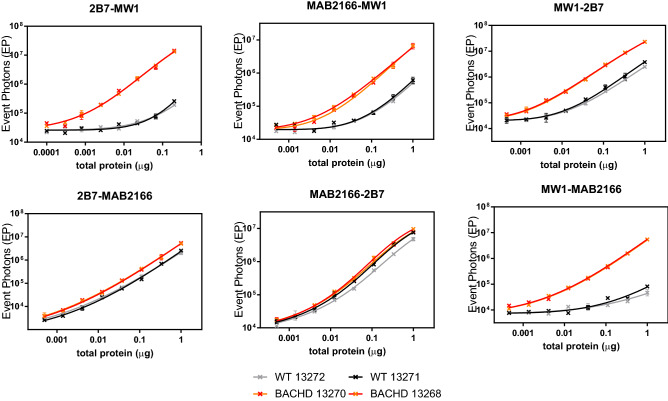
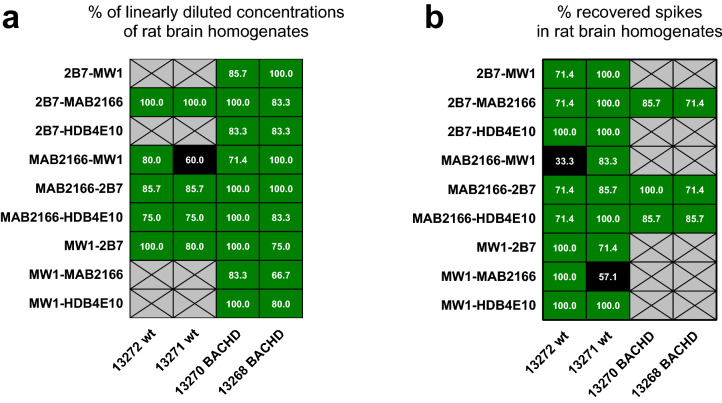
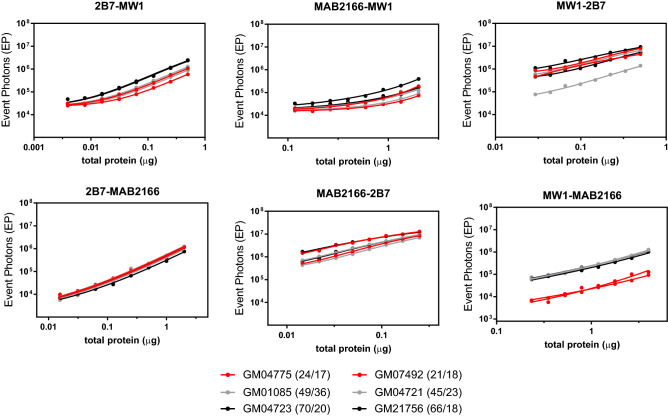
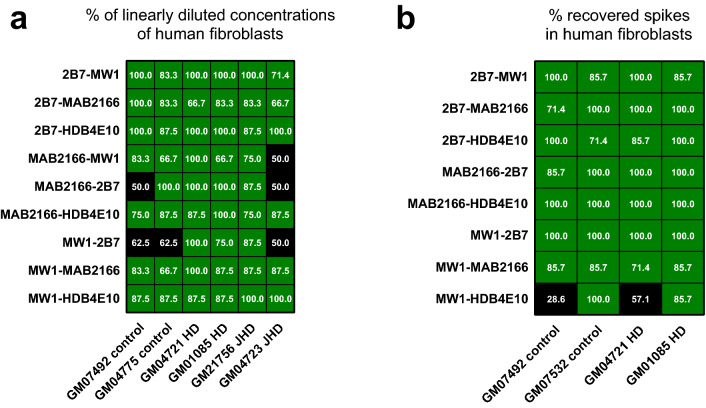
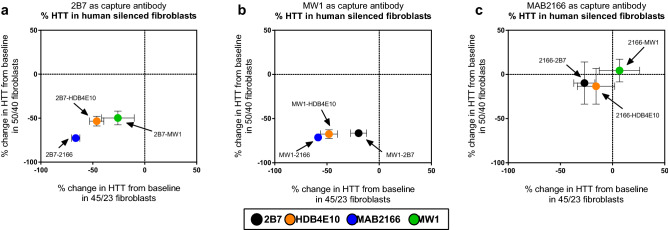
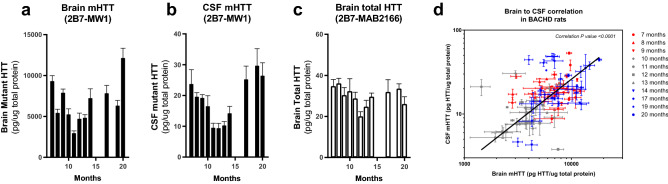
Huntington's disease (HD) is a monogenetic neurodegenerative disorder that is caused by the expansion of a polyglutamine region within the huntingtin (HTT) protein, but there is still an incomplete understanding of the molecular mechanisms that drive pathology. Expression of the mutant form of HTT is a key aspect of diseased tissues, and the most promising therapeutic approaches aim to lower expanded HTT levels. Consequently, the investigation of HTT expression in time and in multiple tissues, with assays that accurately quantify expanded and non-expanded HTT, are required to delineate HTT homeostasis and to best design and interpret pharmacodynamic readouts for HTT lowering therapeutics. Here we evaluate mutant polyglutamine-expanded (mHTT) and polyglutamine-independent HTT specific immunoassays for validation in human HD and control fibroblasts and use to elucidate the CSF/brain and peripheral tissue expression of HTT in preclinical HD models.


Conflict of interest statement

The authors declare no competing interests.

Figures

Figure 1
Figure 1
Reagent qualification. (a) Schematic of the HTT protein and the location of the epitope of each antibody used in the present work (the protein length is not properly scaled). (b) Coomassie staining of the five standard protein used in the present work (left to right for each panel: N573 Q22, N573 Q45, N573 Q72, FL Q17, FL Q46). (c) Western blots of the five standard proteins (left to right for each panel: N573 Q22, N573 Q45, N573 Q72, FL Q17, FL Q46) stained with the five antibodies used in the present work. Figure S-1 shown the full length gels and the high exposure full length Western blots.
Figure 2
Figure 2
Performance of the standard curve detection by all antibody pairs. The five standard HTT proteins (N573 Q22, N573 Q45, N573 Q72, FL Q17, FL Q46) were serially diluted from 8 pM and assayed via SMC using the antibody pair reported on the title of each chart; the first mentioned antibody was used as capture whereas the second was used as detection. Each experimental point is reported as the average and standard deviations of a triplicate.
Figure 3
Figure 3
mHTT specificity of the detection in wild type and BACHD rat brain homogenates. Two wild type rats (13272 and 13271 grey and black respectively) and two BACHD rats (13270 and 13266 red and orange respectively) brain homogenates were diluted starting from 1.3 µg/ml total protein for the 2B7-MW1 assay and from 6.7 µg/ml total protein for all other antibody pairs. Each dilution curve was assayed via SMC using the antibody pair reported on the title of each chart. Each experimental point is reported as the average and standard deviations of a triplicate. Results for assays containing the HDB4E10 and 4C9 antibodies are reported in Fig. S-3.
Figure 4
Figure 4
Dilution linearity and spike recovery in wild type and BACHD rat brain homogenates. Grey crossed cells represent not tested antibody pairs, black cells are antibody pairs that did not meet the 67% acceptance criteria (see text), green cells show antibody pairs with achieved dilution linearity and/or spike recovery. (a) Two wild type rats(13272 and 13271) and two BACHD rats (13270 and 13266) brain homogenates were diluted starting 1.3 µg/ml of total protein for the 2B7-MW1 assay and from 6.7 µg/ml of total protein for all other antibody pairs for 7 dilution points. Each dilution curve was assayed via SMC using the antibody pair reported on the x-axis. The percentage of the dilution points within ± 20% RE% is reported in each cell of the heat-map. The acceptance threshold is 66.7%; all passed conditions are coloured in green. All data for each matrix and assay is reported in the supplementary figure S-4 along with an example of the dilution linearity calculations. The Dilution linearity of wild type homogenates for the 2B7-MW1, 2B7-HDB4E10, MW1-MAB2166, and MW1-HDB4E10 are not reported as most dilution points were below the LLoQ for these assays. (b) The same four rat brain samples were spiked with a serial dilution of the recombinant FL HTT Q46 and assayed via SMC using the antibody pair reported on the x-axis. The percentage of the recovered spikes, within one matrix, are in each cell of the heat-map. The acceptance threshold is 66.7%; all passed conditions are coloured in green. All data for each matrix and assays are reported in the supplementary figure S-5. The spike recovery test was not run in BACHD rat homogenates with assays including the MW1 antibody as the signal of the endogenous analyte was too high.
Figure 5
Figure 5
mHTT specificity of the detection in normal, HD, and JHD human fibroblast lysates. Two control GM04775 (24/17) and GM07492 (21/18), two HD GM04721 (49/36) and GM01085 (45/23) and two JHD GM04723 (70/20) and GM21756 (66/18) fibroblast cell lysates were diluted and assayed via SMC using the antibody pair reported on the title of each chart. Due to the large difference in sensitivity among the various antibody pair, the x-axis scale is not directly comparable for all charts. Each experimental point is reported as the average and standard deviations of a triplicate. Results for assays containing the HDB4E10 and 4C9 antibodies are reported in Fig. S-6.
Figure 6
Figure 6
Dilution linearity and spike recovery in wild type, HD and JHD human fibroblast lysates. Black cells are antibody pairs that did not meet the 67% acceptance criteria (see text), green cells show antibody pairs with achieved dilution linearity and/or spike recovery. (a) Two control GM04775 (24/17) and GM07492 (21/18), two HD GM04721 (49/36) and GM01085 (45/23) and two JHD GM04723 (70/20) and GM21756 (66/18) fibroblast cell lysate were diluted for 7 dilution points and assayed via SMC using the antibody pair reported on the x-axis. The percentage of the dilution points within the ± 20% RE% is reported in each cell of the heat-map. The acceptance threshold is 66.7%; all conditions passing this threshold are coloured in green. All data for each matrix and each assay are reported in the supplementary figure S-7, calculations were carried out as reported for Fig. 4. (b) Two controls GM07492 (24/17) and GM07532 (23/19), two HD (GM0185 (45/23) and GM04721 (49/36) fibroblast lysate were spiked with a serial dilution of the recombinant FL HTT Q46 and assayed via SMC using the antibody pair reported on the x-axis. The percentage of the recovered spikes, within one matrix, is reported in each cell of the heat-map. The acceptance threshold is 66.7%; all conditions passing this threshold are coloured in green. All data for each matrix and assay are reported in the supplementary figure S-8.
Figure 7
Figure 7
Assay specificity for HTT/mHTT in cells. The percentage signal decrease of HTT silenced samples with respect to control treated samples was measured via SMC by multiple antibody combinations and is reported on the x-axis for GM01085 (45/23) and on the y-axis for GM04857 (50/40). All numeric results are available in S-9. The leftmost group reports the result of the assays with the 2B7 antibody as capture. The middle panel reports the result of the assays with the MW1 antibody as capture, whereas the rightmost panel reports the result of the assays with the MAB2166 as capture antibody. Each colour represents a different detection antibody as reported in the legend. Each result is presented as the average and standard deviation of three independent experiments. Validation of the silencing via Western blot is presented in the supplementary material S-9. Each experimental point is reported as the average and standard deviations of a triplicate.
Figure 8
Figure 8
CSF and brain HTT and mHTT levels in a BACHD life-span study. (a) Brain mHTT levels as measured by the 2B7-MW1 SMC assay in a cohort of c. 10 BACHD rats for time point. (b) CSF mHTT levels as measured by the 2B7-MW1 SMC assay in a cohort of c. 10 BACHD rats for time point. (c) Brain levels of total HTT as measured  by the 2B7-MAB2166 SMC assay in a cohort of c. 10 rats for time point. (d) Correlation (non-parametric Spearman correlation, two-tailed p value, confidence interval = 95%, p < 0.0001, r2 = 0.52) of mHTT levels between brain (x-axis) and CSF (y-axis) at multiple time points (symbol shapes) and age periods (colours) as measured by the 2B7-MW1 SMC assay. Every experimental point is reported as average and standard deviation of a technical triplicate. All numeric values are available in the supplementary material S-10.
Figure 9
Figure 9
Time-course HTT and mHTT levels in wild type and Q175 tissues. (a) Total HTT levels, as measured by the 2B7-MAB2166 SMC assay in different tissues and at different time points, are reported as heat maps for wild type (left) and Q175 KI (right) mice. Each colour represents the average levels of four to six animals. (b) mHTT levels, as measured by the 2B7-MW1 SMC assay in different tissues and at different time points, are reported as heat map for Q175 KI mice. Each colour is the average levels of four to six animals. (c) The ratio between mHTT and total HTT in Q175 samples is reported for each analysed tissue and time point as heat map. (d) Total HTT (left panel) and mHTT (right panel) levels for each animal are presented for the striatum (grey) and kidney (white) of Q175 animals. All numeric values are available in the supplementary material S-11.

References

    1. The Huntington’s Disease Collaborative Research Group. A novel gene containing a trinucleotide repeat that is expanded and unstable on Huntington’s disease chromosomes. The Huntington’s Disease Collaborative Research Group. Cell72, 971–83 (1993). - PubMed
    1. Leavitt BR, Wellington CL, Hayden MR. Recent insights into the molecular pathogenesis of Huntington disease. Semin. Neurol. 1999;19:385–395. doi: 10.1055/s-2008-1040853. - DOI - PubMed
    1. Dé F, Saudou R, Humbert S. The biology of huntingtin. Neuron. 2016;89:910–926. doi: 10.1016/j.neuron.2016.02.003. - DOI - PubMed
    1. Lane RM, et al. Translating antisense technology into a treatment for Huntington’s disease. Methods Mol. Biol. 2018;1780:497–523. doi: 10.1007/978-1-4939-7825-0_23. - DOI - PubMed
    1. Aronin N, DiFiglia M. Huntingtin-lowering strategies in Huntington’s disease: antisense oligonucleotides, small RNAs, and gene editing. Mov. Disord. 2014;29:1455–1461. doi: 10.1002/mds.26020. - DOI - PubMed

MeSH terms