. 2020 Dec 17;10(1):22255.
doi: 10.1038/s41598-020-79268-0.

Methyl-CpG-binding protein 2 mediates overlapping mechanisms across brain disorders

Affiliations

Methyl-CpG-binding protein 2 mediates overlapping mechanisms across brain disorders

Snow Bach et al. Sci Rep. .

Abstract

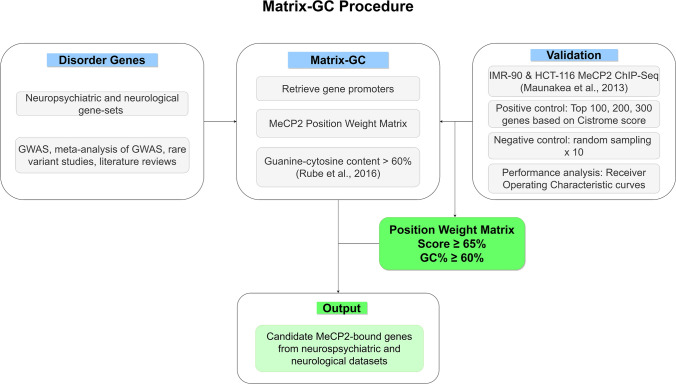
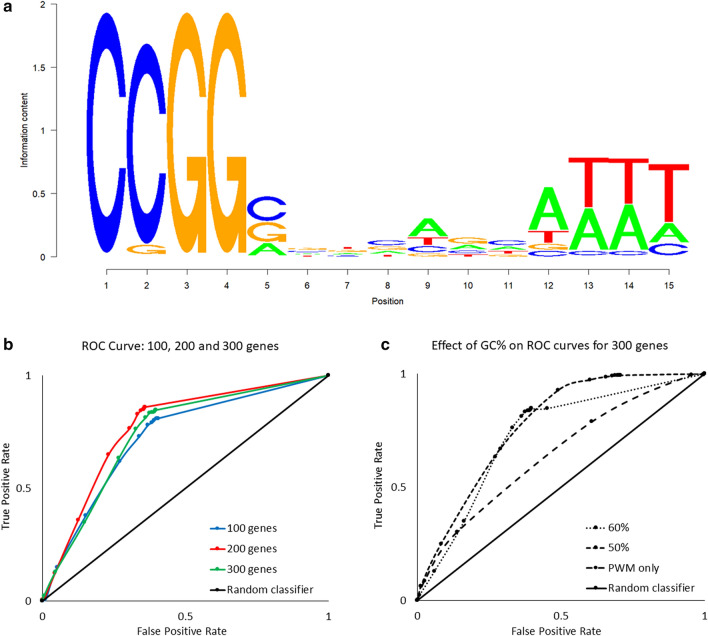
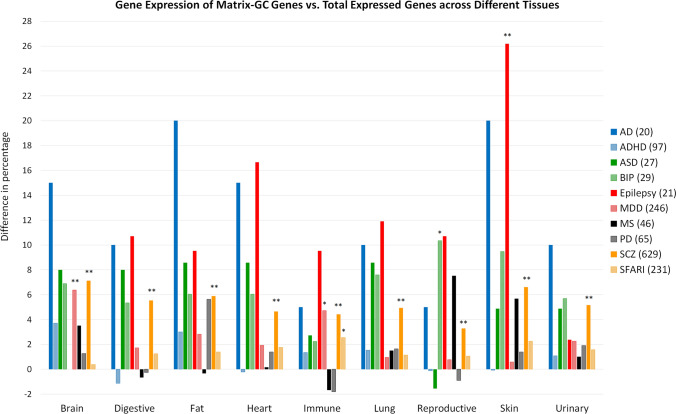
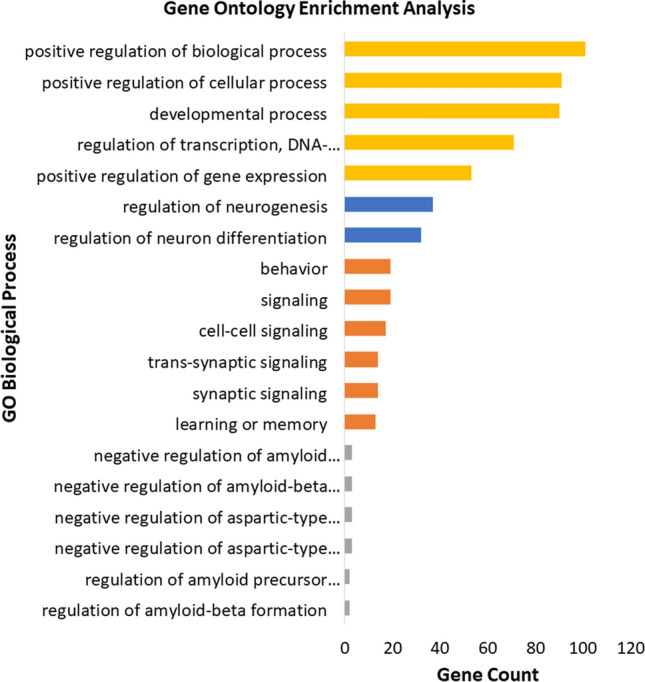
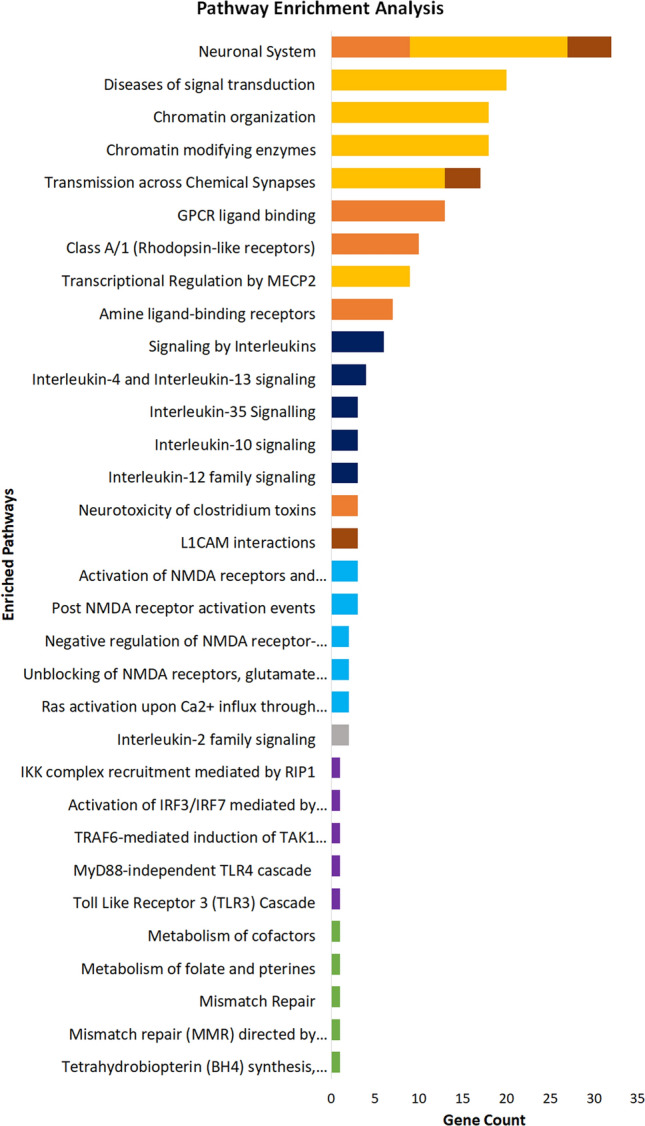
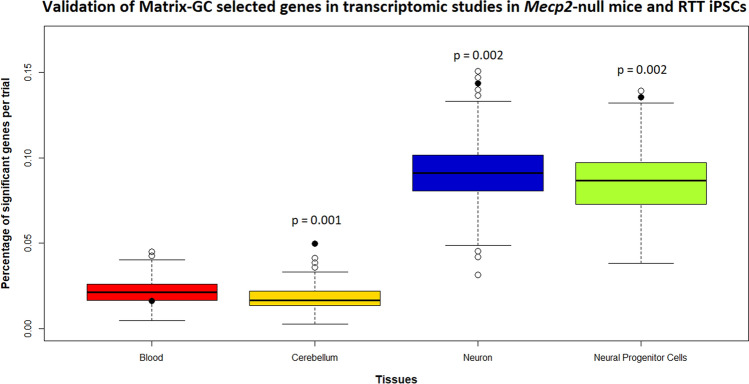
MECP2 and its product, Methyl-CpG binding protein 2 (MeCP2), are mostly known for their association to Rett Syndrome (RTT), a rare neurodevelopmental disorder. Additional evidence suggests that MECP2 may underlie other neuropsychiatric and neurological conditions, and perhaps modulate common presentations and pathophysiology across disorders. To clarify the mechanisms of these interactions, we develop a method that uses the binding properties of MeCP2 to identify its targets, and in particular, the genes recognized by MeCP2 and associated to several neurological and neuropsychiatric disorders. Analysing mechanisms and pathways modulated by these genes, we find that they are involved in three main processes: neuronal transmission, immuno-reactivity, and development. Also, while the nervous system is the most relevant in the pathophysiology of the disorders, additional systems may contribute to MeCP2 action through its target genes. We tested our results with transcriptome analysis on Mecp2-null models and cells derived from a patient with RTT, confirming that the genes identified by our procedure are directly modulated by MeCP2. Thus, MeCP2 may modulate similar mechanisms in different pathologies, suggesting that treatments for one condition may be effective for related disorders.


Conflict of interest statement

The authors declare no competing interests.

Figures

Figure 1
Figure 1
Overview of Matrix-GC procedure to detect MeCP2 binding sites in silico. The Matrix-GC procedure aims at identifying genes that are bound by MeCP2, through a combination of MeCP2 position weight matrix and DNA sequence GC%. We validate this procedure through positive and negative controls using ChIP-seq data (Maunakea et al., 2013) and evaluate its performance through Receiver Operating Characteristic curves. We apply Matrix-GC to the promoters of candidate genes across neurological and neuropsychiatric disorders to generate a list of putative genes bound by MeCP2 from each disorder.
Figure 2
Figure 2
Construction of MeCP2 position weight matrix (PWM) threshold and GC%: Matrix-GC Procedure using MeCP2 ChIP-Seq data on IMR-90 cells. (a) Sequence logo for the conservation sequence for MeCP2. (b) ROC curves for 100, 200 and 300 genes establishing a preferential PWM score threshold. The area under the curve (AUC) is 0.725, 0.7685, 0.7419, for 100, 200 and 300 genes respectively. (c) ROC curves for 300 genes evaluating the effects of DNA sequence GC content percentage. The AUC values are 0.7301, 0.7692 and 0.6351 for GC content percentages of 50%, 60%, and PWM only, respectively. The random classifier is represented by x = y and has an AUC of 0.50.
Figure 3
Figure 3
Genes associated to each disorder and tissue (horizontal axis) have a different RNA expression distribution (vertical, in percent) before and after Matrix-GC. Distribution of RNA expression, by tissue, for genes associated to brain disorders before and after Matrix-GC. The vertical axis reports the difference between the percentage of genes expressed in the different systems before and after Matrix-GC. Disorders included are Autism database (SFARI, Yellow), schizophrenia (SCZ, Orange), Parkinson’s disease (PD, Grey), multiple sclerosis (MS, Black), major depressive disorder (MDD, Pink), epilepsy (Red), autism (ASD, Dark Green), Alzheimer’s disease (AD, Blue), attention deficit hyperactivity disorder (ADHD, Light Blue) and bipolar disorder (BIP, Light Green). For immune, digestive, urinary and reproductive systems we considered data from different organs. Immune tissues include data from: lymph node, bone marrow, spleen, adrenal, thyroid and appendix data. Digestive includes data from: colon, duodenum, oesophagus, gall bladder, pancreas, liver, small intestine, salivary gland and stomach data. Reproductive tissues include data from: ovary, testis, endometrium, prostate and placenta. Urinary System urinary bladder and kidney data. Numbers in parentheses represent the total number of genes for which expression data was retrieved. The Fisher’s exact test was used for statistical calculations. *represents p value ≤ 0.05 and ** represents p value ≤ 0.01.
Figure 4
Figure 4
Gene Ontology enrichment analysis of neuropsychiatric and neurological disorders using GOrilla Enrichment. Bar plot of the 5 most significant results from Gene Ontology enrichment analysis of each neuropsychiatric and neurological datasets after the Matrix-GC. The following disorders are represented: attention deficit hyperactivity disorder (ADHD, Orange), schizophrenia (SCZ, Blue), Alzheimer’s disease (AD, Grey), Autism database (ASD-SFARI, Yellow). Full statistical results from GOrilla Enrichment can be found in the Supplementary Information files. Control permutation analysis was carried out on randomly generated and size-matched, from hg19 human reference genome and exome subset.
Figure 5
Figure 5
Pathway enrichment analysis of neuropsychiatric and neurological disorders using ReactomePA. Bar plot of the 5 most significant results from pathway enrichment analysis of each neuropsychiatric and neurological datasets after Matrix-GC. The following disorders are represented: attention deficit hyperactivity disorder (ADHD, Orange), bipolar disorder (BIP, Brown), Alzheimer’s disease (AD, Grey), multiple sclerosis (MS, Dark Blue), Parkinson’s disease (PD, Light Blue) Huntington’s disease (HD, Green) and amyotrophic lateral sclerosis (ALS, Purple), autism database (ASD-SFARI, Yellow). Full statistical results from ReactomePA can be found in the Supplementary Information files. Control permutation analysis was carried out on randomly generated and size-matched, from hg19 human reference genome and exome subset.
Figure 6
Figure 6
Validation of Matrix-GC selected genes in transcriptomic studies in Mecp2-null mice and RTT iPSCs. Distribution of significant genes (vertical axis, in percent) against experimental groups (horizontal): blood in Mecp2tm1.1Bird mice (Red), cerebellum in Mecp2tm1.1Bird mice (Yellow), iPSCs-derived neurons from RTT patient (Blue, MECP2 Del ex 3–4 mutation), iPSCs-derived Neural Progenitor Cells from RTT patient (Green, MECP2 Del ex 3–4 mutation). Monte Carlo permutation analysis yields the percentage of significant genes (p value ≤ 0.5) on 1000 randomly generated and sized-matched control gene-sets. The line within the box represents the median of the distribution. The top and bottom edges of the box represent the 3rd quartile (Q3) and 1st quartile (Q1) respectively. The upper and bottom whiskers represent Q3 + 1.5 times interquartile range, and Q1 – 1.5 times the interquartile range. Empty circles represent the outlier observations in each group, solid circles the percentage of Matrix-GC filtered genes in each group. p values are reported above groups where Matrix-GC filtered genes are significant among controls.

References

    1. Chen WG, et al. Derepression of BDNF transcription involves calcium-dependent phosphorylation of MeCP2. Science (80-) 2003;302:885–889. doi: 10.1126/science.1086446. - DOI - PubMed
    1. Srivastav S, Walitza S, Grünblatt E. Emerging role of miRNA in attention deficit hyperactivity disorder: a systematic review. ADHD Atten. Deficit Hyperact. Disord. 2018;10:49–63. doi: 10.1007/s12402-017-0232-y. - DOI - PubMed
    1. Autry AE, Monteggia LM. Brain-derived neurotrophic factor and neuropsychiatric disorders. Pharmacol. Rev. 2012;64:238–258. doi: 10.1124/pr.111.005108. - DOI - PMC - PubMed
    1. Makedonski K, Abuhatzira L, Kaufman Y, Razin A, Shemer R. MeCP2 deficiency in Rett syndrome causes epigenetic aberrations at the PWS/AS imprinting center that affects UBE3A expression. Hum. Mol. Genet. 2005;14:1049–1058. doi: 10.1093/hmg/ddi097. - DOI - PubMed
    1. Coffee B, Zhang F, Ceman S, Warren ST, Reines D. Histone modifications depict an aberrantly heterochromatinized FMR1 gene in fragile X syndrome. Am. J. Hum. Genet. 2002;71:923–932. doi: 10.1086/342931. - DOI - PMC - PubMed

Publication types

Substances