. 2020 Dec 17;10(1):22225.
doi: 10.1038/s41598-020-79299-7.

COVID-19-mandated social restrictions unveil the impact of social time pressure on sleep and body clock

Affiliations

COVID-19-mandated social restrictions unveil the impact of social time pressure on sleep and body clock

Maria Korman et al. Sci Rep. .

Abstract

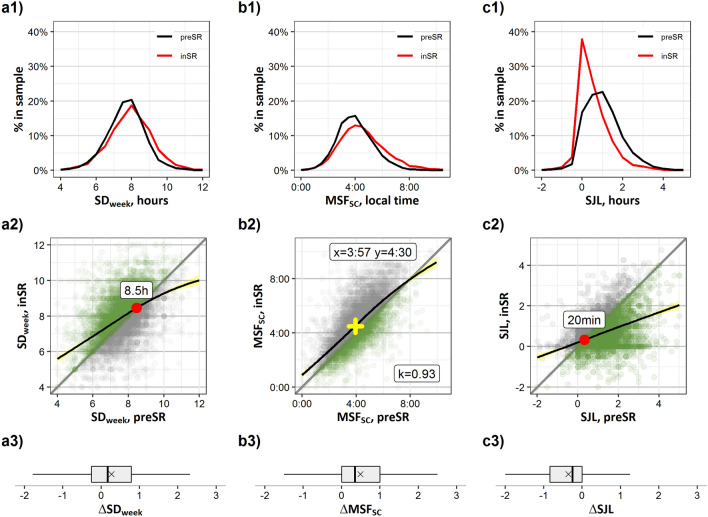
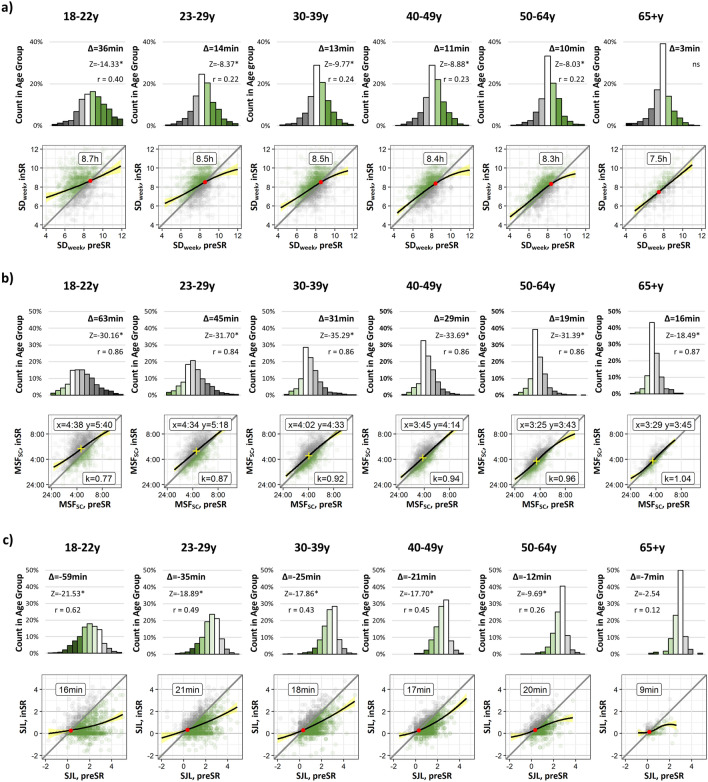
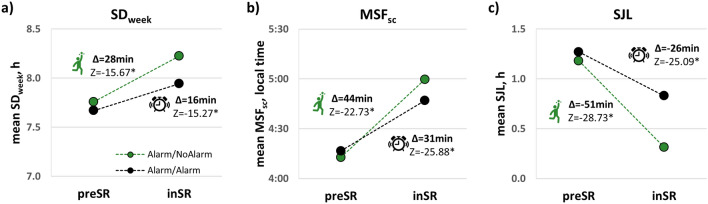
In humans, sleep regulation is tightly linked to social times that assign local time to events, such as school, work, or meals. The impact of these social times, collectively-social time pressure, on sleep has been studied epidemiologically via quantification of the discrepancy between sleep times on workdays and those on work-free days. This discrepancy is known as the social jetlag (SJL). COVID-19-mandated social restrictions (SR) constituted a global intervention by affecting social times worldwide. We launched a Global Chrono Corona Survey (GCCS) that queried sleep-wake times before and during SR (preSR and inSR). 11,431 adults from 40 countries responded between April 4 and May 6, 2020. The final sample consisted of 7517 respondents (68.2% females), who had been 32.7 ± 9.1 (mean ± sd) days under SR. SR led to robust changes: mid-sleep time on workdays and free days was delayed by 50 and 22 min, respectively; sleep duration increased on workdays by 26 min but shortened by 9 min on free days; SJL decreased by ~ 30 min. On workdays inSR, sleep-wake times in most people approached those of their preSR free days. Changes in sleep duration and SJL correlated with inSR-use of alarm clocks and were larger in young adults. The data indicate a massive sleep deficit under pre-pandemic social time pressure, provide insights to the actual sleep need of different age-groups and suggest that tolerable SJL is about 20 min. Relaxed social time pressure promotes more sleep, smaller SJL and reduced use of alarm clocks.


Conflict of interest statement

The authors declare no competing interests.

Figures

Figure 1
Figure 1
Social restriction-induced changes (preSR → inSR) in sleep–wake behavior in the general sample. (a1c1) Distributions of SDweek, MSFsc, and SJL preSR (black line) and inSR (red line), percent from group total. (a2c2) Scatterplots of sleep duration, SDweek (hours), corrected mid-sleep time on free days, MSFsc (chronotype, local time), and social jetlag, SJL (hours), preSR (x axis) vs. inSR (y axis). Each dot represents an individual participant, overlapping dots are coded by color intensity. Diagonal line designates no restriction-induced change in parameter. Green—increase/advance, grey—decrease/delay. Black line—LOESS regression lines illustrate the relationship between the parameter values preSR (x-axis) and the smoothed parameter values inSR (y-axis), pointwise 95% confidence intervals are visualized by bands shaded in yellow. Red dot—intersection point between the diagonal and the LOESS line. Yellow cross coordinates—means of MSFsc preSR and inSR; k—slope of the tangent for the LOESS regression line at the point of mean MSFsc preSR. (a3c3) Boxplots of individual differences (∆, hours) in SDweek, MSFsc and SJL. Positive values—increase in SDweek, delay in MSFsc. Negative values—decrease in SJL. Whiskers—max and min values, box borders—75th and 25th percentiles, line through the box—median, ×marker—mean.
Figure 2
Figure 2
Social restriction-induced changes (preSR → inSR) in sleep–wake behavior by age-group (18–22y, 23–29y, 30–39y, 40–49y, 50–64y, and 65 + y). Upper panels—distributions of (a) delta of sleep duration, ∆SDweek, (b) delta of corrected mid-sleep time on free days, ∆MSFsc (chronotype), (c) delta of social jetlag, ∆SJL. The magnitude of shifts is represented in 0.5 h color-coded bins, with white bars representing no change, green bar—increase in SDweek, advance in MSFsc and decrease in SJL, grey bars—decrease in SDweek, delay in MSFsc and increase in SJL. Mean ∆ in minutes and Z statistic of the post-hoc Wilcoxon Signed Ranks two-tailed tests for each parameter are shown above the bars. *p < 0.001, r effect size, ns non-significant. Lower panels—Scatterplots of individual shifts in (a) SDweek (h), (b) MSFsc (chronotype, local time), and (c) SJL (h), preSR (x axis) vs. inSR (y axis). Notations—as in Fig. 1a2–c2.
Figure 3
Figure 3
The contribution of alarm clock use on workdays to changes in daily behavior in participants who work from home inSR and used alarm clock preSR: Alarm/NoAlarm (green markers) and Alarm/Alarm (black markers) groups. Mean values of individual (a) SDweek (h), (b) MSFsc (chronotype, local time), and (c) SJL (h) parameters preSR and inSR. Mean ∆ in minutes and Wilcoxon Matched-Pairs two-tailed tests Z statistic for each parameter are shown on the graphs, *p < 0.001.

References

    1. Wang Q. Microbial Photosynthesis. Singapore: Springer; 2020.
    1. Rosbash, M. (NobelPrize.org. Nobel Media AB 2020, 2017).
    1. Roenneberg T, Daan S, Merrow M. The art of entrainment. J. Biol. Rhythms. 2003;18:183–194. doi: 10.1177/0748730403018003001. - DOI - PubMed
    1. Mistlberger RE, Skene DJ. Social influences on mammalian circadian rhythms: Animal and human studies. Biol. Rev. 2004;79:533–556. doi: 10.1017/s1464793103006353. - DOI - PubMed
    1. Kleitman N. Sleep and Wakefulness. Chicago: The University of Chicago Press; 1939.

Publication types