. 2020 Mar 2:97:100095.
doi: 10.1016/j.simyco.2020.02.001. eCollection 2020 Sep.

The global epidemiology of emerging Histoplasma species in recent years

Affiliations

The global epidemiology of emerging Histoplasma species in recent years

A M Rodrigues et al. Stud Mycol. .

Abstract

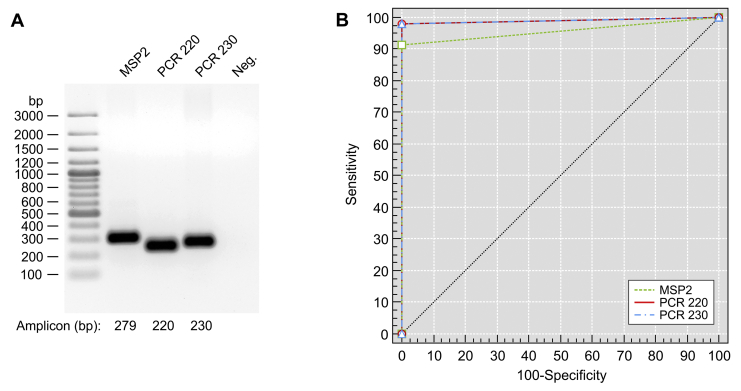
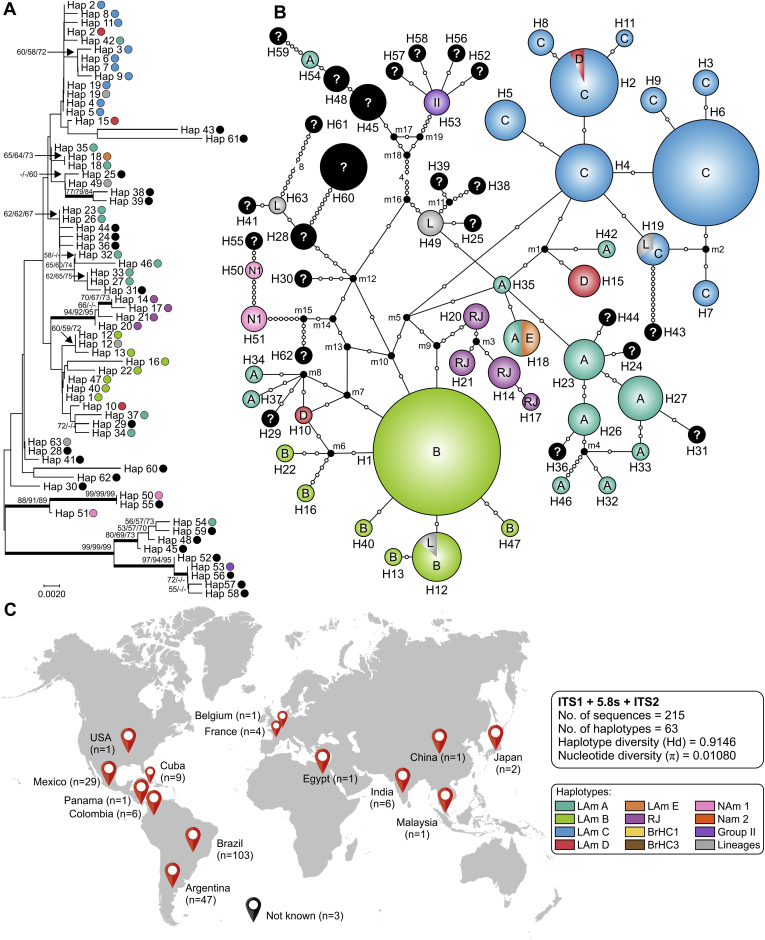
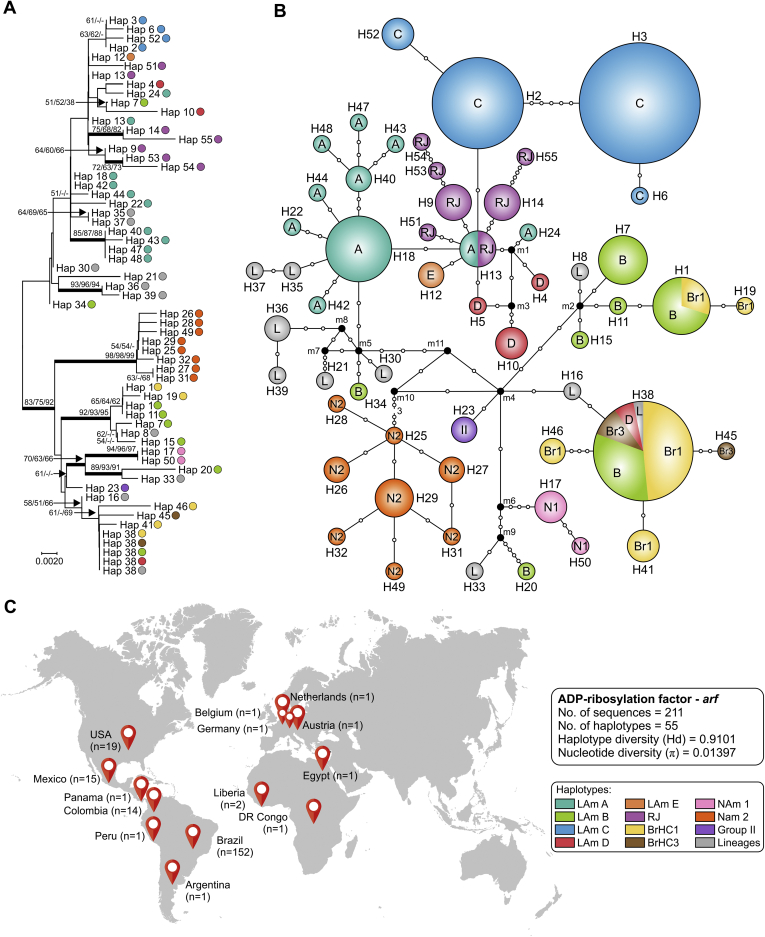
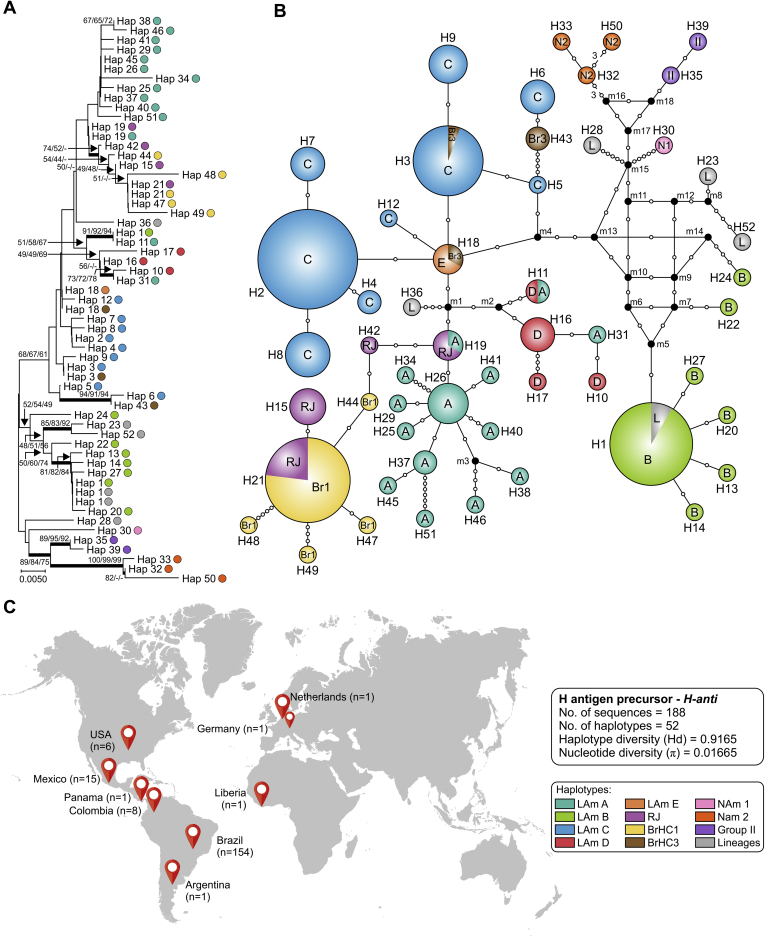
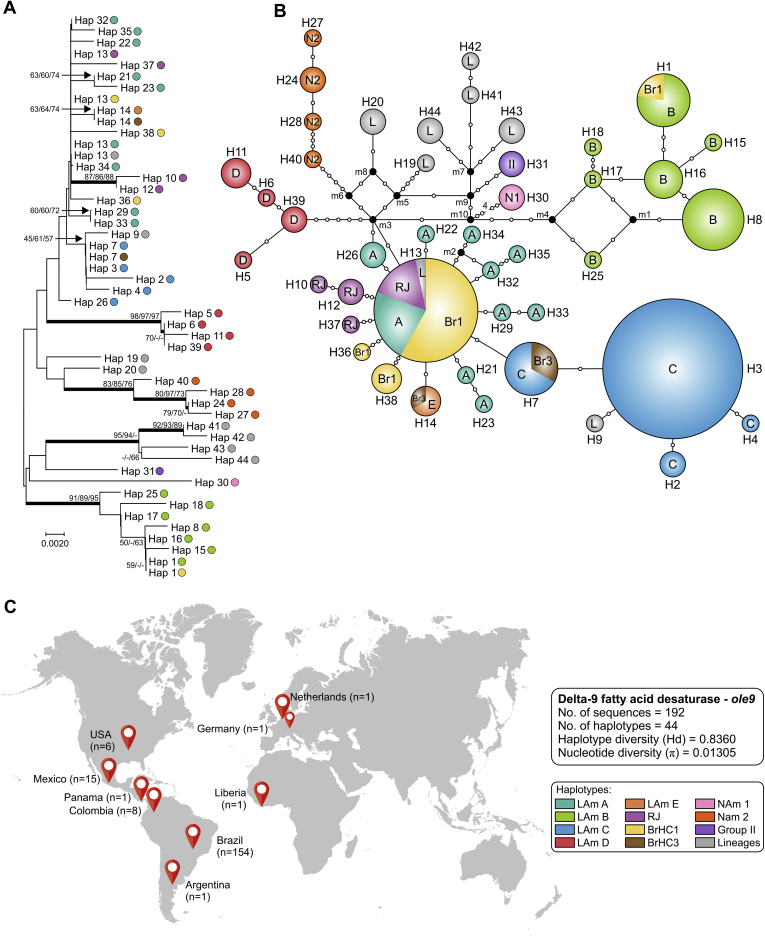
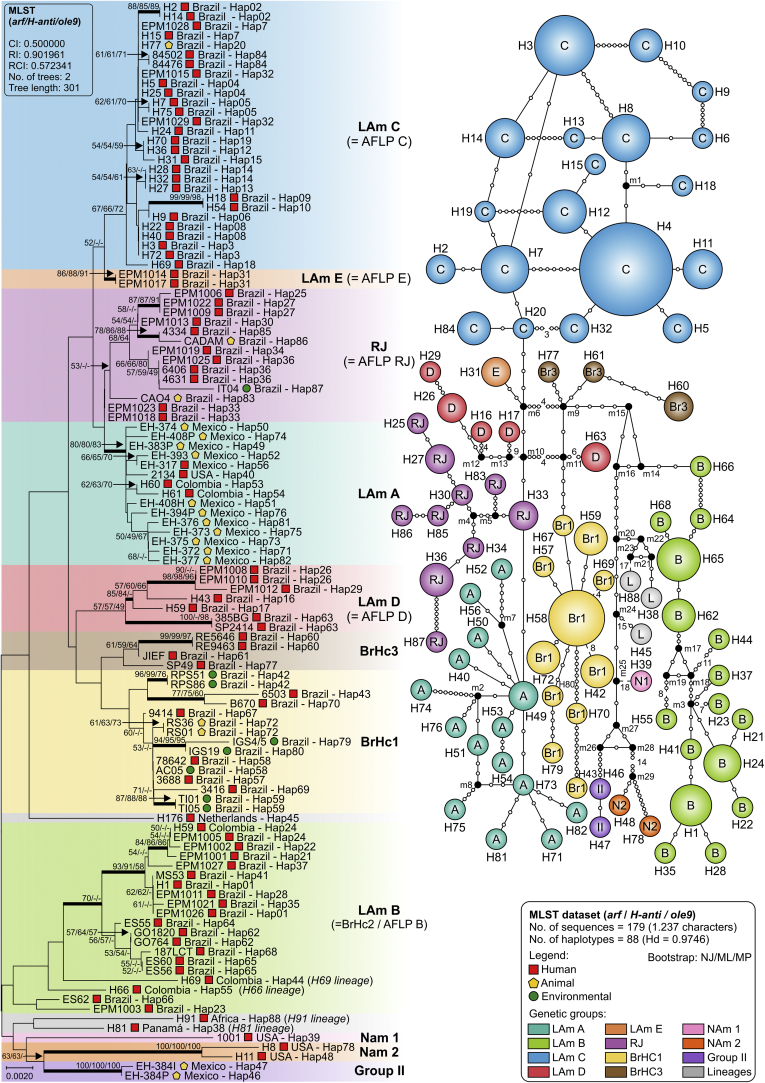
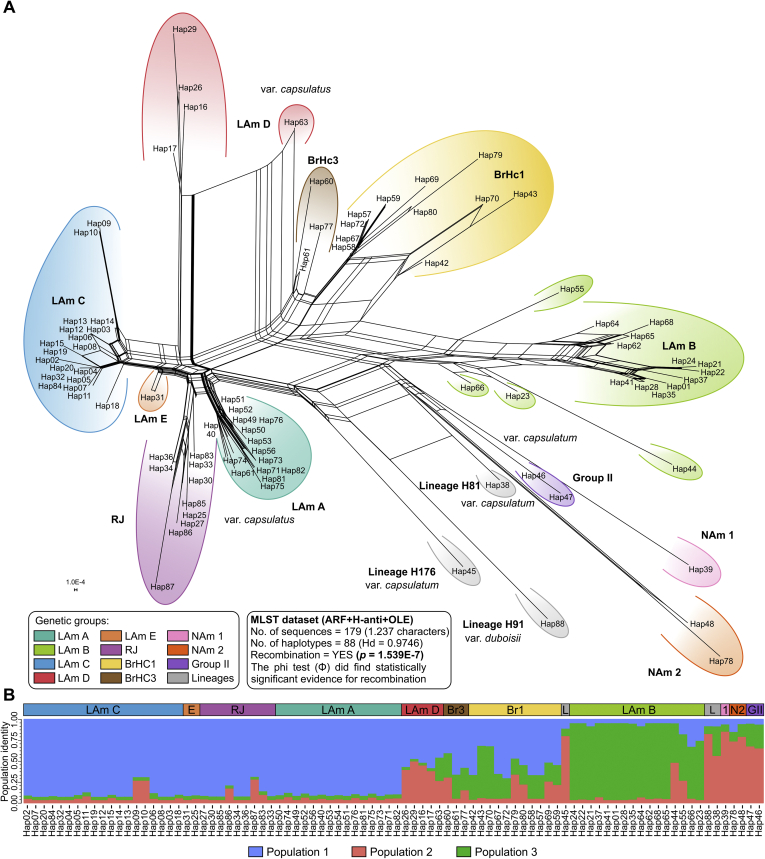
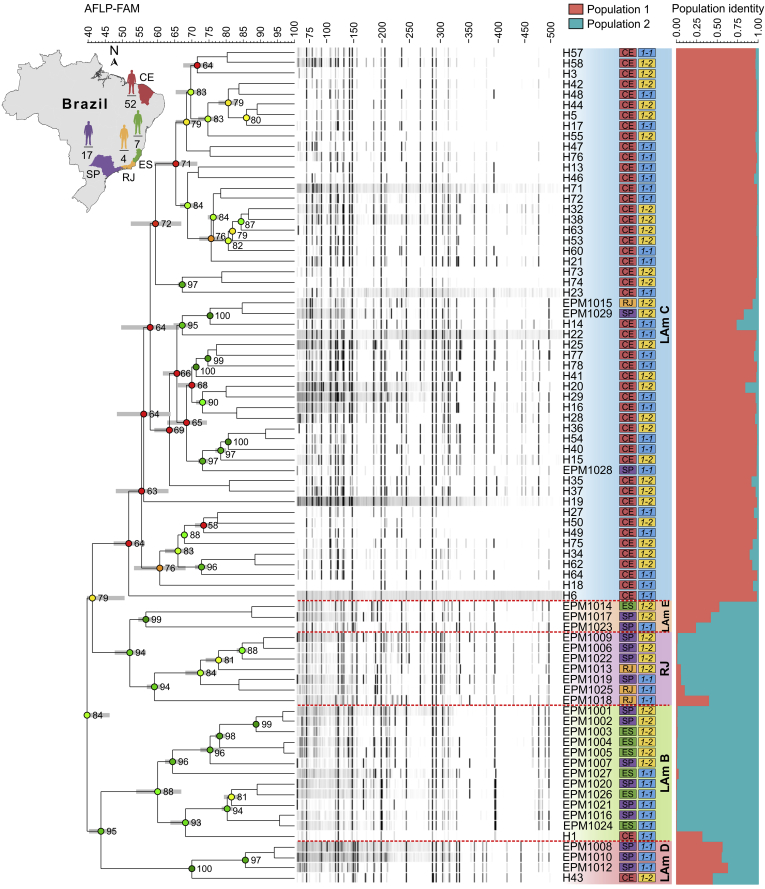
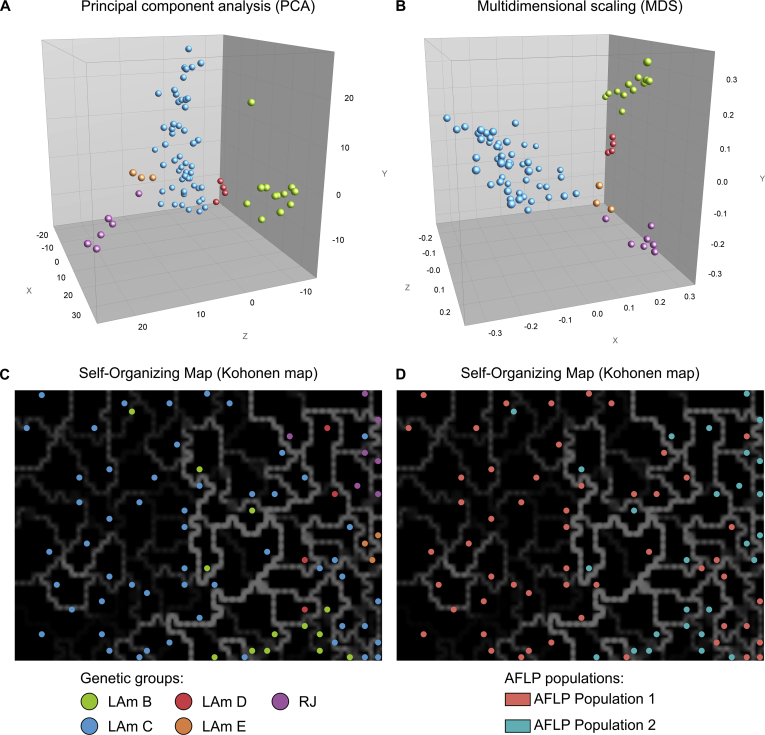
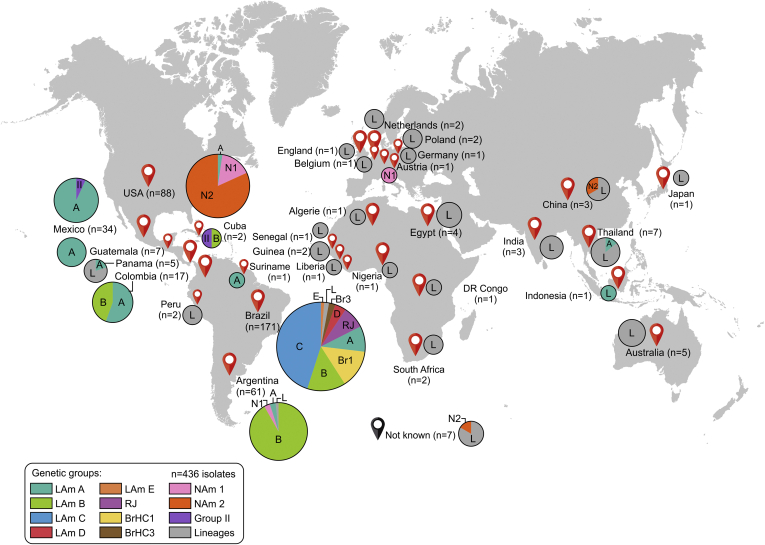
Histoplasmosis is a serious infectious disease in humans caused by Histoplasma spp. (Onygenales), whose natural reservoirs are thought to be soil enriched with bird and bat guano. The true global burden of histoplasmosis is underestimated and frequently the pulmonary manifestations are misdiagnosed as tuberculosis. Molecular data on epidemiology of Histoplasma are still scarce, even though there is increasing recognition of histoplasmosis in recent years in areas distant from the traditional endemic regions in the Americas. We used multi-locus sequence data from protein coding loci (ADP-ribosylation factor, H antigen precursor, and delta-9 fatty acid desaturase), DNA barcoding (ITS1/2+5.8s), AFLP markers and mating type analysis to determine the genetic diversity, population structure and recognise the existence of different phylogenetic species among 436 isolates of Histoplasma obtained globally. Our study describes new phylogenetic species and the molecular characteristics of Histoplasma lineages causing outbreaks with a high number of severe outcomes in Northeast Brazil between 2011 and 2015. Genetic diversity levels provide evidence for recombination, common ancestry and clustering of Brazilian isolates at different geographic scales with the emergence of LAm C, a new genotype assigned to a separate population cluster in Northeast Brazil that exhibited low diversity indicative of isolation. The global survey revealed that the high genetic variability among Brazilian isolates along with the presence of divergent cryptic species and/or genotypes may support the hypothesis of Brazil being the center of dispersion of Histoplasma in South America, possibly with the contribution of migratory hosts such as birds and bats. Outside Brazil, the predominant species depends on the region. We confirm that histoplasmosis has significantly broadened its area of occurrence, an important feature of emerging pathogens. From a practical point of view, our data point to the emergence of histoplasmosis caused by a plethora of genotypes, and will enable epidemiological analysis focused on understanding the processes that lead to histoplasmosis. Further, the description of this diversity opens avenues for comparative genomic studies, which will allow progress toward a consensus taxonomy, improve understanding of the presence of hybrids in natural populations of medically relevant fungi, test reproductive barriers and to explore the significance of this variation.

Keywords: Emerging pathogens; Epidemiology; Genetic diversity; Histoplasma capsulatum; Histoplasmosis; Population structure.


Figures

Fig. 1
Fig. 1
Molecular identification of Histoplasma capsulatum by conventional PCR. A. Successful amplification with specific primer sets and Histoplasma capsulatum isolate CEMM 05-2-035 (=H2) as a template. Lane 1, 100 bp DNA ladder (Fermentas, USA) for size determinations; Lane 2, Msp2F-Msp2R primer pair amplification (279 bp); Lane 3, 1281-1283220 primer pair amplification (PCR 220; 220 bp); Lane 4, 1281-1283230 primer pair amplification (PCR 230; 230 bp); Lane 5, negative control. Further information about isolates used and amplification success can be found in Table S1. B. Receiver operating characteristic (ROC) curves for primer pairs Msp2F-Msp2R (MSP2), 1281-1283220 (PCR 220) and 1281-1283230 (PCR 230) based on 104 specimens. Despite high genetic diversity across H. capsulatum clusters, primer pairs usually employed in diagnosis successfully identified the new genetic groups recognised in this study. In PCR220 and PCR230, lines are superimposed, indicating equivalent accuracy. The classification variable was a dichotomous variable that indicated the diagnosis (0 = negative, 1 = positive).
Fig. 2
Fig. 2
Phylogeny, haplotype and structure among Histoplasma capsulatum genotypes. A. Phylogenetic relationships, as inferred from neighbor joining analysis of the ITS sequences (ITS1+5.8S+ITS2; n = 215 OTU), covering the main haplotypes of H. capsulatum. Numbers above the tree branches are the bootstrap values for NJ, ML and MP methods. The branches with bootstrap support higher than 70 % are indicated in bold. B. Median-joining haplotype network of H. capsulatum isolates, covering all the ITS haplotypes found in this study. The size of the circumference is proportional to the haplotype frequency. The haplotypes are color coded according to the genetic group to which they were assigned. Mutational steps are represented by white dots. The black dots (median vectors) represent unsampled or extinct haplotypes in the population. C. Distribution patterns of H. capsulatum ITS sequences used in this study. Note that clade naming follows the original appearance of the isolates in the literature (Kasuga et al., 2003, Taylor et al., 2005, Muniz Mde et al., 2010). NJ, neighbor joining; ML, maximum likelihood; MP, maximum parsimony. Further information about isolate source and GenBank accession number can be found in Table S1.
Fig. 3
Fig. 3
Phylogeny, haplotype and structure among Histoplasma capsulatum genotypes. A. Phylogenetic relationships, as inferred from neighbor joining analysis of the ADP-ribosylation factor sequences (arf; n = 211 OTU), covering the main haplotypes of H. capsulatum. Numbers above the tree branches are the bootstrap values for NJ, ML and MP methods. The branches with bootstrap support higher than 70 % are indicated in bold. B. Median-joining haplotype network of H. capsulatum isolates, covering all the arf haplotypes found in this study. The size of the circumference is proportional to the haplotype frequency. The haplotypes are color coded according to the genetic group to which they were assigned. Mutational steps are represented by white dots. The black dots (median vectors) represent unsampled or extinct haplotypes in the population. C. Distribution patterns of H. capsulatum arf sequences used in this study. Note that clade naming follows the original appearance of the isolates in the literature (Kasuga et al., 2003, Taylor et al., 2005, Muniz Mde et al., 2010). NJ, neighbor joining; ML, maximum likelihood; MP, maximum parsimony. Further information about isolate source and GenBank accession number can be found in Table S1.
Fig. 4
Fig. 4
Phylogeny, haplotype and structure among Histoplasma capsulatum genotypes. A. Phylogenetic relationships, as inferred from neighbor joining analysis of the H antigen precursor sequences (H-anti; n = 188 OTU), covering the main haplotypes of H. capsulatum. Numbers above the tree branches are the bootstrap values for NJ, ML and MP methods. The branches with bootstrap support higher than 70 % are indicated in bold. B. Median-joining haplotype network of H. capsulatum isolates, covering all the H-anti haplotypes found in this study. The size of the circumference is proportional to the haplotype frequency. The haplotypes are color coded according to the genetic group to which they were assigned. Mutational steps are represented by white dots. The black dots (median vectors) represent unsampled or extinct haplotypes in the population. C. Distribution patterns of H. capsulatum H-anti sequences used in this study. Note that clade naming follows the original appearance of the isolates in the literature (Kasuga et al., 2003, Taylor et al., 2005, Muniz Mde et al., 2010). NJ, neighbor joining; ML, maximum likelihood; MP, maximum parsimony. Further information about isolate source and GenBank accession number can be found in Table S1.
Fig. 5
Fig. 5
Phylogeny, haplotype and structure among Histoplasma capsulatum genotypes. A. Phylogenetic relationships, as inferred from neighbor joining analysis of the delta-9 fatty acid desaturase sequences (ole; n = 192 OTU), covering the main haplotypes of H. capsulatum. Numbers above the tree branches are the bootstrap values for NJ, ML and MP methods. The branches with bootstrap support higher than 70 % are indicated in bold. B. Median-joining haplotype network of H. capsulatum isolates, covering all the ole haplotypes found in this study. The size of the circumference is proportional to the haplotype frequency. The haplotypes are color coded according to the genetic group to which they were assigned. Mutational steps are represented by white dots. The black dots (median vectors) represent unsampled or extinct haplotypes in the population. C. Distribution patterns of H. capsulatum ole sequences used in this study. Note that clade naming follows the original appearance of the isolates in the literature (Kasuga et al., 2003, Taylor et al., 2005, Muniz Mde et al., 2010). NJ, neighbor joining; ML, maximum likelihood; MP, maximum parsimony. Further information about isolate source and GenBank accession number can be found in Table S1.
Fig. 6
Fig. 6
Phylogeny and haplotype among Histoplasma capsulatum genotypes. A. Phylogenetic relationships, as inferred from neighbor joining analysis of concatenated ADP-ribosylation factor, H-antigen precursor and delta-9 fatty acid desaturase sequences (n = 179 OTU), covering the main genetic groups of H. capsulatum. Numbers above the tree branches are the bootstrap values for NJ, ML and MP methods. The branches with bootstrap support higher than 70 % are indicated in bold. B. Median-joining haplotype network of H. capsulatum isolates. The size of the circumference is proportional to the haplotype frequency. The haplotypes are color coded according to the genetic group to which they were assigned. Mutational steps are represented by white dots. The black dots (median vectors) represent unsampled or extinct haplotypes in the population. Note that clade naming follows the original appearance of the isolates in the literature (Kasuga et al., 2003, Taylor et al., 2005, Muniz Mde et al., 2010). ML, maximum likelihood; MP, maximum parsimony; NJ, neighbor joining. Further information about isolate source and GenBank accession number can be found in Table S1.
Fig. 7
Fig. 7
A. The neighbor network using the uncorrected p-distance among a core set of Histoplasma genotypes based on 1 237 nucleotide positions derived from the ADP-ribosylation factor, H-antigen precursor and delta-9 fatty acid desaturase loci (n = 179 OTU). Sets of parallel edges (reticulations) in the networks indicate locations of incongruence and potential recombination. Recombination within H. capsulatum genotypes was also supported by the PHI-test (Φ) (P = 1.539E-7). B. Bayesian cluster analyses with STRUCTURE of 88 H. capsulatum haplotypes based on MLSA dataset. Each vertical bar represents one individual MLSA haplotype and its probabilities of being assigned to clusters. Note that clade naming follows the original appearance of the isolates in the literature (Kasuga et al., 2003, Taylor et al., 2005, Muniz Mde et al., 2010). Further information about isolate source can be found in Table S1.
Fig. 8
Fig. 8
The UPGMA dendrogram based on amplified fragment length polymorphism (AFLP) fingerprint, generated with a total of four selective bases (EcoRI-AC/MseI-CT) for 80 Histoplasma capsulatum originated from Brazil. AFLP results show a significant grouping according to geographical origin (Northeast and Southeast Brazil) and MLSA clusters, revealing five differentiated AFLP groups (LAm B, C, D, E and RJ). The dendrogram shows cophenetic correlation values (circles) for a given clade and its standard deviation (gray bar). Patterns of mating-type idiomorphs’ distribution across AFLP groups are shown. Fragments between 50 and 500 bp are shown. For pairwise, genetic distances calculation, Dice coefficient was used. The cophenetic correlation of the dendrogram is 0.84. Bayesian cluster analyses with STRUCTURE (k = 2) of 80 H. capsulatum samples based on AFLP. Each vertical bar represents one individual and its probabilities of being assigned to clusters. Further information about isolate source can be found in Table S1. CE, Ceará (Northeast); ES, Espírito Santo; RJ, Rio de Janeiro; SP, São Paulo (Southeast); 1-1, MAT1-1 mating type idiomorph; 1-2, MAT1-2 mating type idiomorph. Note that clade naming follows the original appearance of the isolates in the literature (Kasuga et al., 2003, Taylor et al., 2005, Muniz Mde et al., 2010).
Fig. 9
Fig. 9
The distribution of the studied AFLP fingerprints (EcoRI-AC/MseI-CT) of 80 Histoplasma capsulatum originated from Brazil, using principal component analysis (PCA), multi-dimensional scaling (MDS) and self-organizing mapping (SOM). The dimensioning analyses were performed using BioNumerics v7.6 to determine the consistency of the differentiation of the populations defined by the cluster analysis. A and B show the PCA and MDS of AFLP data with the first three principal components describing the greatest variation plotted on the X (15.4 %), Y (12 %), and Z (8.6 %) axes. The SOM revealed that Northeast isolates (n = 50; Ceará) are embedded in areas of high similarity mostly bounded by thin faint white/gray lines according to the genetic group (C) or AFLP population (D), confirming the low genetic diversity in MLSA data. The lighter and thicker the line (white, gray) between black blocks, the more distant are those samples contained in the black block, from the adjacent black block. Isolates were color coded according to their genetic groups (A, B and C) or AFLP population (D).
Fig. 10
Fig. 10
Global distribution patterns of 436 Histoplasma spp. isolates based on DNA sequencing. The sizes of circumferences are roughly proportional to the numbers of strains included. Codes reported within the pies denote genetic groups. Further information about isolate source and GenBank accession number can be found in Table S1.

References

    1. Adenis A.A., Valdes A., Cropet C. Burden of HIV-associated histoplasmosis compared with tuberculosis in Latin America: a modelling study. Lancet Infectious Diseases. 2018;18:1150–1159. - PMC - PubMed
    1. Almeida M.A., Almeida-Silva F., Guimaraes A.J. The occurrence of histoplasmosis in Brazil: A systematic review. International Journal of Infectious Diseases. 2019;86:147–156. - PubMed
    1. Altman D.G. Chapman and Hall; London: 1991. Practical statistics for medical research; p. 624.
    1. Antinori S. Histoplasma capsulatum: more widespread than previously thought. American Journal of Tropical Medicine and Hygiene. 2014;90:982–983. - PMC - PubMed
    1. Ashbee H.R., Evans E.G.V., Viviani M.A. Histoplasmosis in Europe: report on an epidemiological survey from the European Confederation of Medical Mycology Working Group. Medical Mycology. 2008;46:57–65. - PubMed

LinkOut - more resources