. 2020 Dec 1:18:3969-3976.
doi: 10.1016/j.csbj.2020.11.038. eCollection 2020.

Impact of crosslink heterogeneity on extracellular matrix mechanics and remodeling

Affiliations

Impact of crosslink heterogeneity on extracellular matrix mechanics and remodeling

Michael Mak. Comput Struct Biotechnol J. .

Abstract

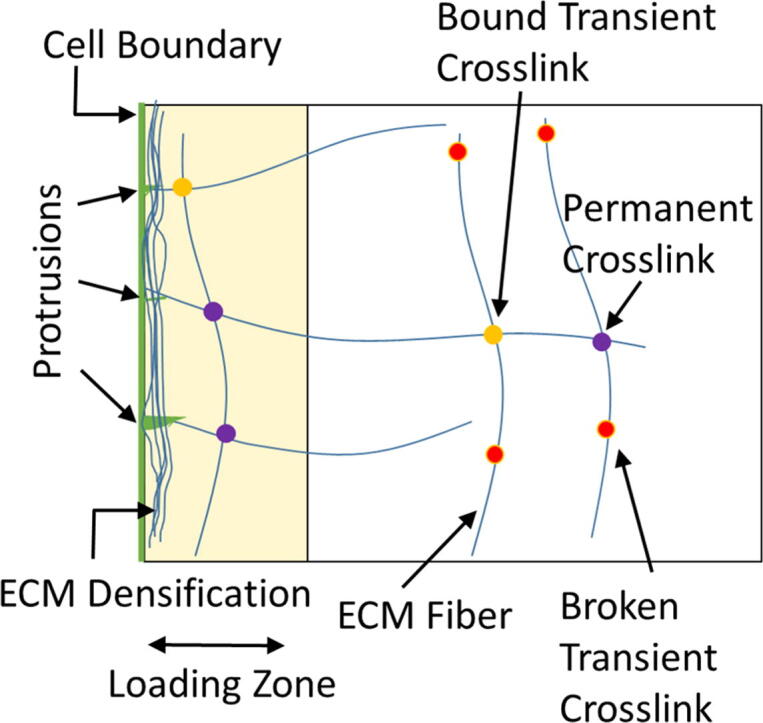
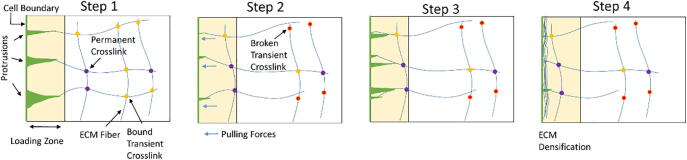
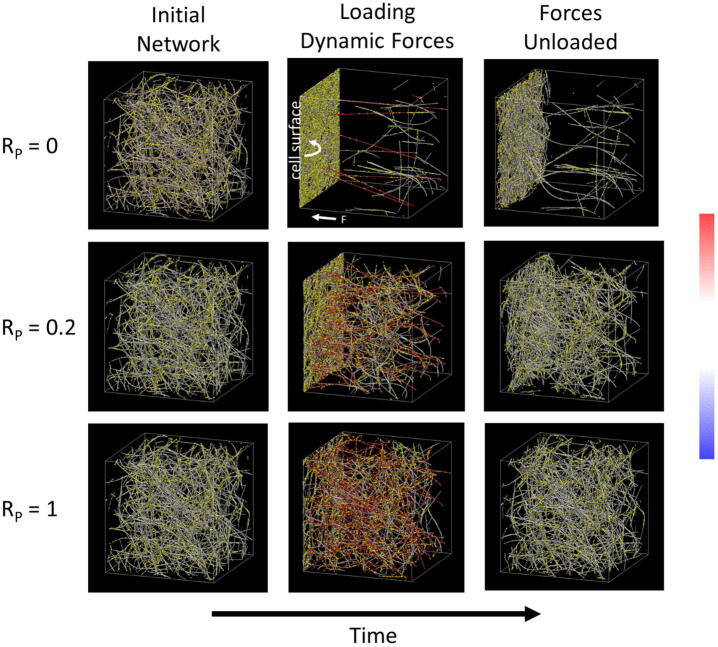
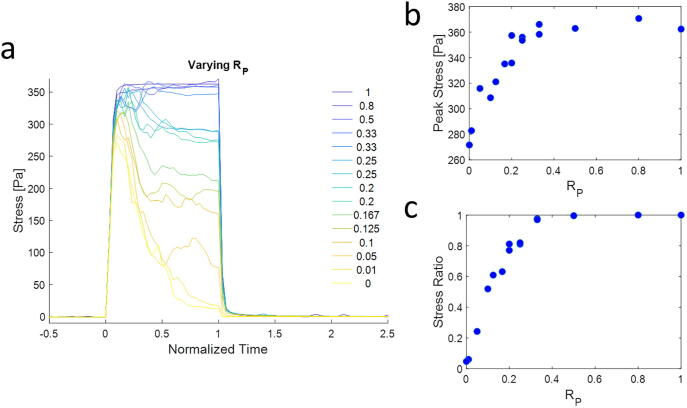
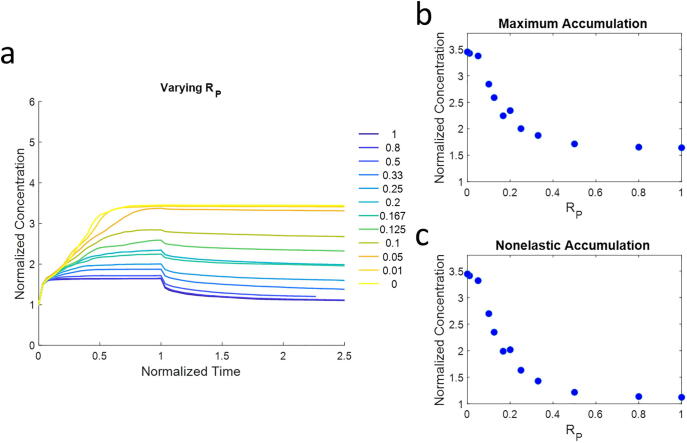
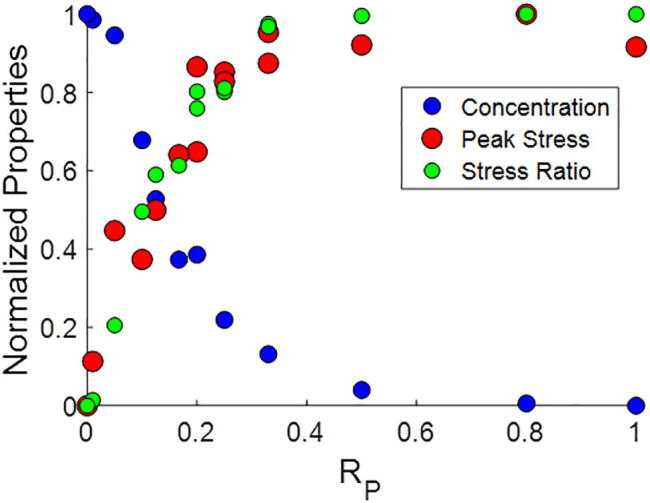
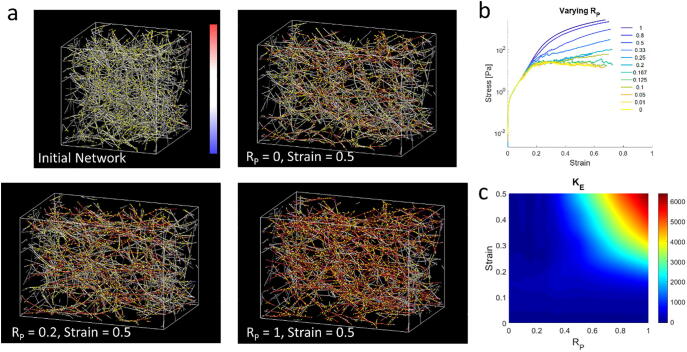
Mechanical interactions between cells and the extracellular matrix (ECM) lead to the formation of biophysical cues, notably in the form of cell-generated tension, stiffness, and concentration profiles in the ECM. Fibrillar ECMs have nonlinear stiffnesses, linked to the reorientation of fibers under stress and strain, and nonelastic properties, resulting from the force-induced unbinding of transient bonds (crosslinks) that interconnect fibers. Mechanical forces generated by cells can lead to local ECM stiffening and densification. Cell tension is also propagated through the ECM network. The underlying factors that regulate the relative emergence of these signals are not well understood. Here, through computational simulations of 3D ECM fiber networks, we show that the composition of ECM crosslinks is a key determinant of the degree of densification and stiffening that can be achieved by cell-generated forces. This also regulates the sustainability of tensions propagated through the ECM. In particular, highly transient force-sensitive crosslinks promote nonelastic densification and rapid tension relaxation, whereas permanent crosslinks promote nonlinear stiffening and stable tension profiles. A heterogeneous population of crosslinks with different unbinding kinetics enables ECMs to exhibit accumulation, tension propagation, and stiffening simultaneously in response to mechanical interactions with cells.

Keywords: Cell-matrix interactions; Computational modeling; Crosslinking; Extracellular matrix; Mechanobiology.


Conflict of interest statement

The authors declare that they have no known competing financial interests or personal relationships that could have appeared to influence the work reported in this paper.

Figures

None
Graphical abstract
Fig. 1
Fig. 1
Schematic of dynamic force loading in an ECM network with crosslink heterogeneity. Local pulling forces, mimicking dynamic cell protrusion-contraction activity, are generated on fiber segments that enter the cell vicinity, i.e. the loading zone, leading to gradual ECM densification. Crosslinks are either transient (force-sensitive) or permanent (force-insensitive). As transient crosslinks unbind, ECM accumulation and network reorganization become nonelastic. Permanent crosslinks do not exhibit force-induced unbinding.
Fig. 2
Fig. 2
Simulation examples. An initial 3D uniform fiber network is generated without any applied loading forces. Dynamic pulling forces are then applied to fiber segments that are close to the cell surface (within 2 µm of the left surface). After a loading period, applied forces are stopped to allow for network relaxation. ECMs with different RP’s (ratio of permanent crosslinks to total crosslinks) exhibit different amounts of remodeling and nonelastic accumulation. The total number of crosslinks is constant. ECM fibers are color-coded by tension based on the color bar at the right (from −300 to + 300 pN). Yellow points are crosslinks. The left and right surfaces are hard boundaries (fibers cannot go through them). Fibers segments that are at the right surface are bound to it. The other four boundaries are periodic. The simulation domain is 20 × 20 × 20 µm3. (For interpretation of the references to color in this figure legend, the reader is referred to the web version of this article.)
Fig. 3
Fig. 3
Stress profiles. a) The stress in the network, calculated by summing the normal tensions of components crossing a plane parallel to the cell surface and then dividing by the area of the surface (20 × 20 µm2), evolves over time for networks with different RP’s. Dynamic forces are applied from normalized time of 0 to 1, followed by cessation of applied forces. High RP leads to stable network stresses, whereas low RP leads to stress profiles that decay over time. b) The peak stress in the network increases with increasing RP up to a plateau. c) The stress ratio is the ratio of the stress at t = 1 (right before applied forces are stopped) and the peak stress. The stress ratio also increases with RP up to a plateau.
Fig. 4
Fig. 4
ECM accumulation profiles. a) The ECM concentration near the cell surface (within 6 µm) is measured over time. The concentration is normalized to the concentration before force loading. Dynamic forces are loaded at the normalized time from 0 to 1, and applied forces are stopped afterwards to allow for relaxation. High RP leads to low ECM accumulation that reverts, whereas low RP leads to high ECM accumulation that does not revert. b) The peak concentration is measured as a function of RP. This includes both elastic and nonelastic ECM accumulation. c) The nonelastic accumulation (calculated at normalized time = 2, when most simulations have reached a relatively stable state) is measured as a function of RP. At this point, most of the elastic strains have been relaxed.
Fig. 5
Fig. 5
Concentration and stress vs. RP. We overlay the accumulated ECM concentration, peak stress, and stress ratio vs. RP curves, demonstrating nonlinearity in the dependence on RP. There is a range of RP’s that supports both ECM accumulation and sustaining high stresses. Here, for the purpose of comparing, the curves are all renormalized to range between 0 and 1.
Fig. 6
Fig. 6
Stress and stiffness profiles at varying strain. a) Extensional strain is applied to networks of varying RP, as shown by simulation snapshots. Fibers are color-coded based on tension according to the color bar, which ranges from −300 to 300pN. Yellow spheres are crosslinks. The initial domain size is 20x20x20µm3. b) Extensional stress vs. strain curves are measured for networks with different RP. Networks with low RP exhibit stress decay at high strains. c) Heat map of KE (in Pa) vs. strain and RP shows increased strain-stiffening capacity for networks with high RP. Networks with low RP undergo failure at large strains, and their stiffness is diminished. (For interpretation of the references to color in this figure legend, the reader is referred to the web version of this article.)

References

    1. van Oosten A.S.G., Chen X., Chin L., Cruz K., Patteson A.E., Pogoda K. Emergence of tissue-like mechanics from fibrous networks confined by close-packed cells. Nature. 2019;573:96–101. doi: 10.1038/s41586-019-1516-5. - DOI - PubMed
    1. Storm C., Pastore J.J., MacKintosh F.C., Lubensky T.C., Janmey P.A. Nonlinear elasticity in biological gels. Nature. 2005;435:191–194. doi: 10.1038/nature03521. - DOI - PubMed
    1. Munster S., Jawerth L.M., Leslie B.A., Weitz J.I., Fabry B., Weitz D.A. Strain history dependence of the nonlinear stress response of fibrin and collagen networks. Proc Natl Acad Sci. 2013;110:12197–12202. doi: 10.1073/pnas.1222787110. - DOI - PMC - PubMed
    1. Roeder B.A., Kokini K., Sturgis J.E., Robinson J.P., Voytik-Harbin S.L. Tensile Mechanical Properties of Three-Dimensional Type I Collagen Extracellular Matrices With Varied Microstructure. J Biomech Eng. 2002;124:214–222. doi: 10.1115/1.1449904. - DOI - PubMed
    1. Han Y.L., Ronceray P., Xu G., Malandrino A., Kamm R.D., Lenz M. Cell contraction induces long-ranged stress stiffening in the extracellular matrix. Proc Natl Acad Sci USA. 2018;115:4075. doi: 10.1073/pnas.1722619115. - DOI - PMC - PubMed

LinkOut - more resources