Review
. 2020 Dec;32(4):161-169.
doi: 10.5371/hp.2020.32.4.161. Epub 2020 Dec 3.

Drawing Guideline for 'Hip and Pelvis': Plot with Error Bar

Affiliations
Review

Drawing Guideline for 'Hip and Pelvis': Plot with Error Bar

Jeehyoung Kim et al. Hip Pelvis. 2020 Dec.

Abstract

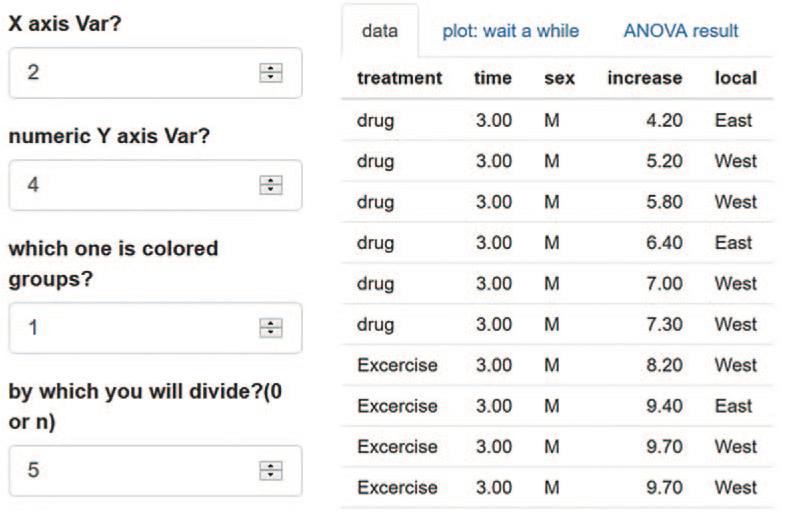
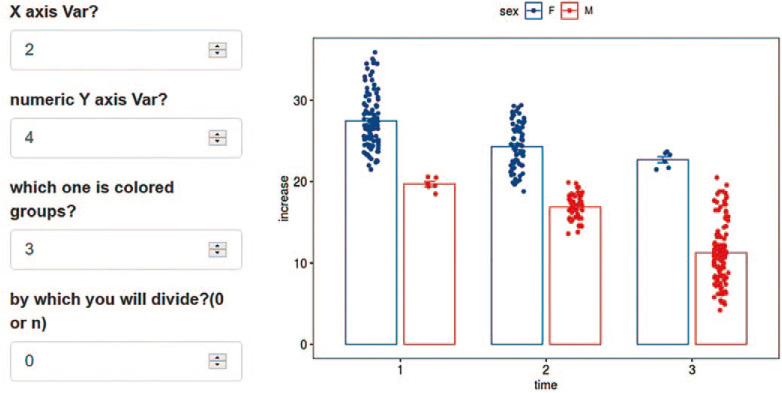
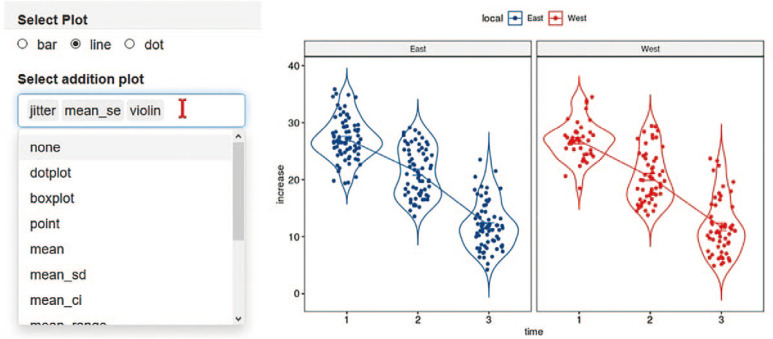
The appropriate plots effectively convey the author's conclusions to the readers. 'Hip and Pelvis' will provide a series of special articles to show how to make consistent and excellent plots easier. In this article, we will cover plots with error bars.

Keywords: Error bar; Plot.


Conflict of interest statement

CONFLICT OF INTEREST: The authors declare that there is no potential conflict of interest relevant to this article.

Figures

Fig. 1
Fig. 1. Initial feature of the first tool and example data by line plot.
Fig. 2
Fig. 2. Setting position dodged to 0.
Fig. 3
Fig. 3. Divided groups. Theme and color palette can be changed according to need.
Fig. 4
Fig. 4. Applying bar plot.
Fig. 5
Fig. 5. Applying flip setting.
Fig. 6
Fig. 6. The plot using the second tool.
Fig. 7
Fig. 7. Selection of example data and default variables.
Fig. 8
Fig. 8. The simplest form of the plot.
Fig. 9
Fig. 9. Example of data having the 3rd variable.
Fig. 10
Fig. 10. Another example of data having the 3rd and 4th variables.
Fig. 11
Fig. 11. Straightforward plot after removing jitter.
Fig. 12
Fig. 12. Plot using line instead of bar.
Fig. 13
Fig. 13. Result of adding box plot to jitter plot.
Fig. 14
Fig. 14. Adding violin plot to jitter plot instead of boxplot.
Fig. 15
Fig. 15. Plot using dot instead of line.
Fig. 16
Fig. 16. Examples of various combination of color.
Fig. 17
Fig. 17. Method for uploading data and downloading plot.

Similar articles

LinkOut - more resources