. 2020 Nov 25;16(1):1-13.
doi: 10.1515/med-2021-0004. eCollection 2021.

Identification of ZG16B as a prognostic biomarker in breast cancer

Affiliations

Identification of ZG16B as a prognostic biomarker in breast cancer

Haotian Lu et al. Open Med (Wars). .

Abstract

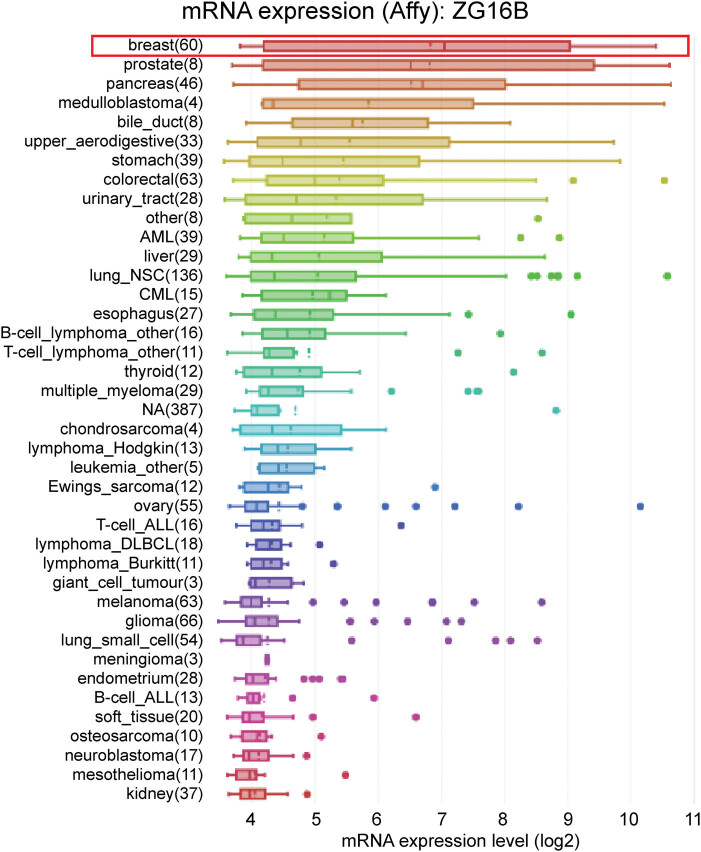
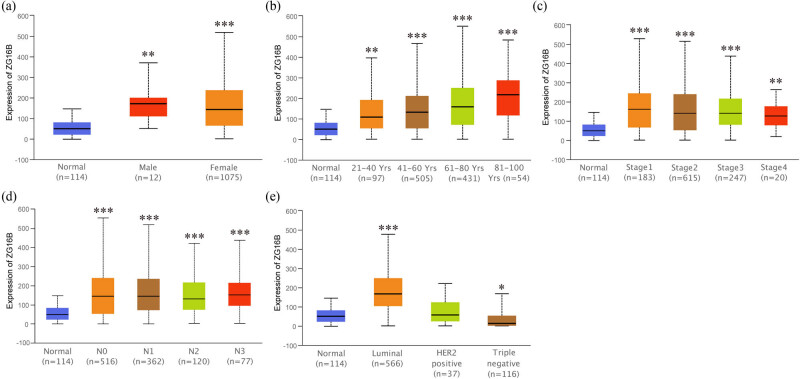
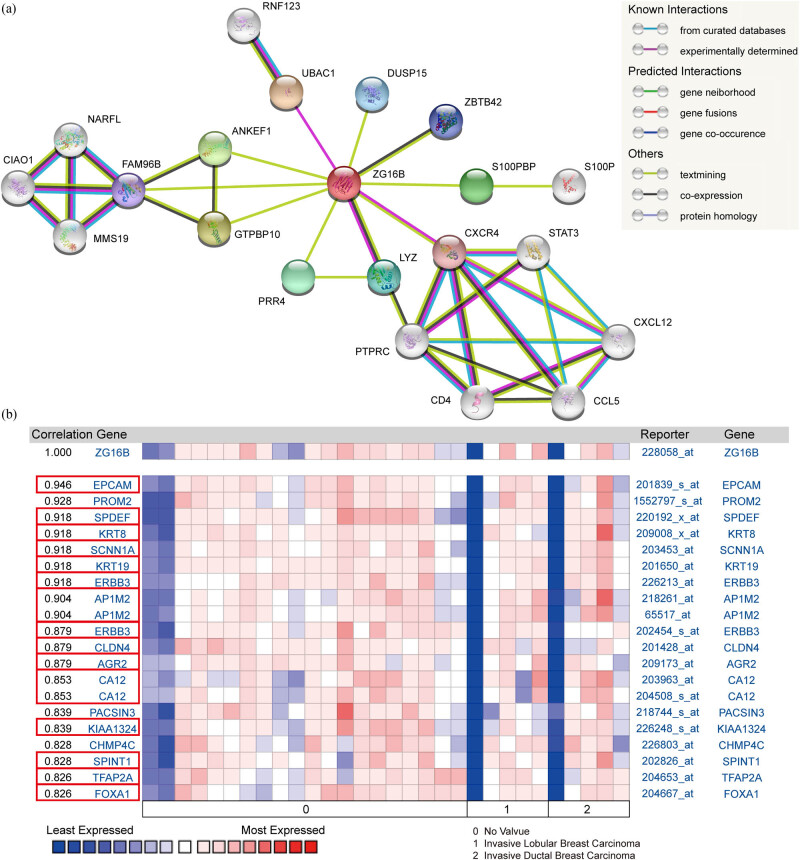
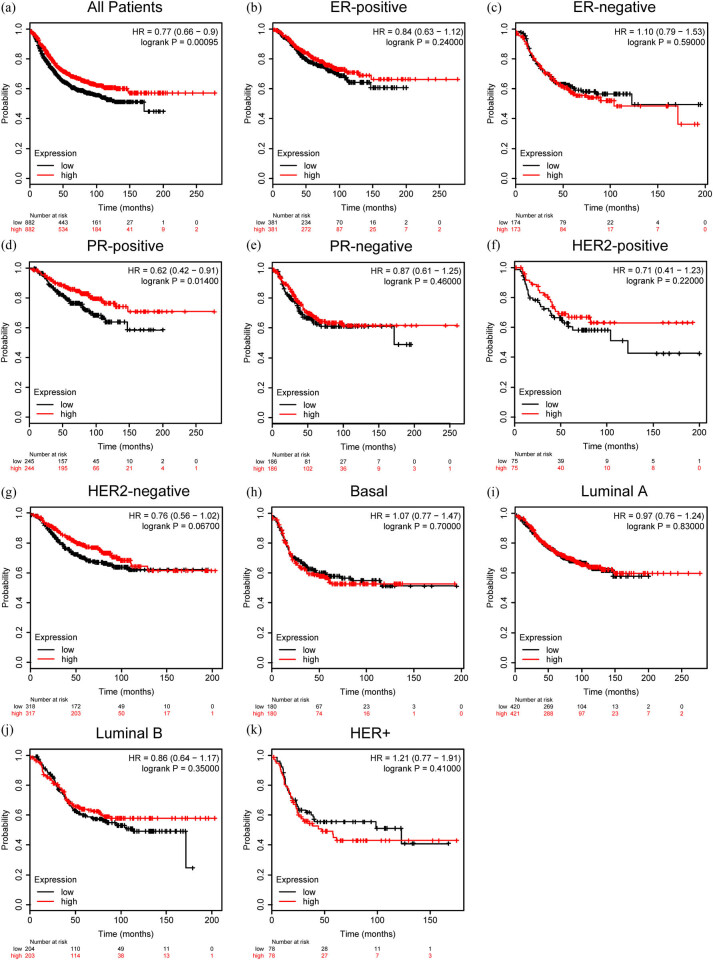
Zymogen granule protein 16B (ZG16B) has been identified in various cancers, while so far the association between ZG16B and breast cancer hasn't been explored. Our aim is to confirm whether it can serve as a prognostic biomarker in breast cancer. In this study, Oncomine, Cancer Cell Line Encyclopedia (CCLE), Ualcan, and STRING database analyses were conducted to detect the expression level of ZG16B in breast cancer with different types. Kaplan-Meier plotter was used to analyze the prognosis of patients with high or low expression of ZG16B. We found that ZG16B was significantly upregulated in breast cancer. Moreover, ZG16B was closely associated with foregone biomarkers and crucial factors in breast cancer. In the survival analysis, high expression of ZG16B represents a favorable prognosis in patients. Our work demonstrates the latent capacity of ZG16B to be a biomarker for prognosis of breast cancer.

Keywords: ZG16B; biomarker; breast cancer; database; prognosis.


Conflict of interest statement

Conflict of interest: The authors declare that there are no conflicts of interest in this work.

Figures

Figure 1
Figure 1
Analysis of ZG16A and ZG16B mRNA expression in different types of cancer (Oncomine). (a) The mRNA expression pattern of ZG16A and ZG16B in various cancers. The number in the grid represented the number of datasets that meet the fixed threshold (p < 1 × 10⁻⁴, fold change >2). The color of the grid represented if the gene expressed higher (red) or lower (blue) (cancer vs. normal). The color depth of the grid depended on the best gene rank percentiles in all genes detected in each analysis. Box plots derived from gene expression data in Oncomine comparing the mRNA expression of ZG16A (b) and ZG16B (c) in normal and breast cancer tissues.
Figure 2
Figure 2
Analysis of ZG16B mRNA expression in cancer cells. ZG16B mRNA expression levels in 40 types of cancer cell lines were measured by Affymetrix gene chips and arranged from the highest to the lowest (CCLE analysis). ZG16B mRNA expression level was the first highest in breast cancer cells among all cancers.
Figure 3
Figure 3
The pooled meta-analysis of gene expression profiling for ZG16B gene across 18 analysis. The color of the grid represented if the gene expressed higher (red) or lower (blue). The color depth of the grid depended on the median gene rank percentiles. The rank of ZG16B was the median rank across each of the analyses. The p-value of ZG16B was for the median-ranked analysis.
Figure 4
Figure 4
Analysis of ZG16B expression patterns in breast cancer patients with different clinical-pathologic features. Ualcan analysis showed the mRNA expression level of ZG16B in breast cancer patients with distinct gender (a), age (b), cancer stages (c), node metastasis status (d), and molecular subtypes (e). Asterisks were marked to show the significance of each breast cancer group compared with normal group (*p < 0.05, **p < 0.01, ***p < 0.001).
Figure 5
Figure 5
Analysis of ZG16B promoter methylation status in breast cancer patients with different clinical-pathologic features. Ualcan analysis showed the methylation level of ZG16B promoter in primary tumor of breast cancer (a) and in breast cancer patients with distinct gender (b), age (c), and cancer stages (d). Asterisks were marked to show the significance of each group compared with normal group (*p < 0.05, **p < 0.01, ***p < 0.001).
Figure 6
Figure 6
Protein interactions and gene co-expression analysis of ZG16B. (a) The protein interaction network of ZG16B was drawn by STRING analysis. The colored nodes in the network represented ZG16B and its first stage of interactors, and the white nodes represented the second stage of interactors. The physical or functional relations between these proteins are interpreted in the conventional signs. (b) The gene co-expression analysis of ZG16B in Turashvili’s work was conducted by Oncomine. The co-expression genes of ZG16B in breast cancer and their coefficients were marked by red rectangles.
Figure 7
Figure 7
Prognostic value of ZG16B expression in different subtypes of breast cancer. The RFS curves were drawn by Kaplan–Meier plotter in all breast cancer patients (a) and different subtypes of breast cancer, ER-positive (b), ER-negative (c), PR-positive (d), PR-negative (e), HER2-positive (f), HER2-negative (g), Basal (h), Luminal A (i), Luminal (j), and HER2+ (k).

References

    1. DeSantis CE, Ma J, Sauer AG, Newman LA, Jemal A. Breast cancer statistics, 2017, racial disparity in mortality by state. Ca-a Cancer J Clinic. 2017;67(6):439–48. - PubMed
    2. DeSantis CE, Ma J, Sauer AG, Newman LA, Jemal A. Breast cancer statistics, 2017, racial disparity in mortality by state. Ca-a Cancer J Clinic. 2017;67(6):439–48. - PubMed
    1. Chen W, Zheng R, Baade PD, Zhang S, Zeng H, Bray F, et al. Cancer Statistics in China, 2015. Ca-a Cancer J Clinic. 2016;66(2):115–32. - PubMed
    2. Chen W, Zheng R, Baade PD, Zhang S, Zeng H, Bray F. et al. Cancer Statistics in China, 2015. Ca-a Cancer J Clinic. 2016;66(2):115–32. - PubMed
    1. Siegel RL, Miller KD, Jemal A. Cancer Statistics, 2016. Ca-a Cancer J Clinic. 2016;66(1):7–30. - PubMed
    2. Siegel RL, Miller KD, Jemal A.. Cancer Statistics, 2016. Ca-a Cancer J Clinic. 2016;66(1):7–30. - PubMed
    1. Liu Y, Ao X, Jia Z, Bai XY, Xu Z, Hu G, et al. FOXK2 transcription factor suppresses ERalpha-positive breast cancer cell growth through down-regulating the stability of ERalpha via mechanism involving BRCA1/BARD1. Sci Rep. 2015;5:8796. - PMC - PubMed
    2. Liu Y, Ao X, Jia Z, Bai XY, Xu Z, Hu G. et al. FOXK2 transcription factor suppresses ERalpha-positive breast cancer cell growth through down-regulating the stability of ERalpha via mechanism involving BRCA1/BARD1. Sci Rep. 2015;5:8796. - PMC - PubMed
    1. Perou CM, Sorlie T, Eisen MB, van de Rijn M, Jeffrey SS, Rees CA, et al. Molecular portraits of human breast tumours. Nature. 2000;406(6797):747–52. - PubMed
    2. Perou CM, Sorlie T, Eisen MB, van de Rijn M, Jeffrey SS, Rees CA. et al. Molecular portraits of human breast tumours. Nature. 2000;406(6797):747–52. - PubMed

LinkOut - more resources