. 2021 Apr;37(4):268-275.
doi: 10.1002/kjm2.12331. Epub 2020 Dec 17.

CASC2 inhibits the growth, migration, and invasion of thyroid cancer cells through sponging miR-18a-5p/FIH1 axis

Affiliations

CASC2 inhibits the growth, migration, and invasion of thyroid cancer cells through sponging miR-18a-5p/FIH1 axis

Qi-Yu Liu et al. Kaohsiung J Med Sci. 2021 Apr.

Abstract

Long noncoding RNA (lncRNA) Cancer Susceptibility 2 (CASC2) has been proved to contribute to the development of cancers. However, the mechanism behind the action of CASC2 in thyroid cancer is not quite clear. We demonstrated that CASC2 was downregulated in thyroid cancer. We noted that CASC2 overexpression restrained the growth, migration, and invasion of thyroid cancer cells, whereas CASC2 depletion caused opposite trends. Bioinformatics analysis predicted that hypoxia inducible factor 1 subunit alpha inhibitor (FIH-1) was potentially targeted by miR-18a-5p, which was confirmed by luciferase reporter assay. Upregulation of FIH-1 abrogated the promotive effect of miR-18a-5p on the growth and invasion of thyroid cancer cells. In addition, CASC2 serves as a competing endogenous RNA (ceRNA) and a ''sponge'' for miR-18a-5p, thereby regulating the expression of FIH-1. These data elucidated the CASC2/miR-18a-5p ceRNA network in thyroid cancer pathogenesis.

Keywords: CASC2; invasion; proliferation; thyroid cancer.


Figures

FIGURE 1
FIGURE 1
Decreasing levels of CASC2 expression in thyroid cancer. (A) In the GEPIA dataset, CASC2 was downregulated in thyroid cancer compared to normal samples. * P < 0.05 compared with normal. (B) Results from qRT‐PCR demonstrating CASC2 expression levels of thyroid cancer cell lines (SW1736, BHT101, TPC‐1, and B‐CPAP) and normal thyroid cell line, HT‐ori3. ** P < 0.01 compared with HT‐ori3. (C) qRT‐PCR analyses of CASC2 expression level following treatment TPC‐1 cells with si‐CASC2 and treatment B‐CPAP cells with pCDNA‐CASC2 vector. (D) CCK‐8 assay was performed to determine the proliferation of si‐CASC2‐transfected TPC‐1 cells or pCDNA‐CASC2‐transfected B‐CPAP cells. (E) Colony‐forming growth assay was performed to determine the proliferation of si‐CASC2 transfected TPC‐1 cells and pCDNA‐CASC2‐transfected B‐CPAP cells. ** P < 0.01 compared with control
FIGURE 2
FIGURE 2
The effects of CASC2 on regulating the cell migration and invasion in thyroid cancer cell lines. TPC‐1 cells were transfected with si‐CASC2, and B‐CPAP cells were transfected with pCDNA‐CASC2. (A) Transwell assay was performed to investigate changes in B‐CPAP cells migration and invasiveness. (B) Transwell assay was performed to investigate changes in TPC‐1 cells migration and invason. Scale bars = 100 μm. ** P < 0.01 compared with control
FIGURE 3
FIGURE 3
CASC2 downregulated the miR‐18a‐5p/FIH‐1 axis. (A) Online bioinformatics tool StarBase was used to screen the candidate downstream miRNAs of CASC2. (B) Luciferase activity in HEK‐293T cells cotransfected with a luciferase reporter containing CASC2 and miR‐18a‐5p, miR‐18b‐5p, or miR‐4735‐3p. (C) qRT‐PCR was used to detect the expression level of miR‐18a‐5p in thyroid cancer cell lines and normal thyroid cell line, HT‐ori3. ** P < 0.01 compared with HT‐ori3. (D) Luciferase activity in HEK‐293T cells cotransfected with a luciferase reporter containing CASC2‐wt or CASC2‐mut and miR‐18a‐5p. (E) The expression of miR‐18a‐5p in si‐CASC2‐transfected TPC‐1 cells or pCDNA‐CASC2‐transfected B‐CPAP cells. (F) TargteScan database predicted FIH‐1 was as a candidate downstream gene of miR‐18a‐5p. (G) Luciferase activity in HEK‐293 T cells cotransfected with a luciferase reporter containing FIH‐1‐wt or FIH‐1‐mut and miR‐18a‐5p. ** P < 0.01 compared with miR‐NC. (H) The expression of FIH‐1 in si‐CASC2 transfected TPC‐1 or pCDNA‐CASC2‐transfected B‐CPAP cells. (I) The correlation analysis from GEPIA between expression of CASC2 mRNA and FIH‐1 mRNA in thyroid cancer
FIGURE 4
FIGURE 4
The effects of miR‐18a‐5p/FIH‐1 axis on regulating the cell growth, migration, and invasion in thyroid cancer cell lines. (A) qRT‐PCR analyses of miR‐18a‐5p expression level following treatment TPC‐1 cells with miR‐18a‐5p mimics. (B) Colony‐forming growth assay was performed to determine the proliferation of TPC‐1 cells. (C) Transwell assay was performed to investigate changes in TPC‐1 cell invasion. Scale bars = 100 μm. ** P < 0.01 compared with miR‐NC. (D) qRT‐PCR analyses of miR‐18a‐5p expression level following treatment B‐CPAP cells with miR‐18a‐5p inhibitor (anti‐miR‐18a‐5p). (E) Colony‐forming growth assay was performed to determine the proliferation of B‐CPAP cells. (F) Transwell assay was performed to investigate changes in B‐CPAP cell invasion. Scale bars = 100 μm. ** P < 0.01 compared with anti‐miR‐NC. (G) Western blot was used to detect the level of FIH‐1 in TPC‐1 cells cotransfected with pcDNA‐FIH‐1 plasmid and miR‐18a‐5p mimics. (H) The growth of TPC‐1 cells was detected by colony formation assay. (I) The invasion of TPC‐1 cells was detected by Transwell method. Scale bars = 100 μm. ** P < 0.01 compared with miR‐NC, *** P < 0.01 compared with miR‐18a‐5p
FIGURE 5
FIGURE 5
miR‐18a‐5p/FIH‐1 axis mediated CASC2‐inhibited cell growth, migration and invasion. (A) Western blot was used to detect the expression level of FIH‐1 in TPC‐1 cells cotransfected with pcDNA‐CASC2 plasmid and si‐FIH‐1. (B) The growth of TPC‐1 cells was detected by colony formation assay. (C) The invasion of TPC‐1 cells was detected by Transwell method. Scale bars = 100 μm. ** P < 0.01 compared with vector, *** P < 0.01 compared with pcDNA‐CASC2. (D) qRT‐PCR was used to detect the level of CASC2 in TPC‐1 cells cotransfected with pcDNA‐CASC2 plasmid and miR‐18a‐5p mimics. (E) qRT‐PCR was used to detect the expression level of miR‐18a‐5p in TPC‐1 cells. (F) Western blot was used to detect the expression level of FIH‐1 in TPC‐1 cells cotransfected with pcDNA‐CASC2 plasmid and miR‐18a‐5p mimics. (G) the growth of TPC‐1 cells was detected by colony formation assay. (H) the invasion of TPC‐1 cells was detected by Transwell method. Scale bars = 100 μm. ** P < 0.01 compared with miR‐NC, *** P < 0.01 compared with miR‐18a‐5p
FIGURE 6
FIGURE 6
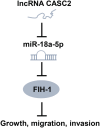
A schematic model for CASC2 inhibits the growth, migration, and invasion of thyroid cancer cells through sponging miR‐18a‐5p/FIH1 axis

References

    1. Sedaghati M, Kebebew E. Long noncoding RNAs in thyroid cancer. Curr Opin Endocrinol Diabetes Obes. 2019;26(5):275–81. - PubMed
    1. Murugan AK, Munirajan AK, Alzahrani AS. Long noncoding RNAs: Emerging players in thyroid cancer pathogenesis. Endocr Relat Cancer. 2018;25(2):R59–82. - PubMed
    1. Gou L, Zou H, Li B. Long noncoding RNA MALAT1 knockdown inhibits progression of anaplastic thyroid carcinoma by regulating miR‐200a‐3p/FOXA1. Cancer Biol Ther. 2019;20(11):1355–65. - PMC - PubMed
    1. Qu X, Alsager S, Zhuo Y, Shan B. HOX transcript antisense RNA (HOTAIR) in cancer. Cancer Lett. 2019;454:90–7. - PubMed
    1. Li Q, Song W, Wang J. TUG1 confers Adriamycin resistance in acute myeloid leukemia by epigenetically suppressing miR‐34a expression via EZH2. Biomed Pharmacother. 2019;109:1793–801. - PubMed

MeSH terms

LinkOut - more resources