. 2021 Feb 1;320(2):H740-H761.
doi: 10.1152/ajpheart.00736.2020. Epub 2020 Dec 18.

Obesity-induced cognitive impairment in older adults: a microvascular perspective

Affiliations

Obesity-induced cognitive impairment in older adults: a microvascular perspective

Priya Balasubramanian et al. Am J Physiol Heart Circ Physiol. .

Abstract

Over two-thirds of individuals aged 65 and older are obese or overweight in the United States. Epidemiological data show an association between the degree of adiposity and cognitive dysfunction in the elderly. In this review, the pathophysiological roles of microvascular mechanisms, including impaired endothelial function and neurovascular coupling responses, microvascular rarefaction, and blood-brain barrier disruption in the genesis of cognitive impairment in geriatric obesity are considered. The potential contribution of adipose-derived factors and fundamental cellular and molecular mechanisms of senescence to exacerbated obesity-induced cerebromicrovascular impairment and cognitive decline in aging are discussed.

Keywords: aging; endothelial dysfunction; metabolic syndrome; neurovascular coupling; senescence.


Conflict of interest statement

No conflicts of interest, financial or otherwise, are declared by the authors.

Figures

Figure 1.
Figure 1.
Obesity in aging promotes cognitive impairment and dementia. A: prevalence of dementia by BMI status, across age categories. Note that obesity in aging is associated with a significant increase in the prevalence of dementia. Figure is reprinted with permission from reference (8). B: obesity is associated with impaired cognitive performance [lower Rapid Visual Information Processing (RVIP) accuracy score] in older participants of the Oklahoma Longitudinal Study on Aging (>60 yr old). The RVIP task [Cambridge Neuropsychological Test Automated Battery (CANTAB) battery of tests] is a sensitive serial discrimination task where task performance reflects visual sustained attention (vigilance) and working memory capabilities. fMRI studies show that frontal, parietal, and cerebellar regions are activated during the task. Older individuals exhibit a decreased performance on the RVIP task (7), which is further exacerbated by obesity. Data are replotted from reference (44). *Significant difference between the two groups. BMI, body mass index; fMRI, functional magnetic resonance imaging.
Figure 2.
Figure 2.
Cerebral blood flow is decreased in obese subjects. A shows the relationship between body mass index (BMI) and age-adjusted mean baseline blood flow velocities (BFV) in right and left middle cerebral artery (□MCAR, ■MCAL). B shows that mean BFV in MCAR (P = 0.017) and MCAL (P = 0.0002) are higher for normal weight (BMI < 25 kg/m2) than overweight (BMI 25–30 kg/m2) and obese subjects (BMI > 30 kg/m2). C and D show the average cerebrovascular resistance (CVR in □MCAR and ■MCAL during baseline and head-up tilt (mean ± SE). The figures are reprinted with permission from reference (63).
Figure 3.
Figure 3.
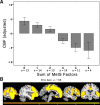
Obesity and the metabolic syndrome impair CBF. A: CBF is decreased proportional to the number of metabolic syndrome factors (including abdominal obesity, triglycerides, HDL-cholesterol, blood pressure, and fasting glucose) present in an individual. Lower CBF was reported to most robustly associate with abdominal obesity, and only to a lesser extent with triglycerides and fasting glucose (59). B: participants with metabolic syndrome and obesity show significantly lower CBF in large portions of the cortical surface of the frontal and parietal lobes, and the lateral and superior portions of the temporal and occipital lobes (yellow: voxel-wise results at P < 0.05, FEW corrected, controlling for age, sex, and reference cluster. Resting CBF assessments were made using background-suppressed pseudocontinuous arterial spin labeled (pcASL) MRI. The figures are reprinted with permission from reference (59). CBF, cerebral blood flow.
Figure 4.
Figure 4.
Proposed scheme for cerebromicrovascular contributions to obesity-induced cognitive decline in older adults. Excessive accumulation of fat in obesity is associated with adipose tissue dysfunction and low grade inflammation, which results in altered secretion of adipokines and proinflammatory cytokines. These circulating factors mediate the crosstalk between adipose tissue and the brain by impairing the cerebral microcirculation. In aging heightened inflammatory status of the adipose tissue promotes increased systemic inflammation, which—together with age-related impairment of cellular stress resilience pathways—play a key role in the increased vulnerability of obese elderly patients for cognitive impairment. Functional and structural impairment of the cerebral microcirculation results in endothelial dysfunction, neurovascular dysfunction, and microvascular rarefaction, all of which contribute to a significant decline in cerebral blood flow. Microvascular inflammation and disruption of the blood-brain barrier exacerbate neuroinflammation. Obesity is also associated with dysbiosis. Age-related breakdown of the intestinal barrier promotes the leakage of bacterial breakdown products to the circulation, exacerbating microvascular inflammation and blood-brain barrier dysfunction (PAMPs: pathogen-associated molecular patterns). The resulting ischemic and inflammatory foci play a role in the pathogenesis of cognitive impairment. The model predicts that the aforementioned obesity-related structural and functional cerebromicrovascular alterations synergize to promote cognitive impairment in high-risk older adults.
Figure 5.
Figure 5.
Obesity impairs neurovascular coupling responses. A: obesity impairs neurovascular coupling in mice. Representative pseudocolour laser speckle flowmetry maps of baseline CBF (top) and CBF changes in the whisker barrel field relative to baseline during contralateral whisker stimulation (bottom, right oval, 30 s, 5 Hz) in standard diet-fed lean and high-fat diet-fed obese mice. Color bar represents CBF as percent change from baseline. B shows the time-course of CBF changes after the start of contralateral whisker stimulation (horizontal bars). Summary data are shown in C. Data are mean ± S.E. (n = 6–8 in each group), *P < 0.05 vs. lean control; #P < 0.05 vs. untreated (one-way ANOVA with post hoc Tukey’s tests). D and E: obesity impairs neurovascular coupling in older humans. Neurovascular coupling responses were assessed by functional near-infrared spectroscopy (fNIRS) during a finger-tapping task in normal weight (BMI 18–25, n = 10) and obese (BMI > 30, n = 10) older adults (>65 years of age). Data were analyzed using the Brain AnalyzIR toolbox (97) based on a general linear model (GLM) approach. Task-related changes in oxygenated hemoglobin (HbO) concentration [calculated using the Beer–Lambert law (96)] was used as an index of functional hyperemia. The design matrix included boxcar regressors for each stimulation, and a canonical hemodynamic response function was used to identify activated cortical regions. β-Weights, scaling the predictors, were then used for group-level statistics, where a t contrast of [BMI 18–25] – [BMI >30] was applied (*P < 0.05). In D solid lines represent statistically significant difference between groups in task-evoked neurovascular coupling responses in the area and vicinity of the left primary motor cortex, evidenced by the increased HbO concentration observed in the normal weight older adult group when compared with their obese counterparts. Bar graphs (E) represent calculated changes in HbO. Note that neurovascular responses, that show an age-related decline even in older adults, are inverted in obese older adults. Position of fNIRS light sources (s14 and s15) and light detectors (d13, d15, and d16) are shown in D. Data are replotted from previously published studies (45, 86). BMI, body mass index; CBF, cerebral blood flow.

Similar articles

Cited by

References

    1. Wang YC, Colditz GA, Kuntz KM. Forecasting the obesity epidemic in the aging U.S. population. Obesity (Silver Spring) 15: 2855–2865, 2007. doi: 10.1038/oby.2007.339. - DOI - PubMed
    1. Flegal KM, Carroll MD, Kit BK, Ogden CL. Prevalence of obesity and trends in the distribution of body mass index among US adults, 1999-2010. JAMA 307: 491–497, 2012. doi: 10.1001/jama.2012.39. - DOI - PubMed
    1. Beydoun MA, Beydoun HA, Wang Y. Obesity and central obesity as risk factors for incident dementia and its subtypes: a systematic review and meta-analysis. Obes Rev 9: 204–218, 2008. doi: 10.1111/j.1467-789X.2008.00473.x. - DOI - PMC - PubMed
    1. Gustafson DR, Karlsson C, Skoog I, Rosengren L, Lissner L, Blennow K. Mid-life adiposity factors relate to blood-brain barrier integrity in late life. J Intern Med 262: 643–650, 2007. doi: 10.1111/j.1365-2796.2007.01869.x. - DOI - PubMed
    1. Prickett C, Brennan L, Stolwyk R. Examining the relationship between obesity and cognitive function: a systematic literature review. Obes Res Clin Pract 9: 93–113, 2015. doi: 10.1016/j.orcp.2014.05.001. - DOI - PubMed

Publication types

MeSH terms

LinkOut - more resources