Review
. 2021 Aug 17;45(4):fuaa068.
doi: 10.1093/femsre/fuaa068.

Environmental fluctuations and their effects on microbial communities, populations and individuals

Affiliations
Review

Environmental fluctuations and their effects on microbial communities, populations and individuals

Jen Nguyen et al. FEMS Microbiol Rev. .

Abstract

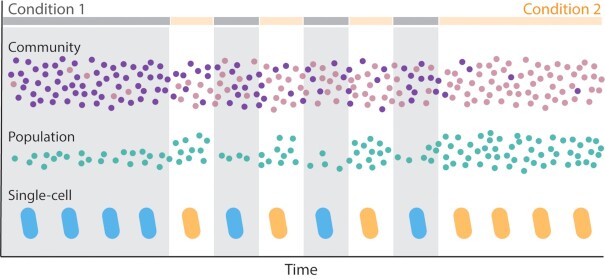
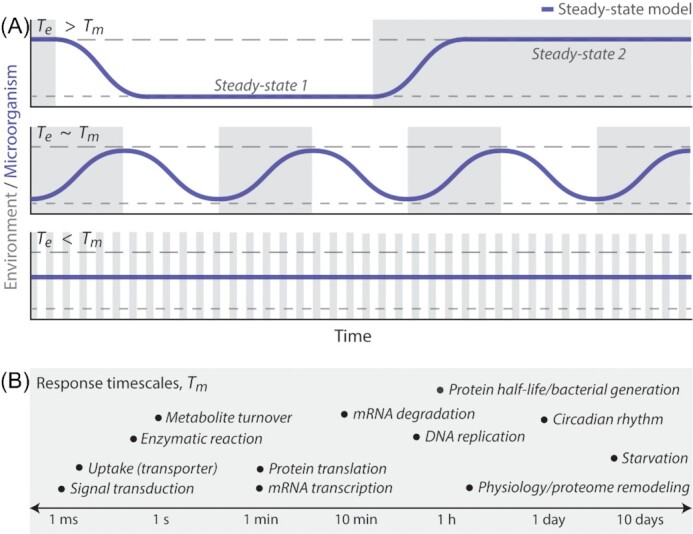
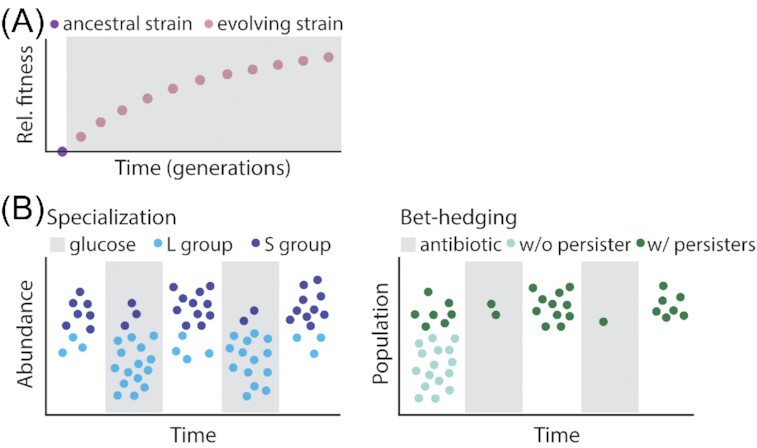
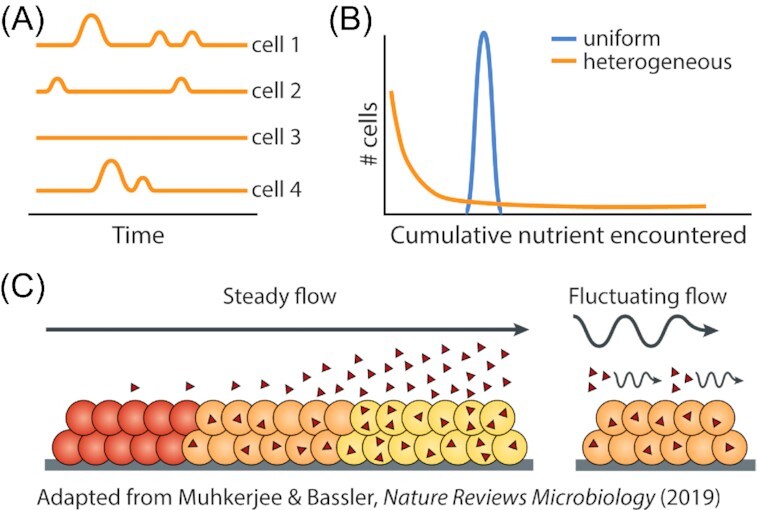
From the homeostasis of human health to the cycling of Earth's elements, microbial activities underlie environmental, medical and industrial processes. These activities occur in chemical and physical landscapes that are highly dynamic and experienced by bacteria as fluctuations. In this review, we first discuss how bacteria can experience both spatial and temporal heterogeneity in their environments as temporal fluctuations of various timescales (seconds to seasons) and types (nutrient, sunlight, fluid flow, etc.). We then focus primarily on nutrient fluctuations to discuss how bacterial communities, populations and single cells respond to environmental fluctuations. Overall, we find that environmental fluctuations are ubiquitous and diverse, and strongly shape microbial behavior, ecology and evolution when compared with environments in which conditions remain constant over time. We hope this review may serve as a guide toward understanding the significance of environmental fluctuations in microbial life, such that their contributions and implications can be better assessed and exploited.

Keywords: changing environments; microbial evolution; microbial physiology; microbial responses; population dynamics; single cell.


Figures

Figure 1.
Figure 1.
Environmental fluctuations occur across length scales and timescales in diverse habitats. (A) Kilometer-scale algal bloom on Western Lake Erie. Courtesy of NOAA (https://oceanservice.noaa.gov/facts/hab-solutions.html). (B) A microscale nutrient hotspot is created as a marine diatom secretes metabolites into the local environment. Chemotactic bacteria accumulate around the hotspot, as shown by the time projection (Smriga et al. 2016). (C) A temporal map of European river flooding events, which bring water on kilometer scales to local soils (Blöschl et al. 2017). Colors indicate time of year and arrows indicate how yearly events change over time as the climate changes. (D) Microscale image of chemicals seeping into a soil-like porous medium. The void spaces between soil grains (gray) are filled with either air (black) or water (blue): the water saturation and pore size affect how fluid and chemicals are transported through the medium. Chemical heterogeneities (colorbar) arise due to the formation of preferential paths (Jiménez‐Martínez et al. 2017). White arrow indicates flow direction, as chemical seeps into soil. (E) Microscale image of the gut epithelium and its 100–500-µm-sized crypts (black arrows) (Shamsuddin, Phelps and Trump 1982). Each crypt is lined by mucus-secreting cells and this mucus contributes to maintain strong gradients in oxygen, antimicrobials and flow, accessible to resident bacteria (blue asterisks).
Figure 2.
Figure 2.
Community, population and single-cell scales of microbial response to fluctuations. Microbial communities, populations and single cells respond to environmental fluctuations through a variety of processes. A community experiencing fluctuations between Condition 1 and Condition 2 (represented by the broken horizontal gray and orange lines) can shift in community composition between the steady states associated with either condition. The purple species dominates the community when the environment is steadily Condition 1, whereas the pink species dominates under steady Condition 2. The relative abundance of these species fluctuates under fluctuating environmental conditions, as the interactions between species change with the environment. A population can change in size with the environment, as illustrated by the population of green cells, which grows faster in Condition 2 than in Condition 1. Finally, single cells can regulate their physiology in response to the immediate environment. Upon sensing Condition 1, a cell may induce gene expression to produce proteins and metabolites for growth in Condition 1, represented here as a ‘blue’ physiology. Likewise, cells may express genes for an ‘orange’ physiology upon sensing Condition 2.
Figure 3.
Figure 3.
Microbial dynamics depend on the relative timescales between environmental fluctuations and microbial responses. (A) The relationship between the timescale of environmental fluctuation (Te) and the timescale of a microbial response (Tm) determines the dynamics of the response under changing environments. Here, the environment fluctuates between two conditions (gray and white), each associated with a microbial steady state (longer or shorter dashed lines, respectively). When environmental fluctuations occur on sufficiently long timescales relative to the response (Te > Tm), the response (i.e. the transition between the steady states characteristic of each environmental condition) completes after each shift once Tm has elapsed. When TeTm, the response may produce a behavior that does not stabilize. As Te becomes smaller with respect to Tm, environmental fluctuations occur faster than the time required to stabilize at steady state, causing microorganisms to fluctuate between steady states without reaching them. Finally, environmental fluctuations can be so fast relative to the microbial response of interest (Te < Tm) that microorganisms behave as if the environment were a single steady condition. (B) Microbial responses to environmental fluctuation span a diversity of behaviors, including changes in nutrient uptake, growth rate, gene expression and more. These responses occur on behavior-specific timescales of milliseconds to days (Shamir et al. 2016). In this schematic, we list approximate Tm for a variety of possible responses by order of magnitude, as each process realistically also spans a range. For example, different enzymes will catalyze one reaction at different rates (microseconds to tens of seconds), and bacterial generation times will vary with species and growth condition (tens of minutes to days).
Figure 4.
Figure 4.
Environmental fluctuations affect the diversity and function of microbial communities. (A)The regularity of nutrient fluctuations is essential to produce regular oscillations in the microbial communities of mice (Thaiss et al. ; Zarrinpar et al. 2014) and humans (Thaiss et al. 2016). (B) Fluctuations in a privileged nutrient source enhance the long-term maintenance of a newly introduced bacterial strain into a pre-existing murine gut microbiota (Kearney et al. 2018). The introduced strain could be detected after 60 days without the privileged nutrient if introduced within 35 days of nutrient fluctuations (top), whereas the strain could not be detected when introduced with 35-days of steady nutrient exposure (bottom). (C) Environmental fluctuations can induce lasting changes in community composition, even after the environment returns to pre-fluctuation conditions. This bistability (blue) in microbial behavior is observable as a different post-perturbation steady state (ii) than the initial steady state (i). Recent studies have observed such bistability after a single pulse (left, steady gray) (Tropini et al. 2018) or series of environmental fluctuations (right, fluctuating gray) (Kearney et al. ; Nguyen et al. 2020).
Figure 5.
Figure 5.
Environmental fluctuations drive the evolution of adaptive traits in microbial populations. (A) Environmental change drives evolutionary adaptations. Experiments propagating E. coli in a constant environment have shown that the fastest rates of evolution adaption occur within the first 5000 generations evolved in a new environment (gray), after which the accumulation of beneficial mutations begins to slow (Cooper and Lenksi ; Tenaillon et al. 2016). (B) Evolutionary adaptations in fluctuating environments can be classified into two groups: (i) specializations and (ii) bet-hedging adaptations. Specializations are adaptations that increase population growth in one of the multiple conditions that the environment fluctuates between, such as the L group's advantage in glucose and the S group's advantage in zero glucose (Rozen and Lenksi ; Rozen et al. 2009). Bet-hedging adaptations, such as persister cells in E. coli populations (Balaban et al. 2004), decrease population growth in any one condition but increase population growth when the population experiences fluctuations. Colors specify populations (i.e. populations with or without persisters), not phenotypes (i.e. persister vs normal growing cell).
Figure 6.
Figure 6.
Environmental fluctuations affect the phenotypic heterogeneity of microbial populations. (A) Variation in temporal exposure to nutrient between individual cells of a clonal population arises due to the heterogeneous spatial structure of microbial habitats. Individuals located in different regions of a heterogeneous habitat encounter different nutrient patches at different times, leading to heterogeneity in nutrient encounter and cellular physiology between cells. (B) Distributions of nutrient encounter by individuals within a microbial population in uniform and heterogeneous environments. Because individuals in heterogeneous environments experience differing times and amounts of nutrient exposure (Kuzyakov and Blagodatskaya 2015), the vast majority of cells do not encounter enough nutrient to divide. Thus, the temporal fluctuations in resource concentration (panel A) produced by environmental spatial heterogeneity can increase the phenotypic heterogeneity within microbial populations. (C) Fluctuations in fluid flow can reduce population heterogeneity by affecting the accumulation of cell-to-cell signaling molecules (Muhkerjee and Bassler 2019). Under steady fluid flow, quorum sensing molecules (red triangles) accumulate to higher concentrations around regions of the bacterial population that are further downstream. This gradient in quorum sensing molecules produces a gradient in gene expression and therefore microbial activity within a population. Such gradients are lessened when fluid flow fluctuates between flowing and stagnant, enabling a more homogeneous expression of quorum sensing-mediated microbial functions.
Figure 7.
Figure 7.
Physiological adaptations to environmental fluctuations at the single-cell level. (A) Some microorganisms anticipate environmental change by sensing the occurrence of an environmental condition that reliably precedes the anticipated condition. Increased temperature is one such example. E.coli upregulates genes for anoxic conditions long before experiencing a decrease in oxygen concentration (Tagkopoulus, Liu and Tavazoie 2008). (B) Some single-cell physiologies that emerge in fluctuating environments are distinct from steady-state physiologies. Some may arise while following the steady-state model, if the environment fluctuates on timescales faster than cells can reach each physiological steady state. This produces mixed physiologies, with partial expression of genes associated with both steady states. Alternatively, some single-cell physiologies are novel fluctuation-adapted physiologies, induced by environmental fluctuations to provide a growth advantage when environments fluctuate at certain timescales.

References

    1. Acar M, Mettetal JT, Van Oudenaarden A. Stochastic switching as a survival strategy in fluctuating environments. Nat Genet. 2008;40:471. - PubMed
    1. Ackermann M. A functional perspective on phenotypic heterogeneity in microorganisms. Nat Rev Microbiol. 2015;13:497–508. - PubMed
    1. Ahmerkamp S, Winter C, Janssen Fet al. . The impact of bedform migration on benthic oxygen fluxes. J Geophys Res-Biogeo. 2015;120:2229–42.
    1. Arevalo P, VanInsberghe D, Elsherbini Jet al. . A Reverse Ecology Approach Based on a Biological Definition of Microbial Populations. Cell. 2019;178:820–34. - PubMed
    1. Azam F, Malfatti F.. Microbial structuring of marine ecosystems. Nat Rev Microbiol. 2007;5:782–91. - PubMed

Publication types