

Using Robson's Ten-Group Classification System for comparing caesarean section rates in Europe: an analysis of routine data from the Euro-Peristat study
- PMID: 33338307
- PMCID: PMC8359161
- DOI: 10.1111/1471-0528.16634
Using Robson's Ten-Group Classification System for comparing caesarean section rates in Europe: an analysis of routine data from the Euro-Peristat study
Erratum in
-
Corrigendum.BJOG. 2022 Dec;129(13):2214. doi: 10.1111/1471-0528.17308. BJOG. 2022. PMID: 36336881 Free PMC article. No abstract available.
Abstract
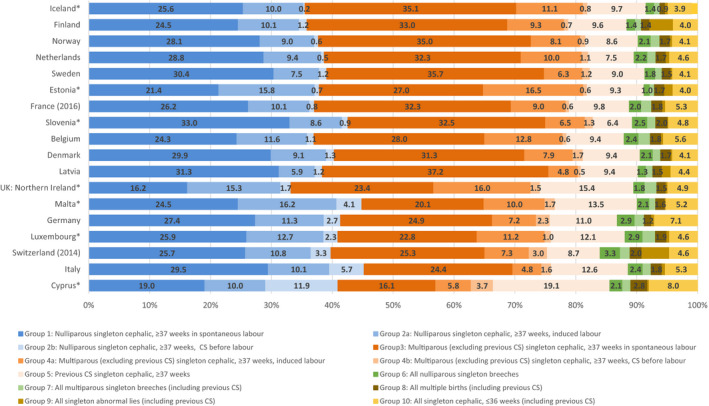
Objective: Robson's Ten Group Classification System (TGCS) creates clinically relevant sub-groups for monitoring caesarean birth rates. This study assesses whether this classification can be derived from routine data in Europe and uses it to analyse national caesarean rates.
Design: Observational study using routine data.
Setting: Twenty-seven EU member states plus Iceland, Norway, Switzerland and the UK.
Population: All births at ≥22 weeks of gestational age in 2015.
Methods: National statistical offices and medical birth registers derived numbers of caesarean births in TGCS groups.
Main outcome measures: Overall caesarean rate, prevalence and caesarean rates in each of the TGCS groups.
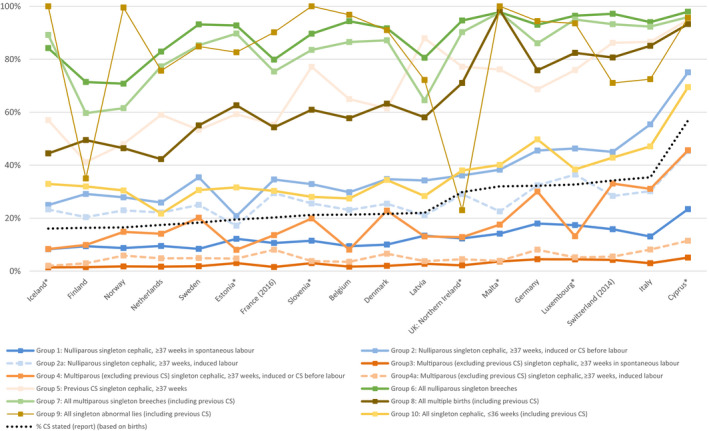
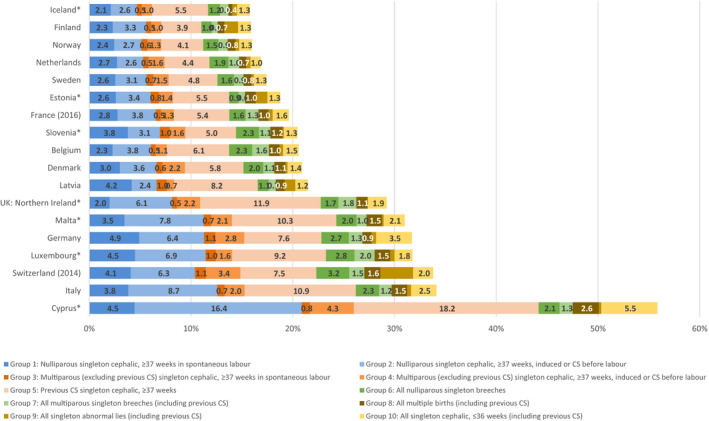
Results: Of 31 countries, 18 were able to provide data on the TGCS groups, with UK data available only from Northern Ireland. Caesarean birth rates ranged from 16.1 to 56.9%. Countries providing TGCS data had lower caesarean rates than countries without data (25.8% versus 32.9%, P = 0.04). Countries with higher caesarean rates tended to have higher rates in all TGCS groups. Substantial heterogeneity was observed, however, especially for groups 5 (previous caesarean section), 6, 7 (nulliparous/multiparous breech) and 10 (singleton cephalic preterm). The differences in percentages of abnormal lies, group 9, illustrate potential misclassification arising from unstandardised definitions.
Conclusions: Although further validation of data quality is needed, using TGCS in Europe provides valuable comparator and baseline data for benchmarking and surveillance. Higher caesarean rates in countries unable to construct the TGCS suggest that effective routine information systems may be an indicator of a country's investment in implementing evidence-based caesarean policies.
Tweetable abstract: Many European countries can provide Robson's Ten-Group Classification to improve caesarean rate comparisons.
Keywords: Caesarean birth; Europe; Robson classification; Ten-Group Classification System; health information systems; perinatal health indicators.
© 2021 The Authors. BJOG: An International Journal of Obstetrics and Gynaecology published by John Wiley & Sons Ltd.
Figures
Comment in
-
Known knowns, unknown unknowns and everything in-between - the Ten Group Classification System (TGCS).BJOG. 2021 Aug;128(9):1454-1455. doi: 10.1111/1471-0528.16679. Epub 2021 Mar 22. BJOG. 2021. PMID: 33666329 No abstract available.
-
Re: Using Robson's Ten-Group Classification System for comparing caesarean section rates in Europe: an analysis of routine data from the Euro-Peristat study.BJOG. 2021 Aug;128(9):1558-1559. doi: 10.1111/1471-0528.16748. Epub 2021 Jun 1. BJOG. 2021. PMID: 34062041 No abstract available.
References
-
- Zeitlin J, Alexander S, Barros H, Blondel B, Delnord M, Durox M, et al. Perinatal health monitoring through a European lens: eight lessons from the Euro‐Peristat report on 2015 births. BJOG 2019;126:1518–22. - PubMed
-
- Cheng YW, Snowden JM, Handler S, Tager IB, Hubbard A, Caughey AB. Clinicians' practice environment is associated with a higher likelihood of recommending cesarean deliveries. J Matern Fetal Neonatal Med 2014;27:1220–7. - PubMed
-
- Minkoff H. Fear of litigation and cesarean section rates. Semin Perinatol 2012;36:390–4. - PubMed
-
- Robson M. Classification of caesarean sections. Fetal Matern Med Rev 2001;12:23–39.
Publication types
MeSH terms
Grants and funding
LinkOut - more resources
Full Text Sources
Other Literature Sources
Medical
