. 2021 Feb 4;81(3):614-628.e4.
doi: 10.1016/j.molcel.2020.11.033. Epub 2020 Dec 17.

Ribosome quality control antagonizes the activation of the integrated stress response on colliding ribosomes

Affiliations

Ribosome quality control antagonizes the activation of the integrated stress response on colliding ribosomes

Liewei L Yan et al. Mol Cell. .

Abstract

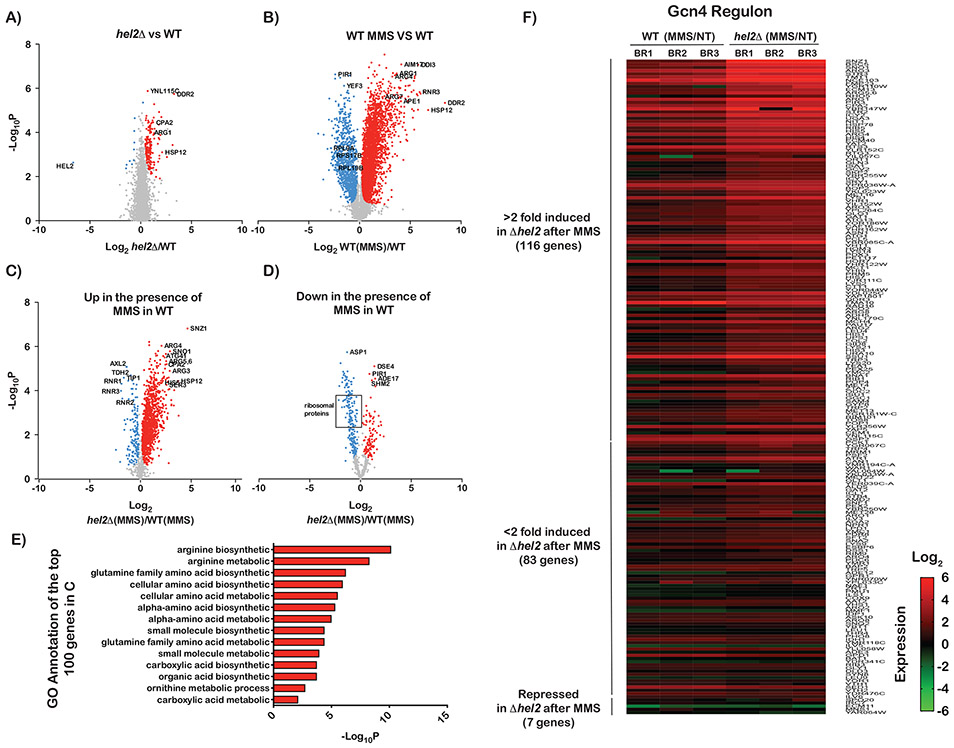
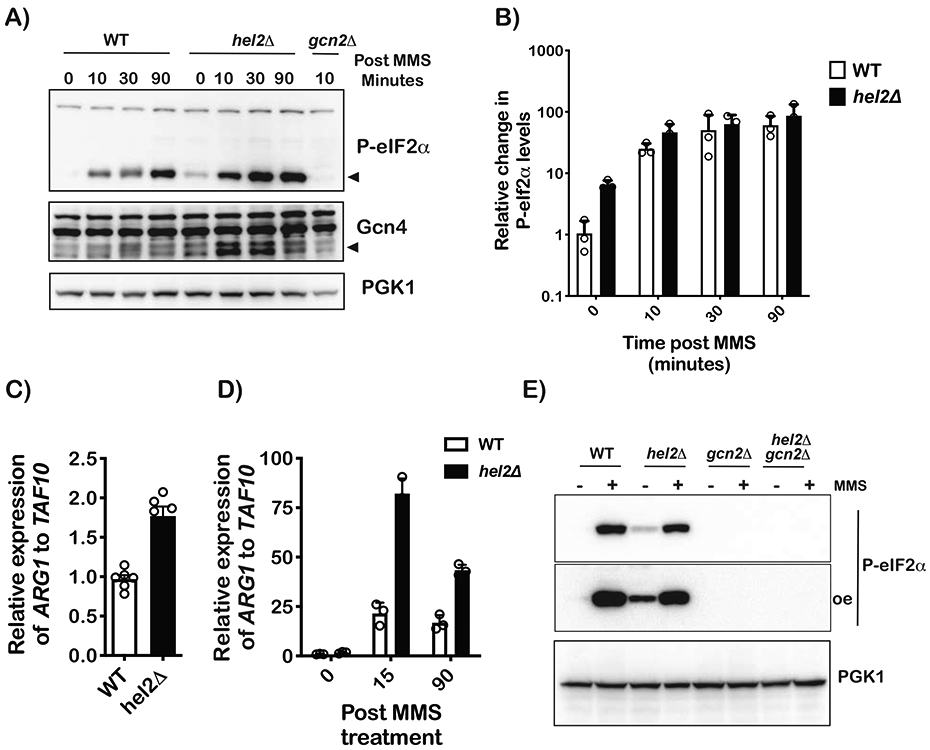
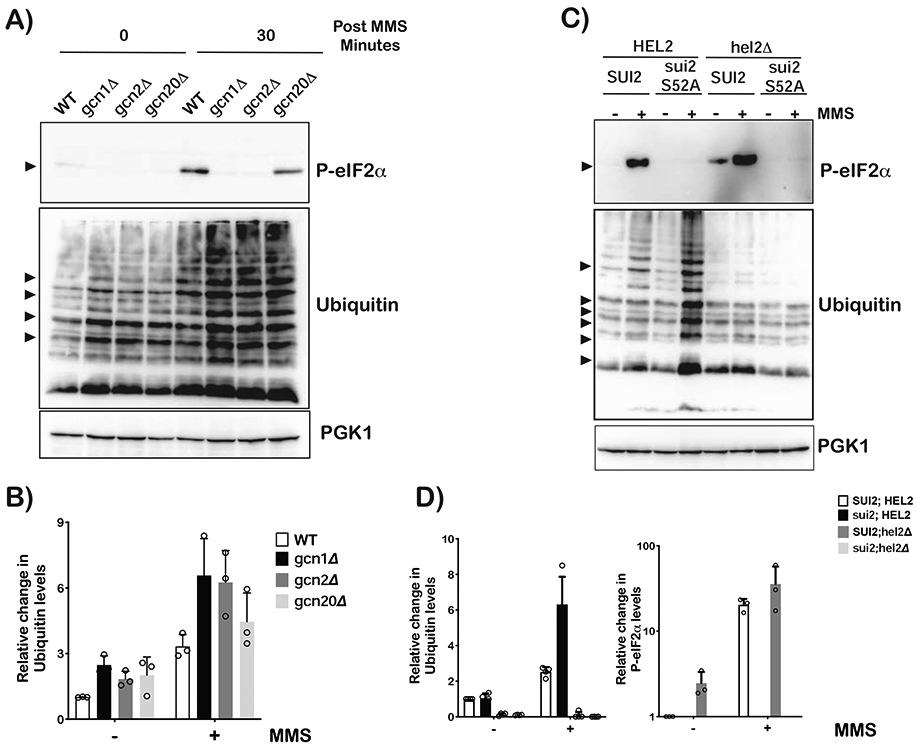
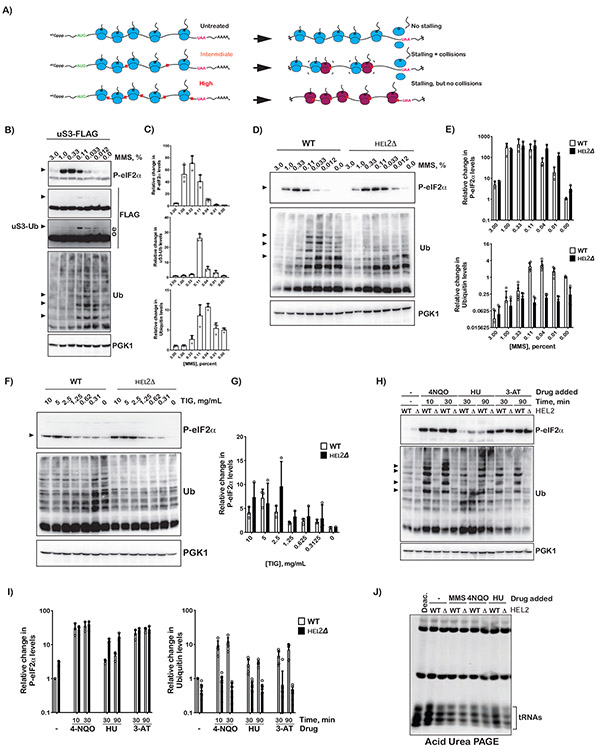
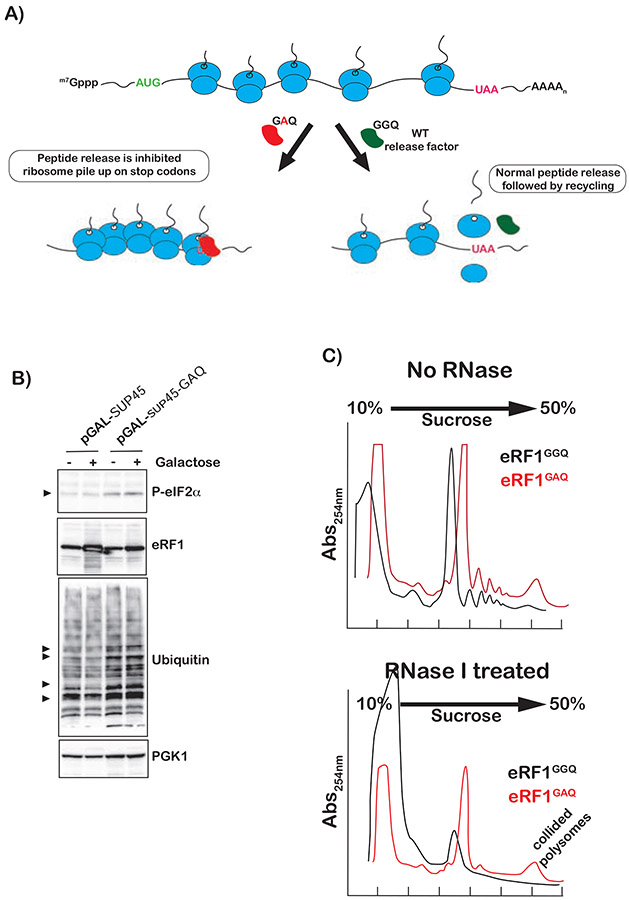
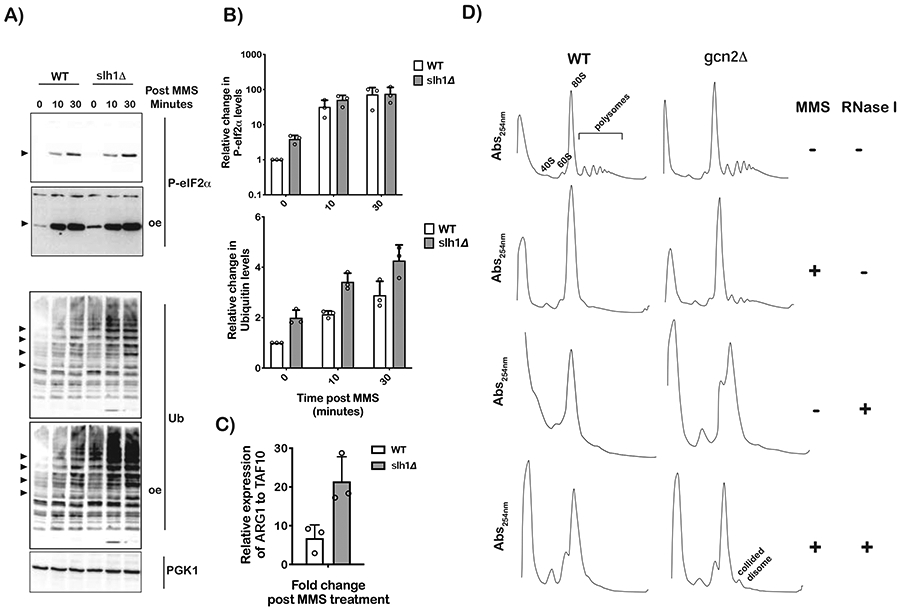
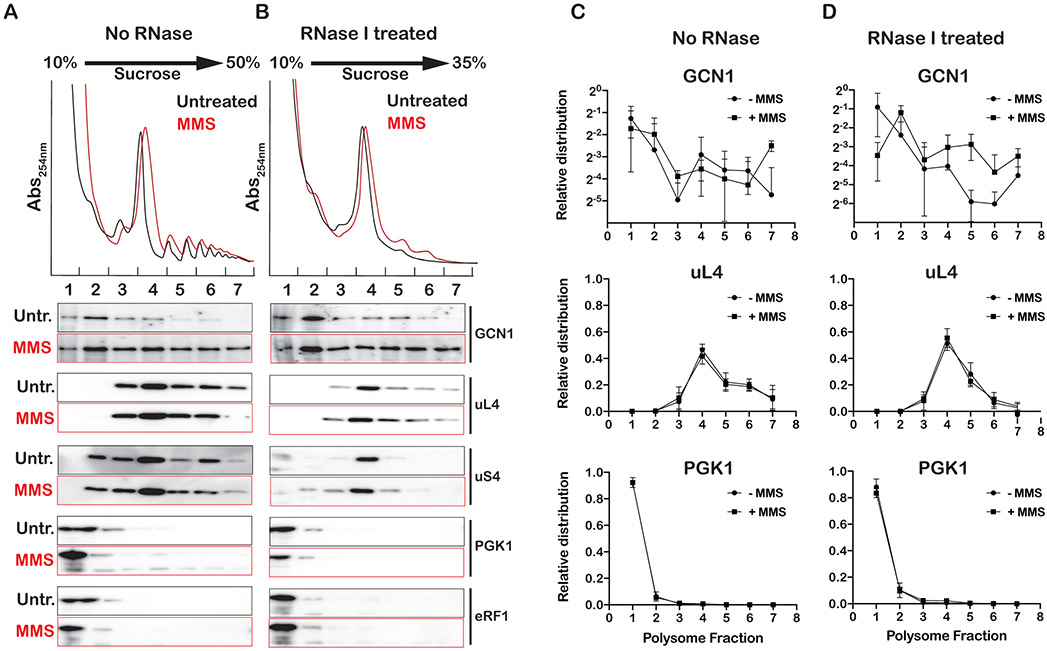
Stalling during translation triggers ribosome quality control (RQC) to maintain proteostasis. Recently, stalling has also been linked to the activation of integrated stress response (ISR) by Gcn2. How the two processes are coordinated is unclear. Here, we show that activation of RQC by Hel2 suppresses that of Gcn2. We further show that Hel2 and Gcn2 are activated by a similar set of agents that cause ribosome stalling, with maximal activation of Hel2 observed at a lower frequency of stalling. Interestingly, inactivation of one pathway was found to result in the overactivation of the other, suggesting that both are activated by the same signal of ribosome collisions. Notably, the processes do not appear to be in direct competition with each other; ISR prefers a vacant A site, whereas RQC displays no preference. Collectively, our findings provide important details about how multiple pathways that recognize stalled ribosomes coordinate to mount the appropriate response.

Keywords: Gcn2; Hel2; RNA damage; alkylation; integrated stress response; ribosome quality control; ribosome rescue.


Conflict of interest statement

Declaration of interests The authors declare no competing interests.

Figures

Figure 1∣
Figure 1∣. Transcriptional profiling of wild-type and hel2Δ cells in the absence and presence of MMS.
A) Volcano plots of −log10p values against log2 relative-fold-changes in the RNA levels of all genes in the hel2Δ strain to the wild-type one. Genes that are significantly upregulated are shown in red and those that are significantly downregulated are shown in blue. B) Similar to A, but for the relative change between wild-type cells treated with MMS and mock-treated ones. C) Volcano plot used to follow the relative change in mRNA levels for hel2Δ cells in the presence of MMS versus wild-type cells in the presence of MMS, but only for genes that were upregulated in the presence of MMS in the wild-type cells, i.e. genes shown in red in B. D) Similar to C, but for genes that were downregulated in the presence of MMS in the wild-type cells, i.e. those shown in blue dots in B. E) Bar graphs of −log10p values of the gene-ontology (GO) analysis conducted on the 100 most upregulated genes in the hel2Δ cells relative to the wild-type ones in the presence of MMS. F) Heat-map of the relative mRNA levels of Gcn4-regulated genes in MMS-treated cells to mock-treated ones for each biological replicate. The genes are hierarchically organized based on their fold difference.
Figure 2∣
Figure 2∣. Ribosome stalling activates eIF2α phosphorylation in a process that is antagonized by Hel2.
A) Western-blot analysis of total proteins isolated from wild-type and hel2Δ cells treated with 0.1% MMS for the indicated times. B) Bar graph of western-blot analysis used to follow phospho-eIF2 α levels in WT and hel2Δ cells upon MMS treatment for the indicated times. The signal for phospho-eIF2α was normalized to that of PGK1. p-value for time point 0 is 0.0018 as determined by a multiple-t test in GraphPad Prism. C) Bar graph of qPCR analysis used to measure the relative levels of the ARG1 transcript in the indicated cells with no treatment. D) Similar to C, but for cells treated with MMS for the depicted times. E) Western-blot analysis of proteins isolated from the indicated cells that were grown in the absence of presence of 0.1% MMS for 30 minutes. In all cases, plotted is the mean values determined from at least three biological repeats with the error bars representing the standard deviation around it.
Figure 3∣
Figure 3∣. RQC and ISR do not appear to directly compete with each other.
A) Western-blot analysis used to follow eIF2α phosphorylation and ubiquitination as a function of MMS in wild-type, gcn1Δ, gcn2Δ and gcn2Δ cells. B) Bar-graph analysis of three independent immuno blots similar to the one shown in (A), used to follow the relative levels of indicated ubiquitin bands in the denoted samples. C) Western-blot analysis of total protein isolated from wild-type, sui2-S52A (eIF2α cannot be phosphorylated), hel2Δ and sui2-S52A;hel2Δ cells that had been grown in the absence or presence of 0.1% MMS for 30 minutes. D) Relative levels of ubiquitin bands and phospho-eIF2α in the indicated cells, respectively. Analysis was carried out on three independent immuno blots similar to the one shown in (C). For all bar graphs, plotted is the mean values determined from three biological repeats with the error bars representing the standard deviation around it.
Figure 4∣
Figure 4∣. Intermediate concentrations of MMS and tigecycline are required for maximal activation of Gcn2.
A) Schematic showing how intermediate, but not high, concentrations of inhibitors lead to ribosome collision. B) Western-blot analysis used to follow phosphorylation of eIF2α and uS3 ubiquitination as a function of MMS concentration. In all cases cells were treated with the indicated concentration of MMS for 30 minutes. C) Relative levels of phospho-eIF2α, Ub-uS3 and indicated Ubiquitin bands in (B) collected from cells treated with the depicted concentration of MMS for 30 minutes. Quantification was conducted by densitometry analysis of at least three independent immuno-blots similar to the ones shown in (B); band intensities were normalized to Pgk1 signal. D) Western-blot analysis of total proteins isolated from wild-type and hel2Δ cells treated with the indicated MMS concentration for 30 minutes. E) Bar graph showing the relative levels of phospho-eIF2α and Ubiquitin bands in WT and hel2Δ cells treated with the indicated concentration of MMS for 30 minutes. Analysis was conducted as per (C). F) and G), similar to D) and E), respectively, but for cells treated with tigecycline for 30 minutes. H) Western-blot analysis of total proteins isolated from wild-type and hel2Δ cells treated with the indicated compounds for the indicated amount of time. I) Bar graph analysis of three biological repeats of the immuno-blots shown in (H) used to assess the relative levels of phospo-eIF2α and Ubiquitin bands. J) Fluorescence image of an ethidium-bromide-stained acid-PAGE gel used to resolve tRNAs isolated from wild-type and hel2Δ cells treated with the indicated compounds for 30 minutes. Note a sample, which was isolated from wild-type cells in the absence of any compounds, was deacylated with mild-base treatment and resolved on the left most lane. In all cases, plotted is the mean values determined from at least three biological repeats with the error bars representing the standard deviation around it.
Figure 5∣
Figure 5∣. Collided ribosomes with an eRF1-bound-lead ribosome do not activate ISR but activate RQC.
A) Schematic showing how a catalytically dead mutant (GAQ) of eRF1 can be used to cause ribosome collisions at stop codons with the factor bound to the A site of the lead ribosome. B) Western-blot analysis of total proteins isolated from cells expressing wild type or catalytically dead mutant of eRF1 in the absence and presence of induction by galactose. C) Polysome profiles of lysates isolated from cells expressing the indicated-release-factor variants. Top shows profiles of untreated lysates; bottom shows those of RNase I-treated lysates.
Figure 6∣
Figure 6∣. Ribosome collisions activate Gcn2.
A) Western-blot analysis of total proteins isolated from the depicted cells treated with 0.1% MMS for the indicated times (oe indicates overexpression). B) Bar-graph analysis of three independent immuno blots similar to the one shown in (A), used to follow the relative levels of phospho-eIF2α and ubiquitin bands in the indicated samples. C) qPCR analysis of the AGR1 transcript in wild-type and slh1Δ cells after a 10-minute incubation period with 0.1% MMS. D) Ribosome profiles of lysates isolated from the indicated strains that were incubated in the absence or presence of 0.1% MMS for 30 minutes. The lysates were either mock treated or RNase I treated, as shown, before resolving them over a 10-50% sucrose gradient. The disome peak that appears to be resistant to RNase I is labeled as such. For all bar graphs, plotted is the mean values determined from three biological repeats with the error bars representing the standard deviation around it.
Figure 7∣
Figure 7∣. Gcn1 associates with collided ribosomes.
A) Ribosome profiles of lysates isolated from sui2-S52A;hel2Δ cells incubated in the absence and presence of 0.1% MMS for 30 minutes. Shown is the absorbance at 254 nm of lysates fractionated over a 10-35% sucrose gradient. Below the profiles is western-blot analysis of fractions collected from sucrose-gradient fractions for the indicated proteins. B) Similar to A), but lysates were treated with RNase I prior to fractionation over a 10-35% sucrose gradient. C) and D) Densitometry analysis of immuno blots similar to the ones shown in (A) and (B), respectively, which was used to analyze the relative distribution of the indicated proteins across sucrose gradients. Analysis was conducted on three biological repeats, with the mean values plotted and the error bars representing the standard deviation around them.

References

    1. Atkinson GC, Tenson T, and Hauryliuk V (2011). The RelA/SpoT Homolog (RSH) Superfamily: Distribution and Functional Evolution of ppGpp Synthetases and Hydrolases across the Tree of Life. PLoS One 6, e23479. - PMC - PubMed
    1. Augusto L, Amin PH, Wek RC, and Sullivan WJ (2019). Regulation of arginine transport by GCN2 eIF2 kinase is important for replication of the intracellular parasite Toxoplasma gondii. PLOS Pathog. 15, e1007746. - PMC - PubMed
    1. B’Chir W, Maurin AC, Carraro V, Averous J, Jousse C, Muranishi Y, Parry L, Stepien G, Fafournoux P, and Bruhat A (2013). The eIF2α/ATF4 pathway is essential for stress-induced autophagy gene expression. Nucleic Acids Res. 41, 7683–7699. - PMC - PubMed
    1. Battaner E, and Vazquez D (1971). Inhibitors of protein synthesis by ribosomes of the 80-S type. BBA Sect. Nucleic Acids Protein Synth. 254, 316–30. - PubMed
    1. Berlanga JJ, Rivero D, Martin R, Herrero S, Moreno S, and de Haro C (2010). Role of mitogen-activated protein kinase Sty1 in regulation of eukaryotic initiation factor 2α kinases in response to environmental stress in Schizosaccharomyces pombe. Eukaryot. Cell 9, 194–207 - PMC - PubMed

Publication types

MeSH terms

Substances