. 2021 Feb 17;12(2):176-194.e6.
doi: 10.1016/j.cels.2020.11.008. Epub 2020 Dec 17.

Benchmarking Computational Doublet-Detection Methods for Single-Cell RNA Sequencing Data

Affiliations

Benchmarking Computational Doublet-Detection Methods for Single-Cell RNA Sequencing Data

Nan Miles Xi et al. Cell Syst. .

Abstract

In single-cell RNA sequencing (scRNA-seq), doublets form when two cells are encapsulated into one reaction volume. The existence of doublets, which appear to be-but are not-real cells, is a key confounder in scRNA-seq data analysis. Computational methods have been developed to detect doublets in scRNA-seq data; however, the scRNA-seq field lacks a comprehensive benchmarking of these methods, making it difficult for researchers to choose an appropriate method for specific analyses. We conducted a systematic benchmark study of nine cutting-edge computational doublet-detection methods. Our study included 16 real datasets, which contained experimentally annotated doublets, and 112 realistic synthetic datasets. We compared doublet-detection methods regarding detection accuracy under various experimental settings, impacts on downstream analyses, and computational efficiencies. Our results show that existing methods exhibited diverse performance and distinct advantages in different aspects. Overall, the DoubletFinder method has the best detection accuracy, and the cxds method has the highest computational efficiency. A record of this paper's transparent peer review process is included in the Supplemental Information.

Keywords: cell clustering; differential gene expression; doublet detection; parallel computing; reproducibility; scRNA-seq; software implementation; trajectory inference.


Conflict of interest statement

Declaration of Interests The authors declare no competing interests.

Figures
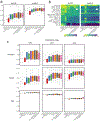
Figure 1.
Figure 1.. Evaluation of the eight doublet detection methods (except DoubletDecon) using 16 benchmark scRNA-seq datasets.
a-b, Performance (AUPRC and AUROC values) of each method applied to benchmark datasets, with (a) showing the distributions and (b) showing the values per dataset (white squares indicating failed runs); two baseline methods (lsize and ngene) are included in the comparison. c, Precision, recall, and true negative rate (TNR) of each method under the 10%, 20%, or 40% identification rate, which is the percentage of droplets that received the highest doublet scores and were identified as doublets.
Figure 2.
Figure 2.. Evaluation of the eight doublet detection methods (except DoubletDecon) using four simulation studies, and the effects of doublet detection on DE analysis, highly variable genes (HVG) identification, and cell clustering.
a, Performance (AUPRC values) of each method in four simulation settings: varying doublet rates (from 2% to 40% with a step size of 2%), varying sequencing depths (from 500 to 10,000 UMI counts per cell, with a step size of 500 counts), varying numbers of cell types (from 2 to 20 with a step size of 1), and 20 heterogeneity levels, which specify the extent to which genes are differentiated between two cell types (Methods). b, Precision, recall, and TNR by each of three differential expression (DE) methods: DESeq2, MAST, and the Wilcoxon rank-sum test (Wilcox), after each of the eight doublet detection methods was applied to a simulated dataset; for negative and positive controls, we included the DE accuracies on the contaminated data with 40% doublets and the clean data without doublets. c, We re-illustrate the results in b) by showing the improved DE accuracy in each metric (precision, recall, and TNR) after removing detected doublets from the contaminated data; the results on the clean data without doublets are shown as a positive control. d, Left panel: the Jaccard index between the post-doublet-detection HVGs of each doublet-detection method and the clean HVGs under the 10%, 20%, or 40% doublet rate. The Jaccard index between the contaminated HVGs and the clean HVGs was used as negative control for each doublet rate. Right panel: illustration of the left panel; the improved Jaccard indices upon the negative controls (i.e., Jaccard index differences) after the detected doublets by each method were removed from the contaminated data. e, Cell clustering result by the Louvain algorithm after each of the eight doublet-detection method was applied to remove a varying percentage of droplets as the identified doublets (y-axis, from 0% to 25% with step size of 1%); the true numbers of cell clusters are four, six, and eight under three simulation settings, each containing 20% true doublets; the yellow color indicates that the correct number of clusters was identified, while the red color indicates otherwise. The true percentage of doublets, 20%, is highlighted in blue. For each method, its average correctness (i.e., the percent of yellow colors across all the removal percentages) is also highlighted in blue. f, Under the same three simulation settings as in a), the distributions of the singlet proportions are shown after doublet removal by each method, if the remaining droplets led to the correct number of cell clusters in a); doubletCells is not shown for the four-cluster setting because it did not lead to the correct number of cell clusters in a).
Figure 3.
Figure 3.. Effects of doublet detection on cell trajectory inference.
a, Trajectories constructed by Slingshot after each of the eight doublet-detection methods was applied to remove the identified doublets, whose percentage among all the droplets was set to 20%, the percentage of true doublets in the simulated dataset. The true cell topology is bifurcating. For negative and positive controls, we included the trajectories constructed on the original dataset with 20% doublets and its cleaned version without doublets. b, Trajectories constructed by minimum spanning tree (MST) after each of the eight doublet detection methods was applied to remove the identified doublets, whose percentage among all the droplets was set to 20%, the percentage of true doublets in the simulated dataset. The true cell topology is a conjunction of three trajectories. For negative and positive controls, we included the trajectories constructed on the original dataset with 20% doublets and its cleaned version without doublets. c, Precision, recall, and TNR of temporally differentially expressed genes identified by the general additive model (GAM) applied to trajectories constructed by Slingshot and TSCAN, after each of the eight doublet-detection method was applied to remove the identified doublets, whose percentage among all the droplets was set to 20%, the percentage of true doublets in the simulated dataset. The true cell topology is a single lineage. For negative and positive controls, we included the accuracy of temporally differentially expressed genes identified from the contaminated data with 20% doublets and the clean data without doublets. d, We re-illustrate the results in c) by showing the improved accuracy in each metric (precision, recall, and TNR) after removing detected doublets from the contaminated data; the results on the clean data without doublets are shown as a positive control.
Figure 4.
Figure 4.. Comparison of doublet detection methods in terms of distributed computing, running time, scalability, and stability.
a-b, Distributed computing performance of each method on two real datasets pbmc-ch and pmc-2ctrl-dm. We first divided the original datasets into varying numbers of batches with equal sizes; then we applied each method to individual batches separately to identify and remove doublets; finally we pooled batches together to assess the detection accuracy (AUPRC and AUROC values) of each method. The legend on the right applies to both panels a and b. c, Distribution of running time in (natural log) seconds of each method across 16 real datasets. d, Mean AUPRC vs. mean running time (across 16 real datasets) of eight doublet-detection methods. e, Scalability of each method. We calculated the relationship between running time and droplet number for each method on simulated datasets with varying droplet numbers. f, Stability of each method. We generated 20 datasets by randomly subsampling 90% droplets and 90% genes from the real datasets pbmc-ch and pbmc-2ctrl-dm, and we applied each method to all the subsampled datasets. For each real dataset, the distribution of AUPRC values of each method across subsampling is shown, with 25% quantiles connected. We use the variance of the distribution to measure the stability of each method.
Figure 5.
Figure 5.
A graphical summary of benchmark results. The four aspects related to doublet detection accuracy are marked in blue, while the other five aspects related to software implementation are marked in black.

References

    1. Allaire JJ et al. (2018) ‘reticulate: Interface to’Python’’, R package version, 1(8).
    1. Amezquita RA et al. (2019) ‘Orchestrating single-cell analysis with Bioconductor’, Nature Methods. doi: 10.1038/s41592-019-0654-x. - DOI - PMC - PubMed
    1. Andrews TS and Hemberg M (2018) ‘False signals induced by single-cell imputation’, F1000Research, p. 1740. doi: 10.12688/f1000research.16613.1. - DOI - PMC - PubMed
    1. Bais AS and Kostka D (2019) ‘scds: computational annotation of doublets in single-cell RNA sequencing data’, Bioinformatics. doi: 10.1093/bioinformatics/btz698. - DOI - PMC - PubMed
    1. Bernstein NJ et al. (2020) ‘Solo: Doublet Identification in Single-Cell RNA-Seq via Semi-Supervised Deep Learning’, Cell systems, 11(1), pp. 95–101.e5. - PubMed

Publication types