. 2020 Dec 17;80(6):1013-1024.e6.
doi: 10.1016/j.molcel.2020.11.040.

A Surge of DNA Damage Links Transcriptional Reprogramming and Hematopoietic Deficit in Fanconi Anemia

Affiliations

A Surge of DNA Damage Links Transcriptional Reprogramming and Hematopoietic Deficit in Fanconi Anemia

Xi Shen et al. Mol Cell. .

Abstract

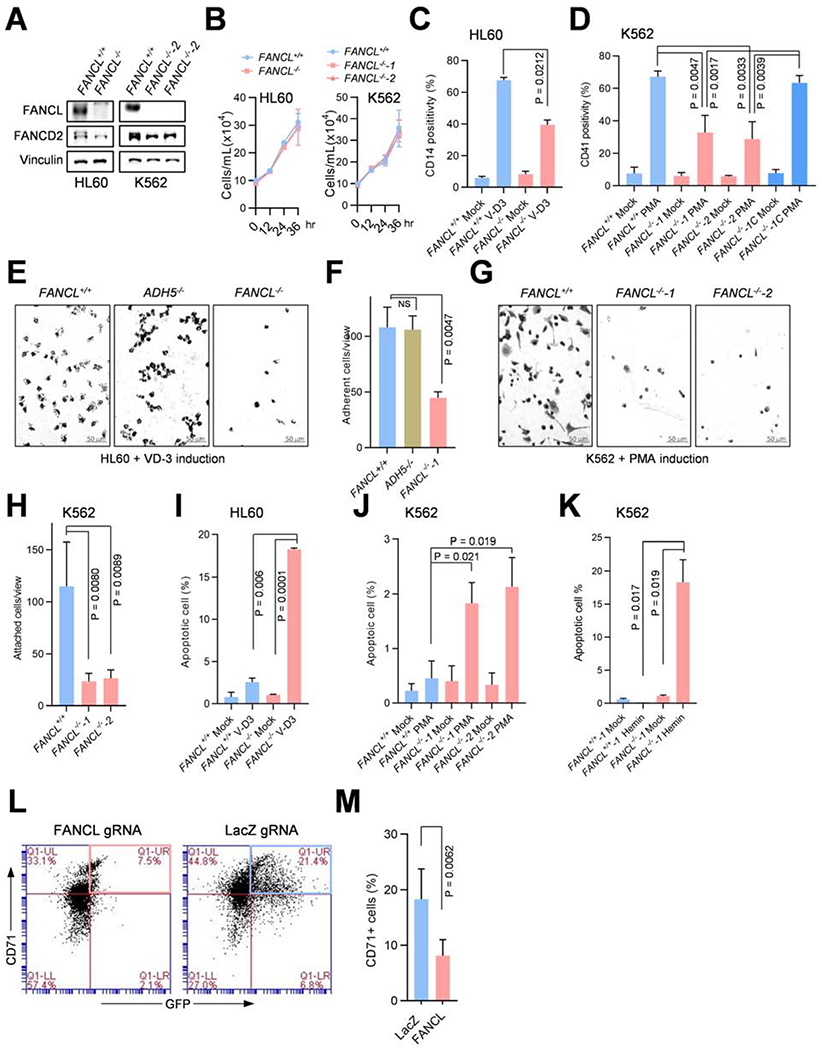
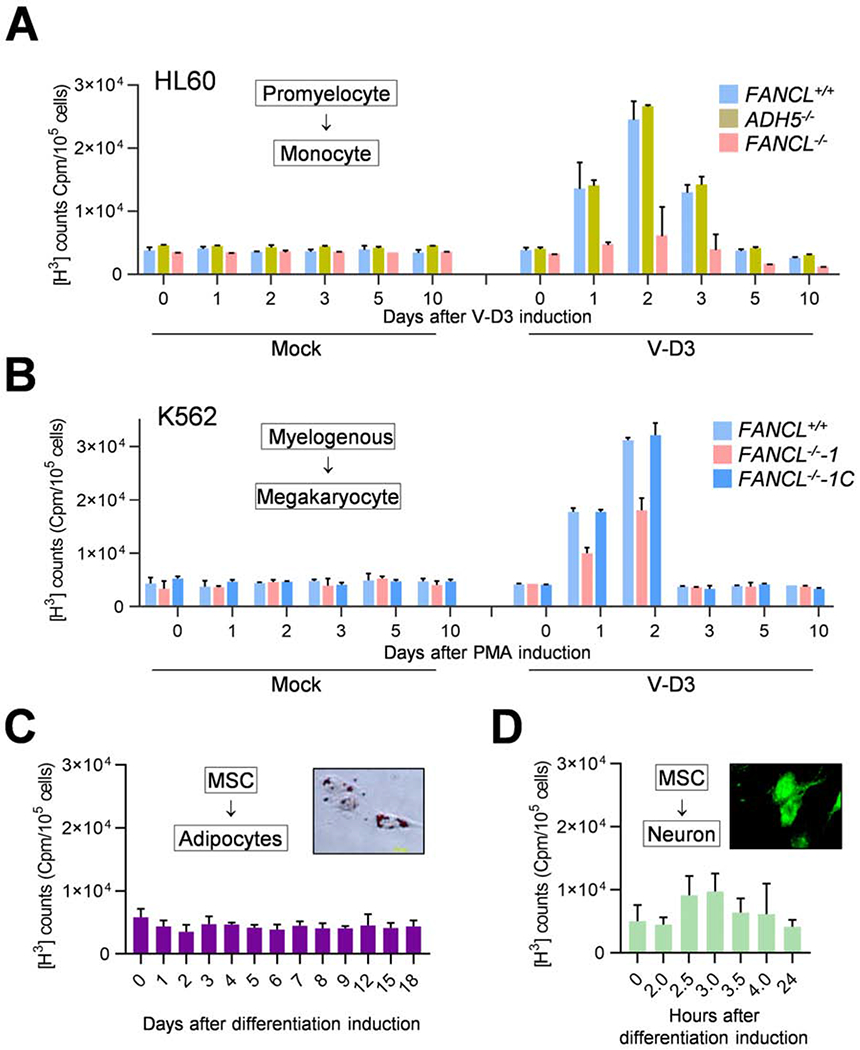
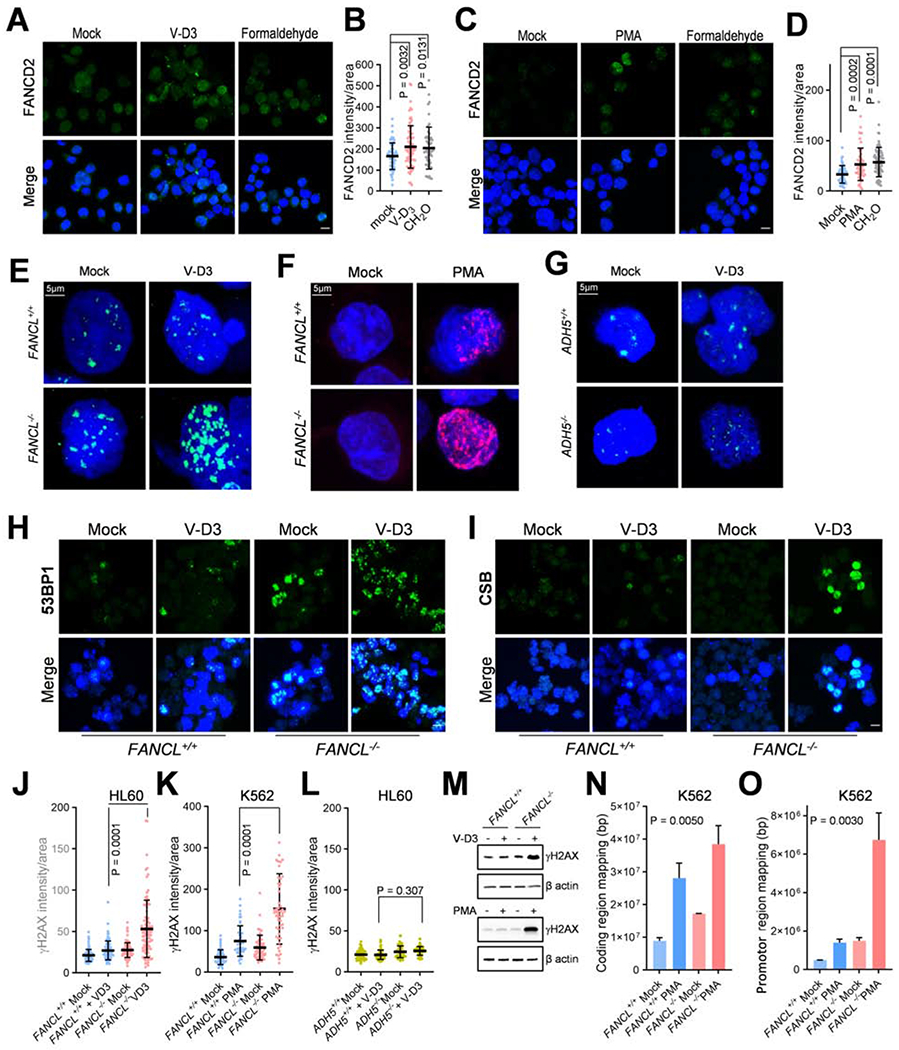
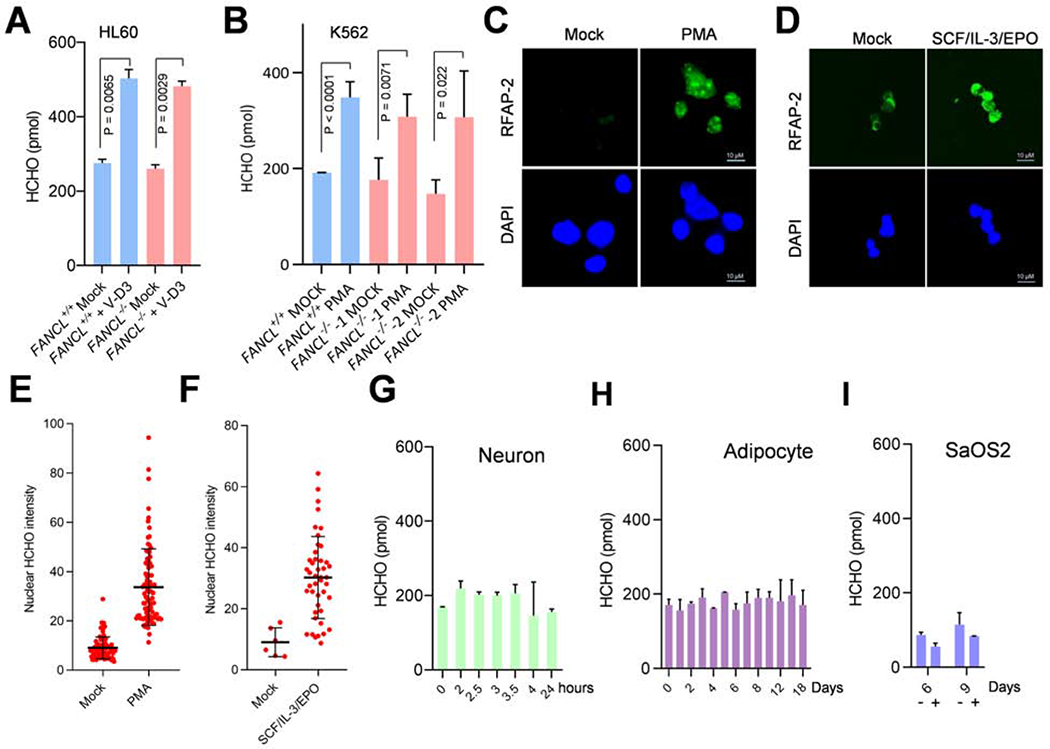
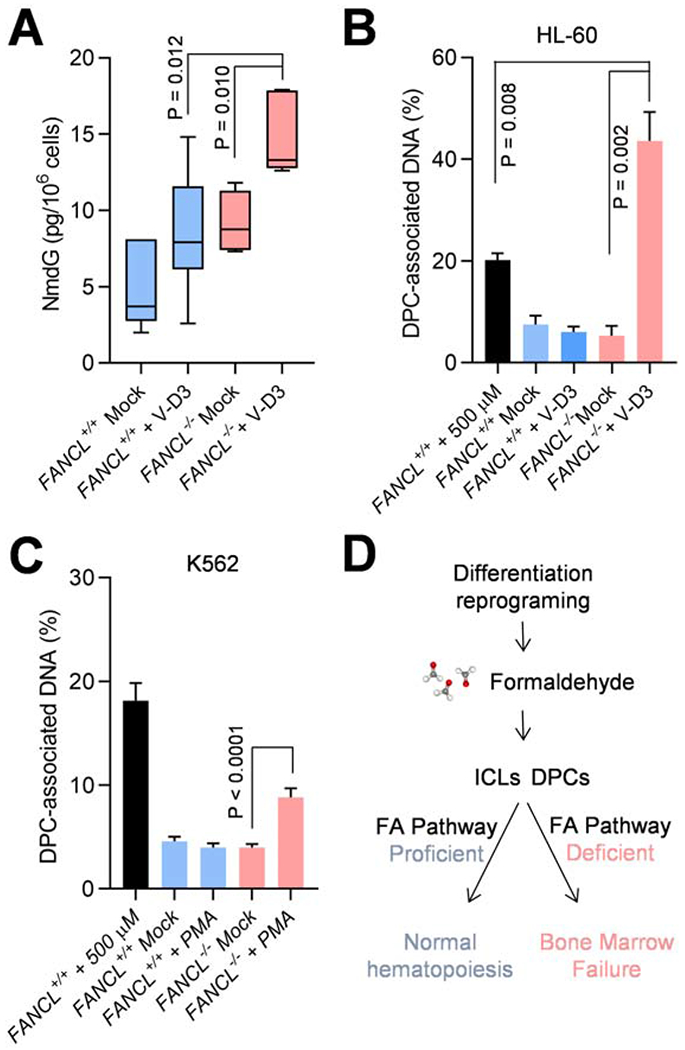
Impaired DNA crosslink repair leads to Fanconi anemia (FA), characterized by a unique manifestation of bone marrow failure and pancytopenia among diseases caused by DNA damage response defects. As a germline disorder, why the hematopoietic hierarchy is specifically affected is not fully understood. We find that reprogramming transcription during hematopoietic differentiation results in an overload of genotoxic stress, which causes aborted differentiation and depletion of FA mutant progenitor cells. DNA damage onset most likely arises from formaldehyde, an obligate by-product of oxidative protein demethylation during transcription regulation. Our results demonstrate that rapid and extensive transcription reprogramming associated with hematopoietic differentiation poses a major threat to genome stability and cell viability in the absence of the FA pathway. The connection between differentiation and DNA damage accumulation reveals a novel mechanism of genome scarring and is critical to exploring therapies to counteract the aplastic anemia for the treatment of FA patients.

Keywords: DNA damage; Fanconi anemia; bone marrow failure; differentiation; formaldehyde; hematopoiesis; transcription reprogramming.


Conflict of interest statement

Declaration of Interests The authors declare no conflict of interests.

Figures

Fig. 1.
Fig. 1.. Disruption of the FA pathway attenuates hematopoietic cellular differentiation and causes cell death.
(A) FANCL−/− cells generated via CRISPR/CAS9 in HL60 and K562 cells. Parental FANCL+/+ and FANCL−/− mutant cells were exposed to mitomycin C (MMC; 200 nM, 12 hours) prior to harvesting, and cell extracts were immunoblotted with FANCL (top panels) and FANCD2 (middle panels). *Corresponds to a non-specific band detected by the FANCL antibody in K562 cells. (B) Proliferation of FANCL+/+ and FANCL−/− HL60 (left) and K562 (right) cells. Cell growth analyses were performed within log phase range. (C) Differentiation of HL60 FANCL+/+ and FANCL−/− cells into monocytes was induced by V-D3 treatment or mock induction. The extent of differentiation was determined by CD14 positivity via flow cytometry. (D) Differentiation of K562 FANCL+/+, FANCL−/− knockout mutants (FANCL−/−-1 and FANCL−/−-2), and the FANCL−/−-1 mutant complemented with wild-type FANCL cDNA stable expression (FANCL−/−-1C) was induced by PMA. The extent of differentiation into megakaryocytes was determined by CD41 positivity via flow cytometry. (E) Yields of adherant monocytes from FANCL+/+, ADH5−/−, and FANCL−/− HL60 cells induced by V-D3. Adherent cells were visualized by crystal violet staining 7 days after V-D3 treatment. (F) Quantification of experiments as shown in (E). (G) Yields of adherant megakaryocytes from FANCL+/+, FANCL−/−-1 and FANCL−/−-2 K562 cells induced by PMA. Adherent cells were visualized the crystal violet staining 5 days after PMA treatment. (H) Quantification of experiments as shown in (G). (I) Apoptosis of FANCL+/+ and FANCL−/− HL60 cells induced to differentiate into monocytes by V-D3 treatment (5 days). (J) Apoptosis of FANCL+/+ and FANCL−/− K562 cells induced to differentiate into megakaryocytes by PMA treatment (3 days). (K) Apoptosis of FANCL+/+ and FANCL−/− K562 cells induced to differentiate into erythroids by hemin treatment (5 days). (L) CD71- and GFP-positive cell population as measured by bivariate flow cytometry. CD34+ human cord blood cells were co-transfected with the LentiCRISPRv2GFP and gRNA vectors expressing FANCL gRNA (left) or LacZ gRNA as a control (right). Erythroid induction was initiated by SCF/IL-3/EPO incubation for 5 days before cell harvesting for FACS analyses. (M) Quantification of (L) from three biological repeats. P values were generated from unpaired t-tests. Error bars represent standard deviations from three or more biological repeats with duplicates or triplicates.
Fig. 2.
Fig. 2.. FA pathway function is required to protect transcription reprograming of progenitor cell differentiation.
(A) Transcription activities in FANCL+/+, ADH5−/−, and FANCL−/− HL60 cells at the indicated times after V-D3 treatment or mock-treatment, as measured by transient [3H]-uridine incorporation into cellular RNA. (B) Transcription activities in FANCL+/+, FANCL−/−-1, and the complemented FANCL−/− mutant (FANCL−/−-1C) K562 cells at the indicated times after PMA treatment or mock treatment, measured as in (A). (C) Transcription activities of MSCs differentiating to adipocytes at the indicated times after induction, measured as in (A). The inset figure shows representative adipocytes differentiated from MSCs, visualized by oil red-O staining of fatty acids. The adipogenic differentiation was induced by the combination of dexamethasone/indomethacin/IMBX. (D) Transcription activities of MSC cells differentiating to neuron-like cells at the indicated times, measured as in (A). The inset figure shows representative neuron-like cells differentiated from MSCs, visualized by immunofluorescent staining of the mature neuron marker NeuN. The neuronal differentiation was induced by sequential treatment with bFGF and β-mercaptoethanol. Error bars representing standard deviations were derived from three or more biological repeats.
Fig. 3.
Fig. 3.. Loss of FANCL elevates DNA damage in differentiating progenitor cells.
(A) FANCD2 foci in HL60 cells treated with V-D3 to initiate monocyte differentiation or formaldehyde (CH2O, 500 μM) for 8 hrs. Mock treated cells were used as a negative control. Bar = 10 μm. (B) Quantified results as in (A) from three independent experiments. (C) FANCD2 focus in K562 cells treated with PMA to initiate megakaryocyte differentiation or formaldehyde (CH2O, 500 μM) for 8 hrs. Mock treated cells were used as a negative control. (D) Quantified results as in (C) from three independent experiments. (E) γH2AX foci in HL60 FANCL+/+ and FANCL−/− cells treated with V-D3 for 3 days. (F) γH2AX foci in K562 FANCL+/+ and FANCL−/− cells treated with PMA for 3 days. (G) γH2AX foci in HL60 ADH5+/+ and ADH5−/− cells treated with V-D3 for 3 days. (H) 53BP1 focus formation in HL60 FANCL+/+ and FANCL−/− cells treated with V-D3 to initiate monocyte differentiation for 3 days. (I) CSB foci in HL60 FANCL+/+ and FANCL−/− cells treated with V-D3 to initiate monocyte differentiation for 7 days. (J) Quantification of γH2AX nuclear fluorescence intensity in experiment shown in (E). K) Quantification of γH2AX nuclear fluorescence intensity in experiment shown in (F). (L) Quantification of γH2AX nuclear fluorescence intensity in experiment shown in (G). P values were generated from unpaired t-tests with three or more biological repeats. Error bars represent standard deviations. (M) Immunoblotting of γH2AX in mutant cells with indicated genotypes. Top: HL60 FANCL+/+ and FANCL−/− cells upon 3-day treatment with V-D3. Bottom: K562 FANCL+/+ and FANCL−/− cells upon 3-day treatment with PMA. (N) γH2AX ChIP-Seq analysis of K562 FANCL+/+ and FANCL−/− cells upon 3-day treatment with PMA. The SUM of peak sequences mapped to coding regions are shown for each sample. (O) γH2AX ChIP-Seq analysis of K562 FANCL+/+ and FANCL−/− cells upon 3-day treatment with PMA. The SUM of peak sequences mapped to promoter regions (±2 kb of transcription start sites) are shown for each sample. Error bars were generated from duplicated samples and P values were generated by one-way ANOVA analyses.
Fig. 4.
Fig. 4.. Differentiation-dependent formaldehyde release in hematopoietic progenitor cells.
(A) Intracellular formaldehyde concentration in HL60 FANCL+/+ and FANCL−/− cells 3 days after V-D3 treatment. The formaldehyde concentrations are obtained by using a fluorometric assay on cell lysate. (B) Intracellular formaldehyde concentration in K562 FANCL+/+ and FANCL−/− cells induced to differentiate into megakaryocytes by PMA treatment. Cells were harvested after 3 days and measured as in (A). (C) Detection of nuclear formaldehyde in PMA-treated (48 hrs) K562 cells by staining with the formaldehyde fluorescent probe RFAP-2. Confocal images were acquired from permeabilized nuclei preparations. (D) Detection of nuclear formaldehyde in SCF/IL-3/EPO-treated (72 hrs) CD34+ primary HSCs cells. Confocal images were acquired as in (C). (E) Quantification of nuclear fluorescence signal as shown in (C). (F) Quantification of nuclear fluorescence signal as shown in (D). (G) Intracellular formaldehyde concentration of MSC cells driven to neuron-like cells. Samples were collected at indicated times (days) upon differentiation induction by the bFGF/β-mercaptoethanol combination and measured as in (A). (H) Intracellular formaldehyde concentration of MSC cells driven to adipocytes. Samples were collected at indicated times (days) upon differentiation induction by the dexamethasone/indomethacin/IMBX combination and measured as in (A). (I) Intracellular formaldehyde concentration of SaOS2 osteoblasts driven to osteocytes. Samples were collected at indicated times (days) upon differentiation induction by the ascorbic acid/β-glycerophosphate combination (+) or control (−) and measured as in (A). P values were generated from unpaired t-tests with three or more biological repeats. Error bars represent standard deviations.
Fig. 5.
Fig. 5.. DPC damage accumulation in FANCL mutant cells during hematopoietic differentiation.
(A) Amount of NmdG in HL60 FANCL+/+ and FANCL−/− cells 5 days after V-D3 treatment, as measured by mass spectrometry using 13C-NmdG as standard. P values are derived from two-tailed Student’s t-test. (B) Analyses of DPCs in HL60 FANCL+/+ and FANCL−/− cells 5 days after V-D3 induction. The first sample represents FANCL+/+ cells exposed to extracellular formaldehyde (500 μM, 4 hr). DPCs in the genomic DNA were measured by a modified KCl/SDS precipitation assay. (C) Analyses of DPCs in K562 FANCL+/+ and FANCL−/− cells 3 days after PMA induction. The first sample represents FANCL+/+ cells exposed to extracellular formaldehyde (500 μM, 4 hr). DPCs in the genomic DNA were measured by a modified KCl/SDS precipitation assay. (D) A model depicting the role of differentiation reprogramming in the pathogenesis of Fanconi anemia. P values were generated from unpaired t--tests with three or more biological repeats. Error bars represent standard deviations.

Comment in

References

    1. Armstrong L, Stojkovic M, Dimmick I, Ahmad S, Stojkovic P, Hole N, and Lako M (2004). Phenotypic characterization of murine primitive hematopoietic progenitor cells isolated on basis of aldehyde dehydrogenase activity. Stem Cells 22, 1142–1151. - PubMed
    1. Brewer TF, Burgos-Barragan G, Wit N, Patel KJ, and Chang CJ (2017). A 2-aza-Cope reactivity-based platform for ratiometric fluorescence imaging of formaldehyde in living cells. Chem Sci 8, 4073–4081. - PMC - PubMed
    1. Ceccaldi R, Sarangi P, and D’Andrea AD (2016). The Fanconi anaemia pathway: new players and new functions. Nature Reviews Molecular Cell Biology 17, 337. - PubMed
    1. Costa M, Zhitkovich A, Gargas M, Paustenbach D, Finley B, Kuykendall J, Billings R, Carlson TJ, Wetterhahn K, Xu J, et al. (1996). Interlaboratory validation of a new assay for DNA-protein crosslinks. Mutat Res 369, 13–21. - PubMed
    1. D’Andrea AD (2010). Susceptibility pathways in Fanconi’s anemia and breast cancer. The New England journal of medicine 362, 1909–1919. - PMC - PubMed

Publication types

MeSH terms