. 2021 Jan 7;184(1):133-148.e20.
doi: 10.1016/j.cell.2020.12.005. Epub 2020 Dec 9.

TMEM41B Is a Pan-flavivirus Host Factor

Affiliations

TMEM41B Is a Pan-flavivirus Host Factor

H-Heinrich Hoffmann et al. Cell. .

Abstract

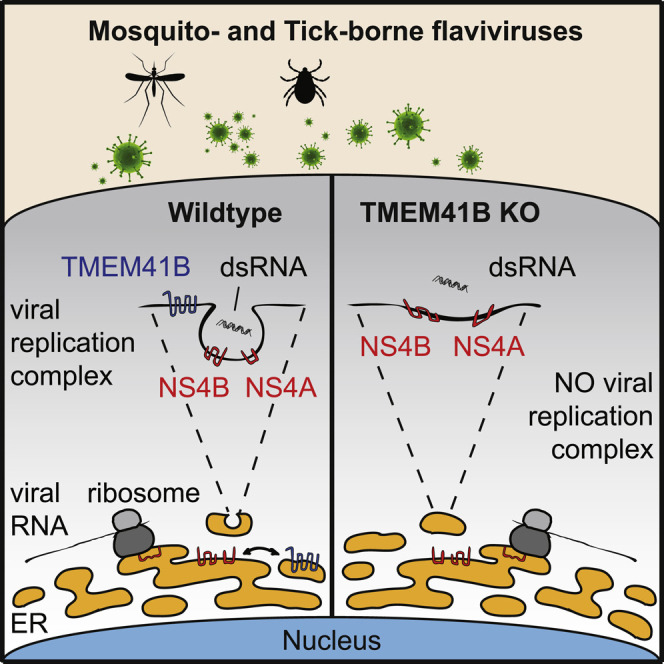
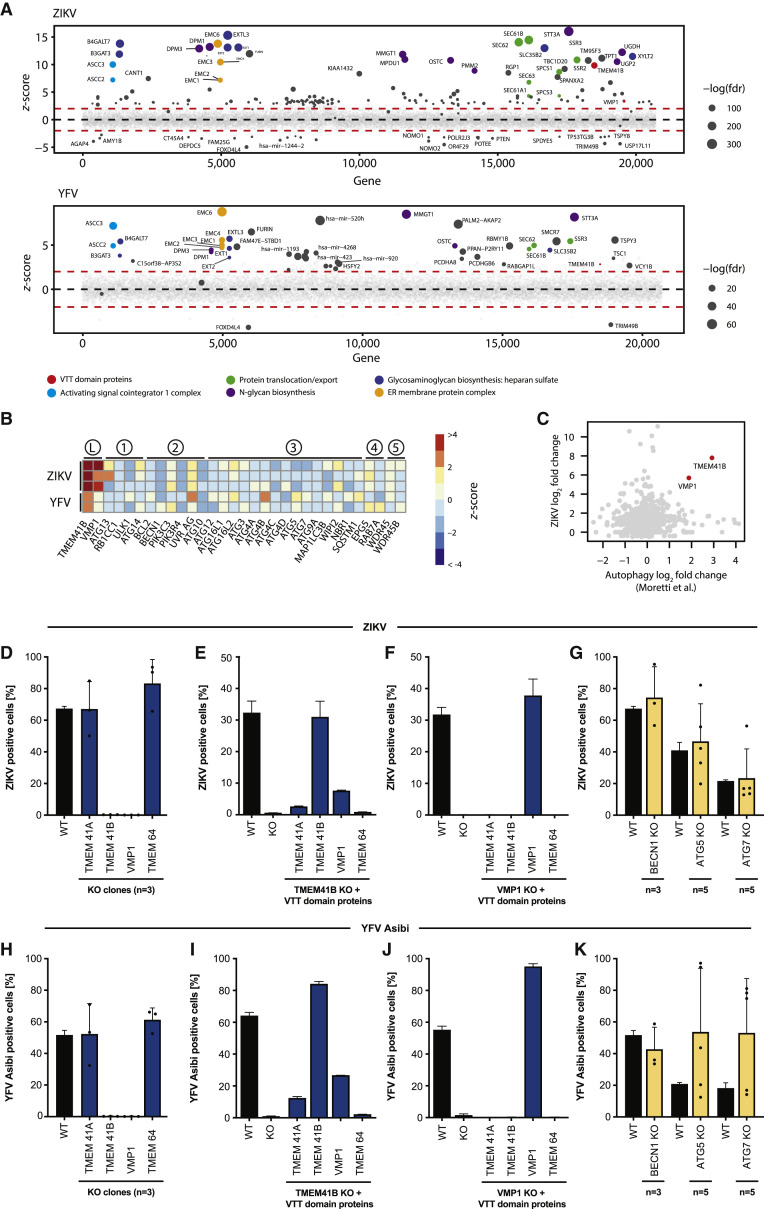
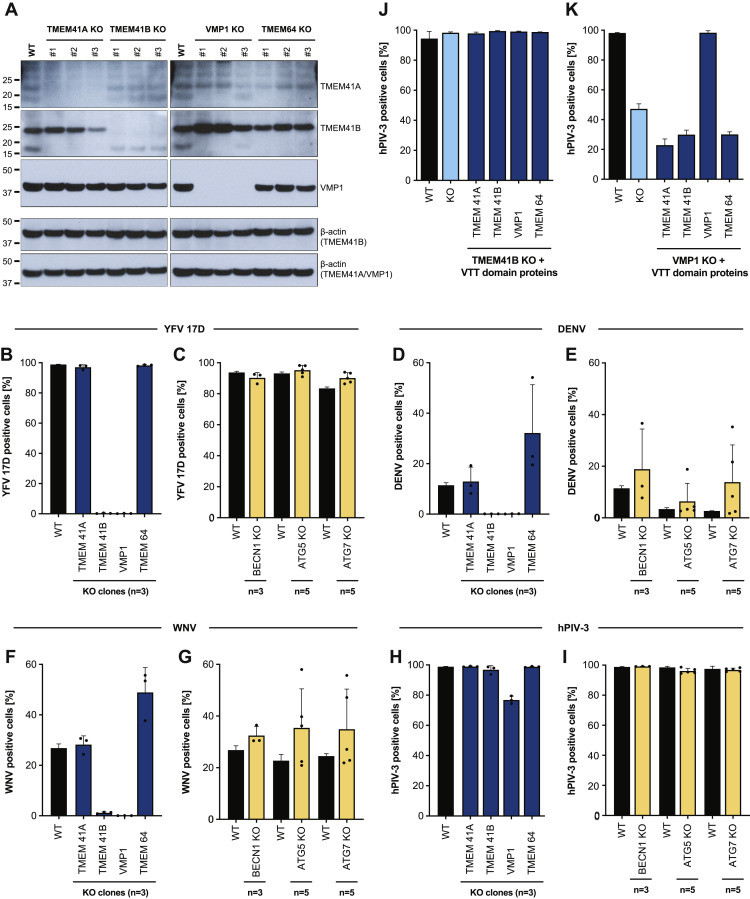
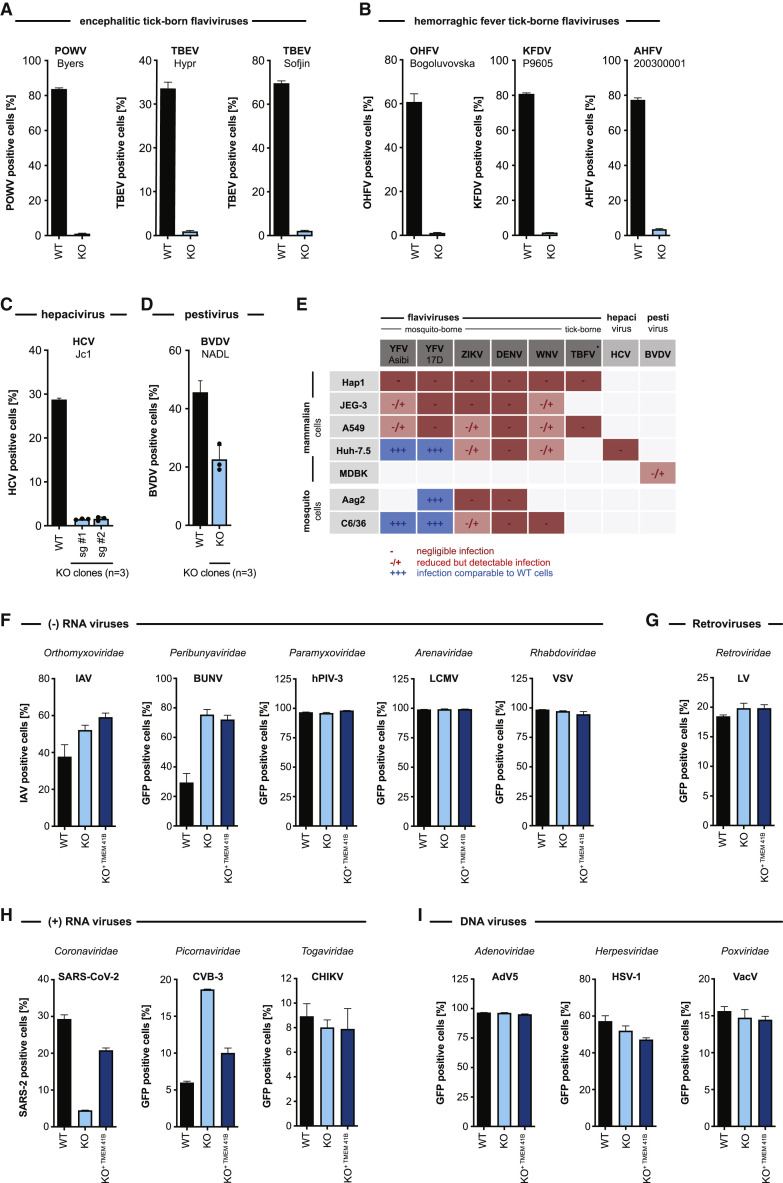
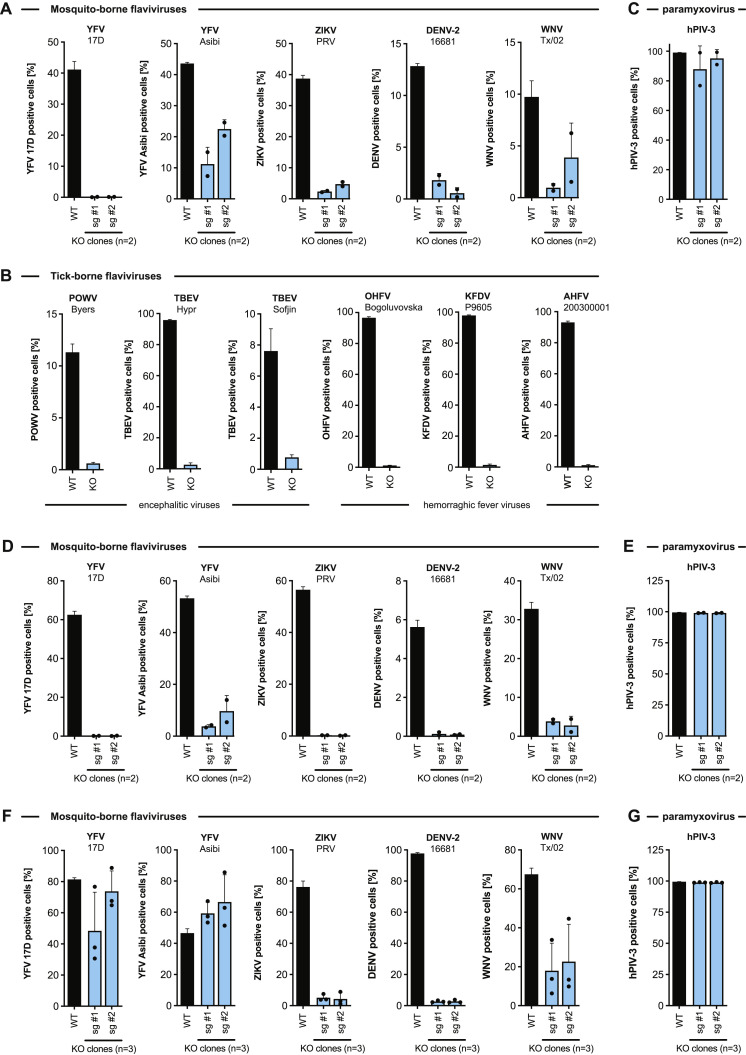
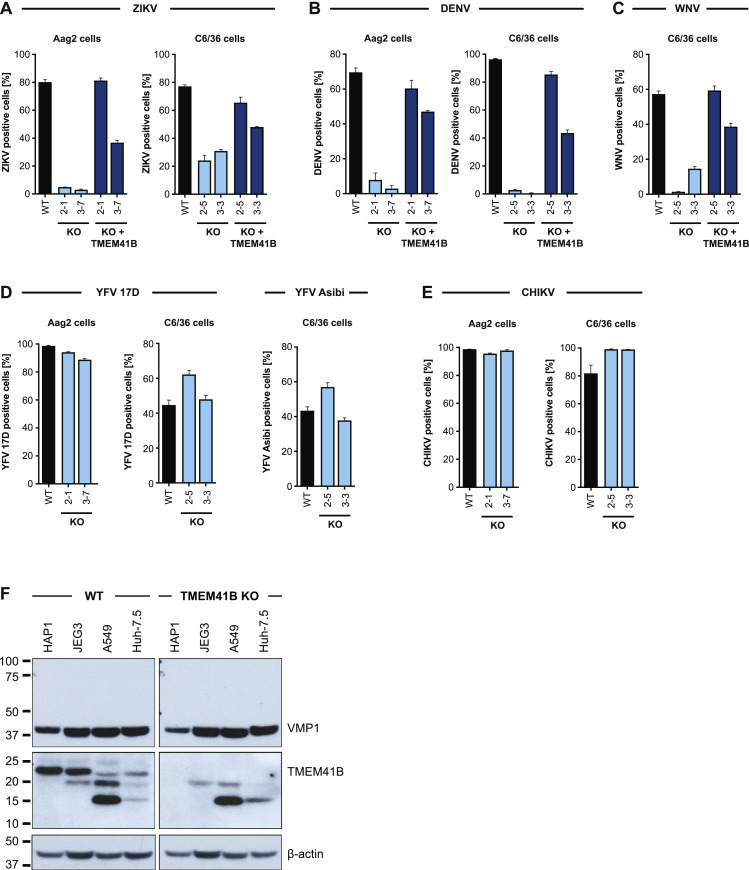
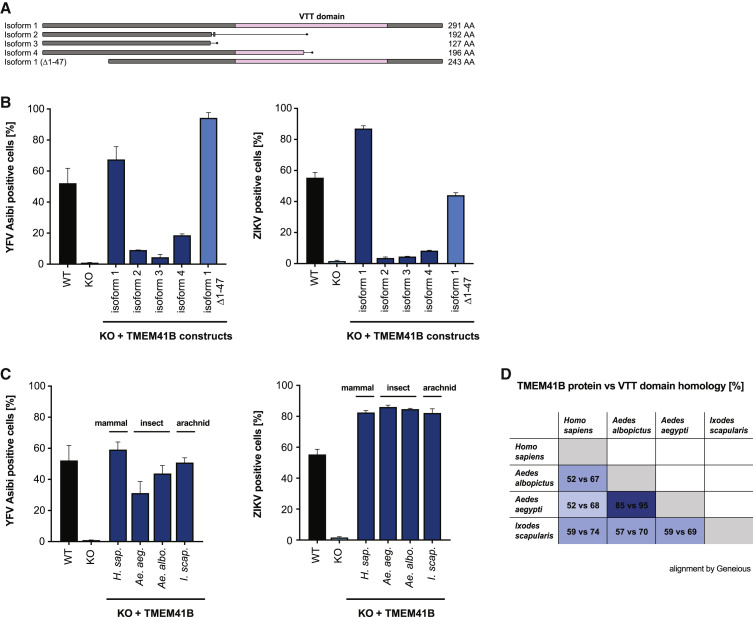
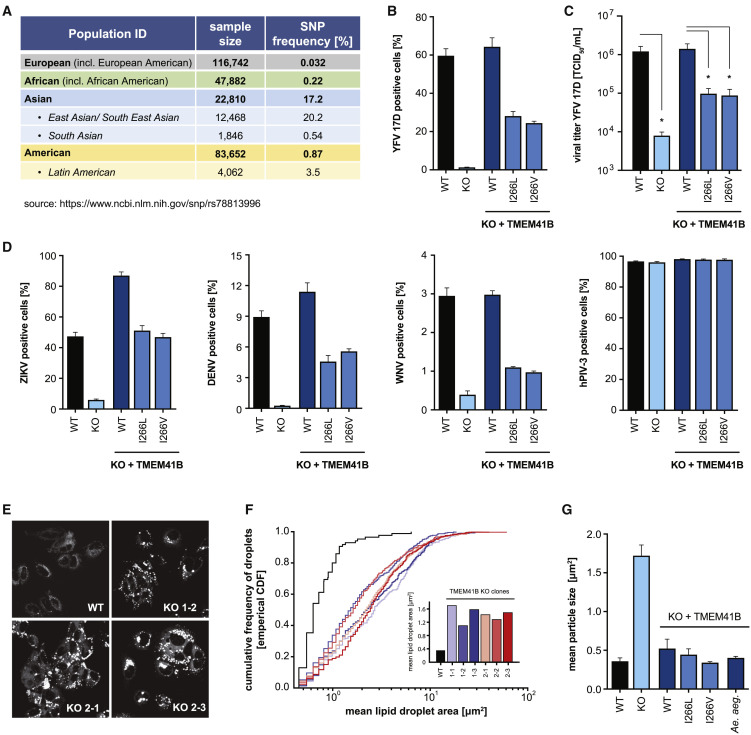
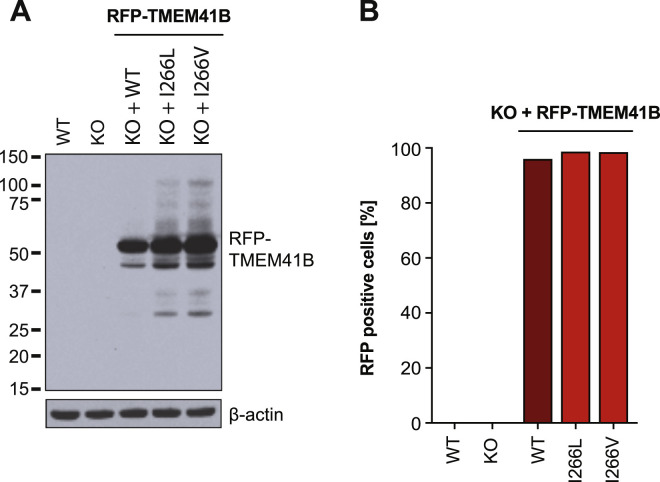
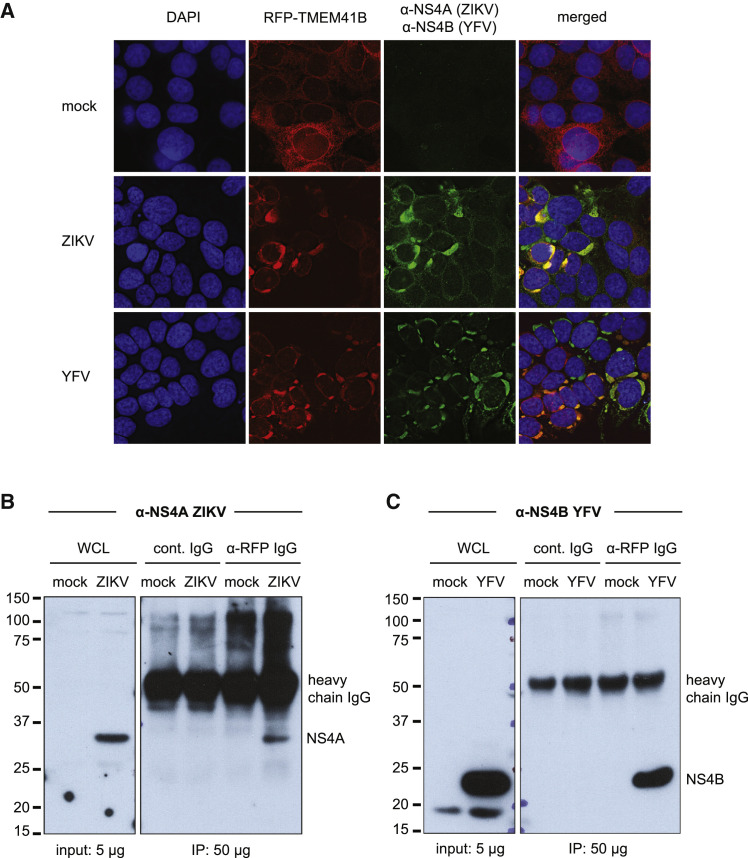
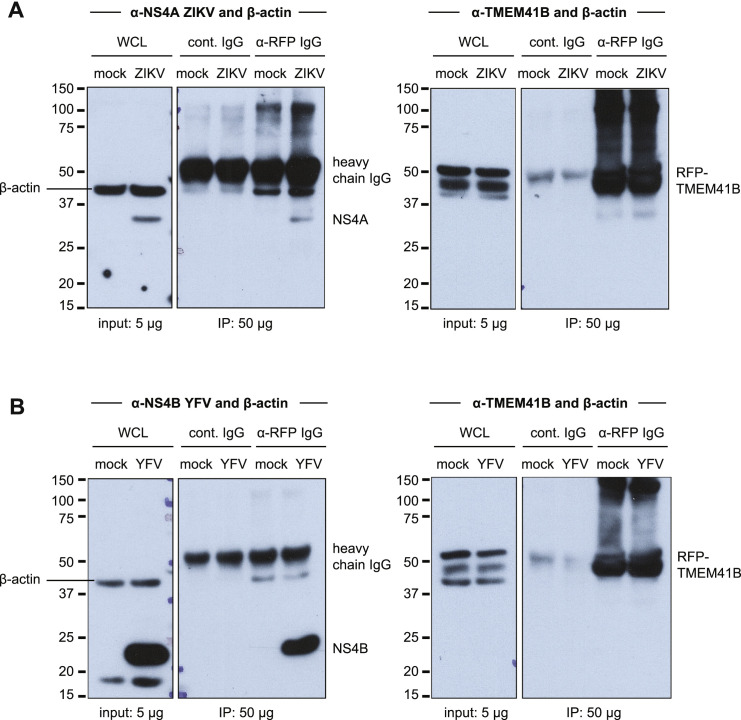
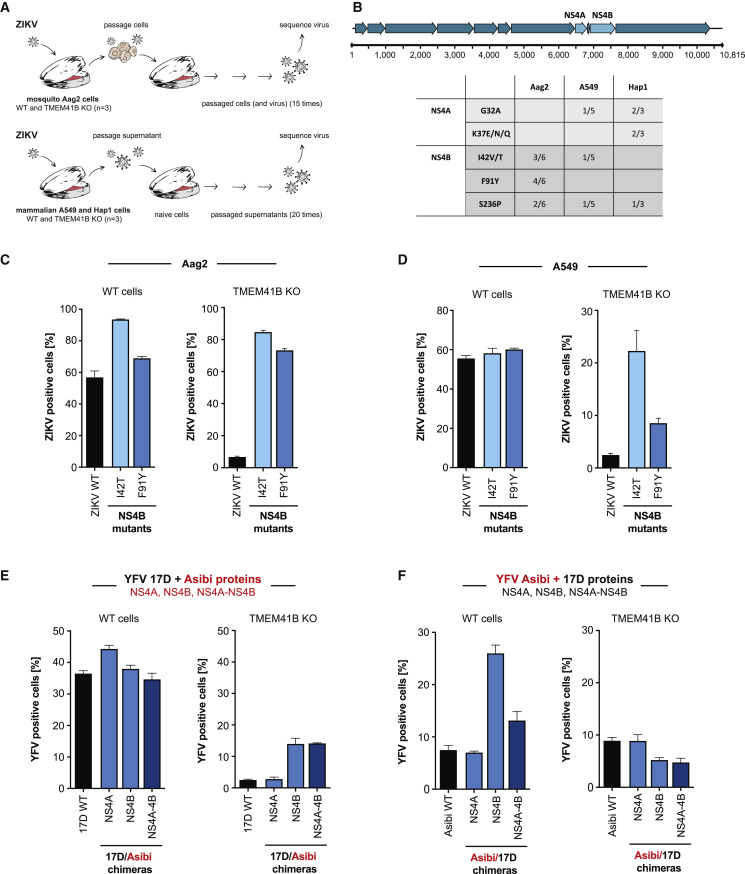
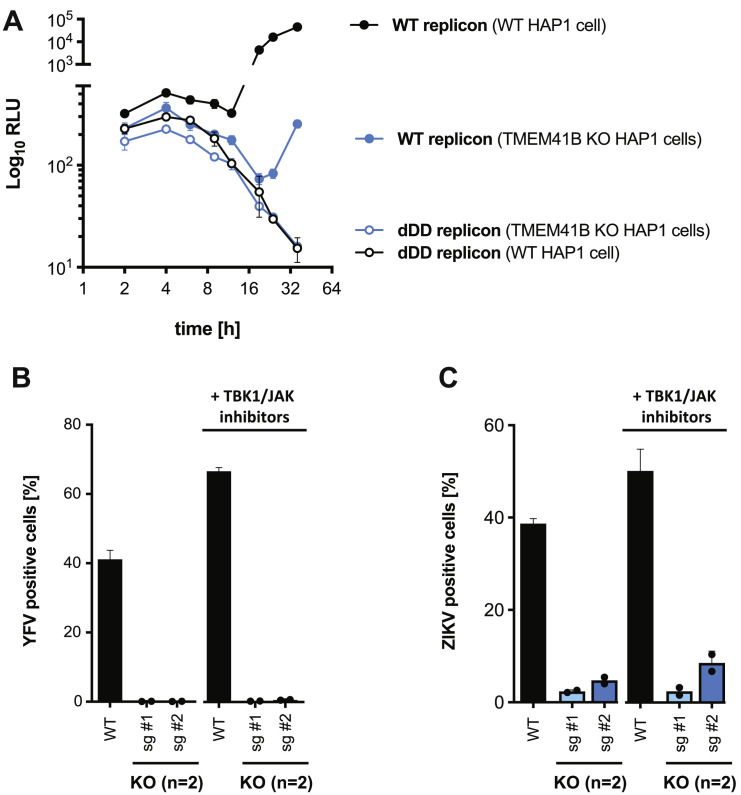
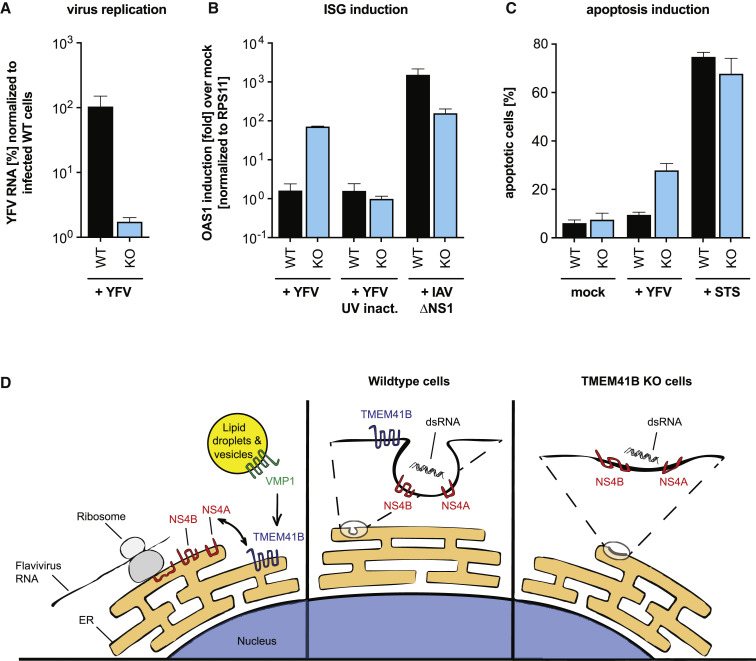
Flaviviruses pose a constant threat to human health. These RNA viruses are transmitted by the bite of infected mosquitoes and ticks and regularly cause outbreaks. To identify host factors required for flavivirus infection, we performed full-genome loss of function CRISPR-Cas9 screens. Based on these results, we focused our efforts on characterizing the roles that TMEM41B and VMP1 play in the virus replication cycle. Our mechanistic studies on TMEM41B revealed that all members of the Flaviviridae family that we tested require TMEM41B. We tested 12 additional virus families and found that SARS-CoV-2 of the Coronaviridae also required TMEM41B for infection. Remarkably, single nucleotide polymorphisms present at nearly 20% in East Asian populations reduce flavivirus infection. Based on our mechanistic studies, we propose that TMEM41B is recruited to flavivirus RNA replication complexes to facilitate membrane curvature, which creates a protected environment for viral genome replication.

Keywords: CRISPR; TMEM41B; VMP1; autophagy; coronavirus; flavivirus; flavivirus replication complex; membrane remodeling.


Conflict of interest statement

Declaration of Interests C.M. Rice is a founder of Apath LLC; a Scientific Advisory Board member of Imvaq Therapeutics, Vir Biotechnology, and Arbutus Biopharma; and an advisor for Regulus Therapeutics and Pfizer. The remaining authors declare no competing interests. C.M. Rudin serves on the Scientific Advisory Boards of Bridge Medicines, Earli, and Harpoon Therapeutics.

Figures

None
Graphical abstract
Figure 1
Figure 1
Genome-wide CRISPR-Cas9 Screens for Zika and Yellow Fever Viruses Identify TMEM41B and VMP1 as Required Host Factors (A) Bubble plot of genes significantly enriched in a genome-wide CRISPR KO screen in HAP1 cells challenged with ZIKV (top) and YFV (bottom). Colors indicate association with cellular pathways or protein complexes and domains. Red lines denote Z = ± 2. (B) Heatmap of Z scores for genes in the autophagy pathway ordered sequentially by functional role: L, lipid mobilization; 1, initiation; 2, nucleation; 3, elongation; 4, sequestration; 5, tethering/fusion. Rows represent replicate screens. (C) Scatterplot of gene-wise log2 fold change (LFC) from this study (ZIKV) versus Moretti et al. (2018) autophagy screen. (D) HAP1 WT and (n = 3) individual KO clones for VTT domain-containing proteins infected with ZIKV. (E) WT and TMEM41B KO HAP1 cells overexpressing individual VTT domain proteins infected with ZIKV. (F) Same as (E) but in VMP1 KO HAP1 cells. (G) HAP1 WT and (n = 3–5) individual KO clones for autophagy genes infected with ZIKV. (H–K) Same as (D–G) but infected with YFV Asibi. Cells were analyzed by flow cytometry and plotted as a percentage of viral antigen-positive cells. Dots in (D), (G), (H), and (K) represent the average of n = 3 replicates from individual single-cell clones. Error bars in (E), (F), (I), and (J) depict a single KO clone with standard deviation (SD) of n = 3 replicates. See also Figures S1B–S1I.
Figure S1
Figure S1
Flavivirus Infection in CRISPR KO Cells for VTT Domain and Autophagy Proteins, Related to Figure 1 (A) Western blots for TMEM41A, TMEM41B, and VMP1 in KO clones lacking individual VTT domain-containing proteins. The expected sizes are indicated by labels on the right. β-actin is shown as loading control. Gene disruption was additionally confirmed by next generation sequencing for each clone. (B) HAP1 wildtype (WT) and (n = 3) individual knockout (KO) clones for VTT domain-containing proteins infected with YFV 17D (MOI = 0.005 PFU/cell) for 48 h. (C) HAP1 WT and (n = 3-5) individual KO clones for autophagy genes infected with YFV 17D (MOI = 0.005 PFU/cell) for 48 h. (D and E) Same as panels B-C but infected with DENV-GFP (MOI = 0.1 PFU/cell) for 96 h. (F and G) Same as panels B-C but infected with WNV-GFP (MOI = 10 PFU/cell) for 72 h. (H and I) Same as panels B-C but infected with hPIV-3-GFP (MOI = 0.02 IU/cell) for 48 h. (J) TMEM41B KO HAP1 cells overexpressing individual VTT domain proteins infected with hPIV-3-GFP (MOI = 0.02 IU/cell) for 48 h. (K) VMP1 KO HAP1 cells overexpressing individual VTT domain proteins infected with hPIV-3-GFP (MOI = 0.02 IU/cell) for 72 h. Cells were analyzed by flow cytometry and plotted as a percentage of viral antigen positive cells. Dots in panels B-I represent the average of n = 3-5 replicates from individual single cell clones. Error bars in panels J-K are SD of n = 3 replicates from a single KO clone.
Figure S2
Figure S2
Western Blots Confirm Knockout of Autophagy Proteins ATG5 and ATG7 and Autophagy Defects, Related to Figure 1 (A) Western blots for ATG5 and ATG7 in HAP1 WT cells and ATG5 and ATG7 KO clones. The expected sizes are indicated by labels on the right. β-actin is shown as loading control. The anti-ATG5 antibody also recognizes the ATG5/ATG12 conjugate with a higher molecular weight band. Also shown is the differently lipidated LC3 protein (LC3 I/II), indicative of functional autophagy. (B) ATG7 KO HAP1 clones untreated (left), treated with 250 nM Torin 1 (inducer of autophagy) and 50 μM chloroquine (CQ – block of autophagosome/lysosome fusion and LC3 II turnover) (middle), and serum-starved (induction of autophagy) in Earle’s balanced salt solution (EBSS and treated with CQ) (right) (treatment for 6 h). β-actin is shown as loading control. Functional autophagy and autophagy induction are observed by the appearance of LC3 II, which is absent at baseline in ATG5 and ATG7 KO clones and also upon induction in ATG7 KO clones.
Figure 2
Figure 2
TMEM41B Is a Pan-flavivirus Host Factor (A–D) (A) WT and TMEM41B KO HAP1 cells infected with encephalitic or hemorrhagic fever tick-borne flaviviruses. (C) WT and TMEM41B KO Huh-7.5 clones infected with HCV. (D) WT and TMEM41B KO MDBK clones infected with BVDV. For (C) and (D) dots represent the average of n = 3 replicates from individual single cell clones. Virus strain is indicated in the figure. Error bars in (A) and (B) show SD for n = 6 replicates. Error bars in (C) and (D) show SD for n = 3 replicates (WT) and individual KO clones. (E) Table summarizing results shown in Figure 2 (A–D), Figure S3 (A, B, D, F), and Figure S4 (A–D) from infection experiments with multiple viruses in various mammalian and mosquito cell lines. TBFV, tick-born flaviviruses of (A) and (B); +++, infection comparable to WT cells; +/−, reduced but detectable infection; −, negligible infection. (F–I) WT, TMEM41B KO, and reconstituted HAP1 cells infected with (−) sense RNA viruses (F); VSV-G-pseudotyped HIV-1 lentivirus (LV-GFP) (G); (+) sense RNA viruses (H); or DNA viruses (I). Cells were analyzed by flow cytometry and plotted as a percentage of viral antigen-positive cells or GFP/RFP-positive cells for reporter viruses expressing a fluorescent protein. Error bars depict SD for n = 3 replicates or the indicated number of clones.
Figure S3
Figure S3
Flavivirus Infections in Mammalian TMEM41B KO Cells, Related to Figure 2 (A) WT and TMEM41B KO A549 clones generated with two independent sgRNAs infected with mosquito-borne flaviviruses: YFV 17D, MOI = 0.025 PFU/cell for 48 h; YFV Asibi, MOI = 0.05 PFU/cell for 72 h; ZIKV, MOI = 0.05 PFU/cell for 48 h; DENV-GFP, MOI = 0.1 PFU/cell for 48 h; WNV-GFP, MOI = 1 PFU/cell for 72 h. (B) WT and TMEM41B KO A549 clones infected for 48 h with tick-borne flaviviruses at MOIs of 0.02 PFU/cell. (C) WT and TMEM41B KO A549 clones infected for 48 h with hPIV-3-GFP, MOI = 0.02 IU/cell. (D) WT and TMEM41B KO JEG3 clones generated with two independent sgRNAs infected with mosquito-borne flaviviruses: YFV 17D, MOI = 0.025 PFU/cell for 48 h; YFV Asibi, MOI = 0.05 PFU/cell for 72 h; ZIKV, MOI = 0.025 PFU/cell for 48 h; DENV-GFP, MOI = 0.1 PFU/cell for 72 h; WNV-GFP, MOI = 0.1 PFU/cell for 48 h. (E) WT and TMEM41B KO JEG3 clones infected for 48 h with hPIV-3-GFP, MOI = 0.02 IU/cell. (F) WT and TMEM41B KO Huh-7.5 clones generated with two independent sgRNAs infected with mosquito-borne flaviviruses: YFV 17D, MOI = 0.0025 PFU/cell for 48 h; YFV Asibi, MOI = 0.0025 PFU/cell for 48 h; ZIKV, MOI = 0.01 PFU/cell for 48 h; DENV-GFP, MOI = 0.01 PFU/cell for 72 h; WNV-GFP, MOI = 0.01 PFU/cell for 48 h. (G) WT and TMEM41B KO Huh-7.5 clones infected for 48 h with hPIV-3-GFP, MOI = 0.02 IU/cell. Error bars depict SD for n=3 replicates or the indicated number of clones.
Figure S4
Figure S4
Flavivirus Infections in Mosquito TMEM41B KO Cells, Related to Figure 2 (A–C) WT and TMEM41B KO and KO reconstituted Aag2 and C6/36 mosquito cell clones generated with independent sgRNAs infected with: ZIKV, MOI = 0.05 PFU/cell for 72 h; DENV, MOI = 0.2 PFU/cell for 96 h; WNV-GFP, MOI = 10 PFU/cell for 72 h. (D and E) Same as A-C but without TMEM41B reconstitution. YFV 17D, MOI = 10 PFU/cell for 72 h; YFV Asibi, MOI = 0.5 PFU/cell for 72 h; CHIKV, MOI = 0.1 PFU/cell for 72 h (Aag2) and 0.05 PFU/cell for 48 h (C6/36). CHIKV was included as a non-flavivirus control. (F) Western blot to detect TMEM41B and VMP1 in lysates from indicated cell lines. β-actin is included as a loading control. Cells were analyzed by flow cytometry and plotted as a percentage of viral antigen positive cells or GFP/RFP positive cells for reporter viruses expressing a fluorescent protein. Panels A-E, error bars depict SD for n=3 replicates or the indicated number of clones.
Figure 3
Figure 3
Functional TMEM41B Is Conserved across Mammalian and Vector Species (A) Graphical representation of human TMEM41B isoforms and deletion construct. VTT domain is shaded pink. Amino acid length of each isoform is indicated. (B and C) (B) WT, TMEM41B KO, and TMEM41B KO cells expressing human TMEM41B isoforms or (C) mosquito or tick TMEM41B orthologs, infected with YFV Asibi or ZIKV as indicated. (D) Table comparing homology between human TMEM41B (isoform 1) and mosquito and tick TMEM41B orthologs. Numbers indicate percent amino acids identity for the full-length protein versus VTT domain only. Protein sequences were aligned using Geneious Software (Geneious 8.1.9. https://www.geneious.com). Cells were analyzed by flow cytometry and plotted as a percentage of viral antigen-positive cells. Error bars depict SD for n = 3 replicates.
Figure 4
Figure 4
Naturally Occurring TMEM41B SNPs Negatively Impact Flavivirus Infection but Can Maintain Normal Lipid Distribution in Cells (A) Table shows the frequency of a SNP (rs78813996) in TMEM41B in several human populations. (B) WT, TMEM41B KO, and TMEM41B KO HAP1 cells expressing WT or TMEM41B SNP variants infected with YFV 17D. Cells were analyzed by flow cytometry and plotted as a percentage of viral antigen-positive cells. (C) Infected as in (B), and supernatants were collected and titrated by tissue culture infectious dose (TCID50/mL) assay on Huh-7.5 cells. The two-tailed statistical Student’s t test was used to determine statistical significance and is depicted with an asterisk indicating a p value < 0.05. (D) Same as (B) infected with ZIKV, DENV-GFP, WNV-GFP, and hPIV-3-GFP. (E) WT and TMEM41B KO Huh-7.5 cell clones stained with Nile red to visualize lipid droplets. (F) Cumulative frequency of droplets plotted versus droplet area (μm2) for six independent single-cell clones generated with two independent sgRNAs. Inset shows the mean lipid droplet area (μm2) for the six TMEM41B KO clones compared to WT Huh-7.5 cells. (G) Mean lipid droplet area (μm2) for WT, TMEM41B KO, and TMEM41B KO Huh-7.5 cells (clone 1-1) expressing the indicated TMEM41B variants. Cells were analyzed by flow cytometry and plotted as a percentage of viral antigen positive cells. Error bars depict SD for n = 3 replicates.
Figure S5
Figure S5
Expression of tagRFP-TMEM41B in Reconstituted TMEM41B KO HAP1 Cells, Related to Figure 4 (A) Western blot to detect RFP-TMEM41B in HAP1 cell lysates. Predicted size is indicated by the location of the label. β-actin is included as a loading control. (B) Flow cytometry analysis to quantify the percentage of RFP-TMEM41B cells.
Figure 5
Figure 5
TMEM41B Co-localizes with Flavivirus NS4A and NS4B Proteins (A) TMEM41B KO HAP1 cells expressing RFP-TMEM41B visualized in uninfected cells (mock) and YFV- and ZIKV-infected cells 24 h post infection. Anti-NS4A (ZIKV) and anti-NS4B (YFV) antibodies detect viral antigens. Yellow-orange color in the merged column shows the co-localization of TMEM41B with viral antigens. DAPI stains cell nuclei. (B) Western blot shows that an anti-RFP antibody which recognizes RFP-TMEM41B (but not an IgG antibody control) co-immunoprecipitates ZIKV NS4A in HAP1 cells. (C) Same as (B) but with YFV infection and visualized with an antibody that detects YFV NS4B. WCL, whole cell lysate. Of note, the heavy chain of the capture antibodies is detected by the secondary antibody protein A-HRP as indicated ~52 kDa. See also Figure S5.
Figure S6
Figure S6
Co-immunoprecipitation of TMEM41B and Viral NS4A and NS4B Proteins, Related to Figure 5 (A) Shown are western blots from Figure 5 from ZIKV-infected lysates. Left panel was probed with β-actin to show that similar amounts of whole cell lysate were used as input. Right panel was probed with anti-RFP to show that similar amounts of RFP-TMEM41B were immunoprecipitated from mock and infected lysates but not when using an IgG control antibody. (B) Same as (A) with YFV-infected cells. Of note, the β-actin signal detected in the anti-RFP IgG immunopreciptated fraction is likely an unspecific interaction with the RFP or with TMEM41B as it has been shown that the cytoskeleton (e.g., actins) can interact with organelles (e.g., ER).
Figure 6
Figure 6
NS4A and NS4B Mutations Bypass TMEM41B Deficiency (A) Graphical schematic of virus adaptation experiment performed in Aag2 (top) and A549 and HAP1 cells (bottom). (B) Summary of ZIKV adaptive mutations. Top, graphical representation of the ZIKV genome with mature (proteolytically processed) viral proteins shown as arrows and nucleotide positions listed below. NS4A and NS4B are shown in light blue. Bottom, table missense mutations identified by passaging virus in TMEM41B KO cells. Only mutations that were present in at least three independent passages (irrespective of cell type) and that did not appear in virus populations passaged in WT cells are shown. Boxes show the number of replicates a mutation was identified over the total number of replicates. Of six initial replicates for the A549 TMEM41B KO clones, only five were maintained for 20 passages. (C) I42T and F91Y mutations were independently engineered in a ZIKV infectious clone to generate virus stocks to infect WT (left) or TMEM41B KO (right) Aag2 cells. (D) Same as (C) in WT and TMEM41B KO A549 cells. (E and F) WT and TMEM41B KO A549 cells infected with YFV 17D and Asibi chimeric viruses. (E) 17D backbone with Asibi NS4A and NS4B proteins; (F) Asibi backbone with 17D NS4A and NS4B proteins. Cells were analyzed by flow cytometry and plotted as a percentage of viral antigen positive cells. Error bars depict SD for n = 3 replicates.
Figure S7
Figure S7
TMEM41B’s Role in the Flavivirus Life Cycle, Related to Figure 7 (A) WT and polymerase dead (dDD) YFV Renilla luciferase (Rluc)-reporter replicon RNAs transfected into WT and TMEM41B KO HAP1 cells with Rluc signal plotted as relative light units (RLU) plotted across a time course of 36 h. Rluc signal increases up to 4 h as the transfected RNA is translated. Rluc signal declines between 4 and 12 h as the transfected RNA decays (dDD) or is removed from the translating pool to serve as template for viral RNA replication. Rluc signal increases in WT cells transfected with WT replicon RNA, whereas the signal is dramatically reduced in TMEM41B-deficient cells. (B and C) WT and TMEM41B KO A549 cells infected with (B) YFV 17D, MOI = 0.025 PFU/cell for 48 h and (C) ZIKV, MOI = 0.05 PFU/cell for 48 h in the presence or absence of innate immune inhibitors. Cells were treated with 500 nM TBK1 and pan-JAK inhibitors or vehicle control (0.05% DMSO) 24 h prior to infection and throughout the experiment. The percentage of infected cells increases in WT cells in the presence of TBK1/JAK inhibitors, but not in TMEM41B KO cells. sg #1 and sg #2 indicates KO clones generated using TMEM41B sgRNA1 and sgRNA2, respectively. Two KO clones were used in each experiment as indicated in the figure. WT and KO clones were assayed in triplicate. Individual dots represent the average of the triplicates and error bars show the standard deviation of results from the average of the KO clones.
Figure 7
Figure 7
TMEM41B KO Cells Mount an Exaggerated Innate Immune Response to Flavivirus Inoculum (A) Viral RNA quantified by qRT-PCR from WT and TMEM41B KO HAP1 cells infected with YFV 17D. (B) OAS1 mRNA quantified by qRT-PCR from WT and TMEM41B KO HAP1 cells infected with YFV 17D (with and without UV-inactivation) or with IAV (ΔNS1). (C) WT and TMEM41B KO HAP1 cells untreated (mock), infected with YFV 17D, or treated with staurosporine (STS) were assayed to detect apoptotic cells via Annexin-V staining. Cells were analyzed by flow cytometry and plotted as a percentage of viral antigen positive cells. Error bars depict SD of n = 3 replicates. (D) Model for the role of TMEM41B in the flavivirus life cycle. The model is described in the main text.

Update of

Comment in

References

    1. Ahmed Q.A., Memish Z.A. Yellow fever from Angola and Congo: a storm gathers. Trop. Doct. 2017;47:92–96. - PubMed
    1. Aktepe T.E., Mackenzie J.M. Shaping the flavivirus replication complex: It is curvaceous! Cell. Microbiol. 2018;20:e12884. - PMC - PubMed
    1. Baggen J., Persoons L., Jansen S., Vanstreels E., Jacquemyn M., Jochmans D., Neyts J., Dallmeier K., Maes P., Daelemans D. Identification of TMEM106B as proviral host factor for SARS-CoV-2. bioRxiv. 2020 doi: 10.1101/2020.09.28.316281. - DOI
    1. Benboudjema L., Mulvey M., Gao Y., Pimplikar S.W., Mohr I. Association of the herpes simplex virus type 1 Us11 gene product with the cellular kinesin light-chain-related protein PAT1 results in the redistribution of both polypeptides. J. Virol. 2003;77:9192–9203. - PMC - PubMed
    1. Blight K.J., McKeating J.A., Rice C.M. Highly permissive cell lines for subgenomic and genomic hepatitis C virus RNA replication. J. Virol. 2002;76:13001–13014. - PMC - PubMed

MeSH terms