. 2021 Jan 21;184(2):489-506.e26.
doi: 10.1016/j.cell.2020.11.046. Epub 2020 Dec 17.

Differential encoding in prefrontal cortex projection neuron classes across cognitive tasks

Affiliations

Differential encoding in prefrontal cortex projection neuron classes across cognitive tasks

Jan H Lui et al. Cell. .

Abstract

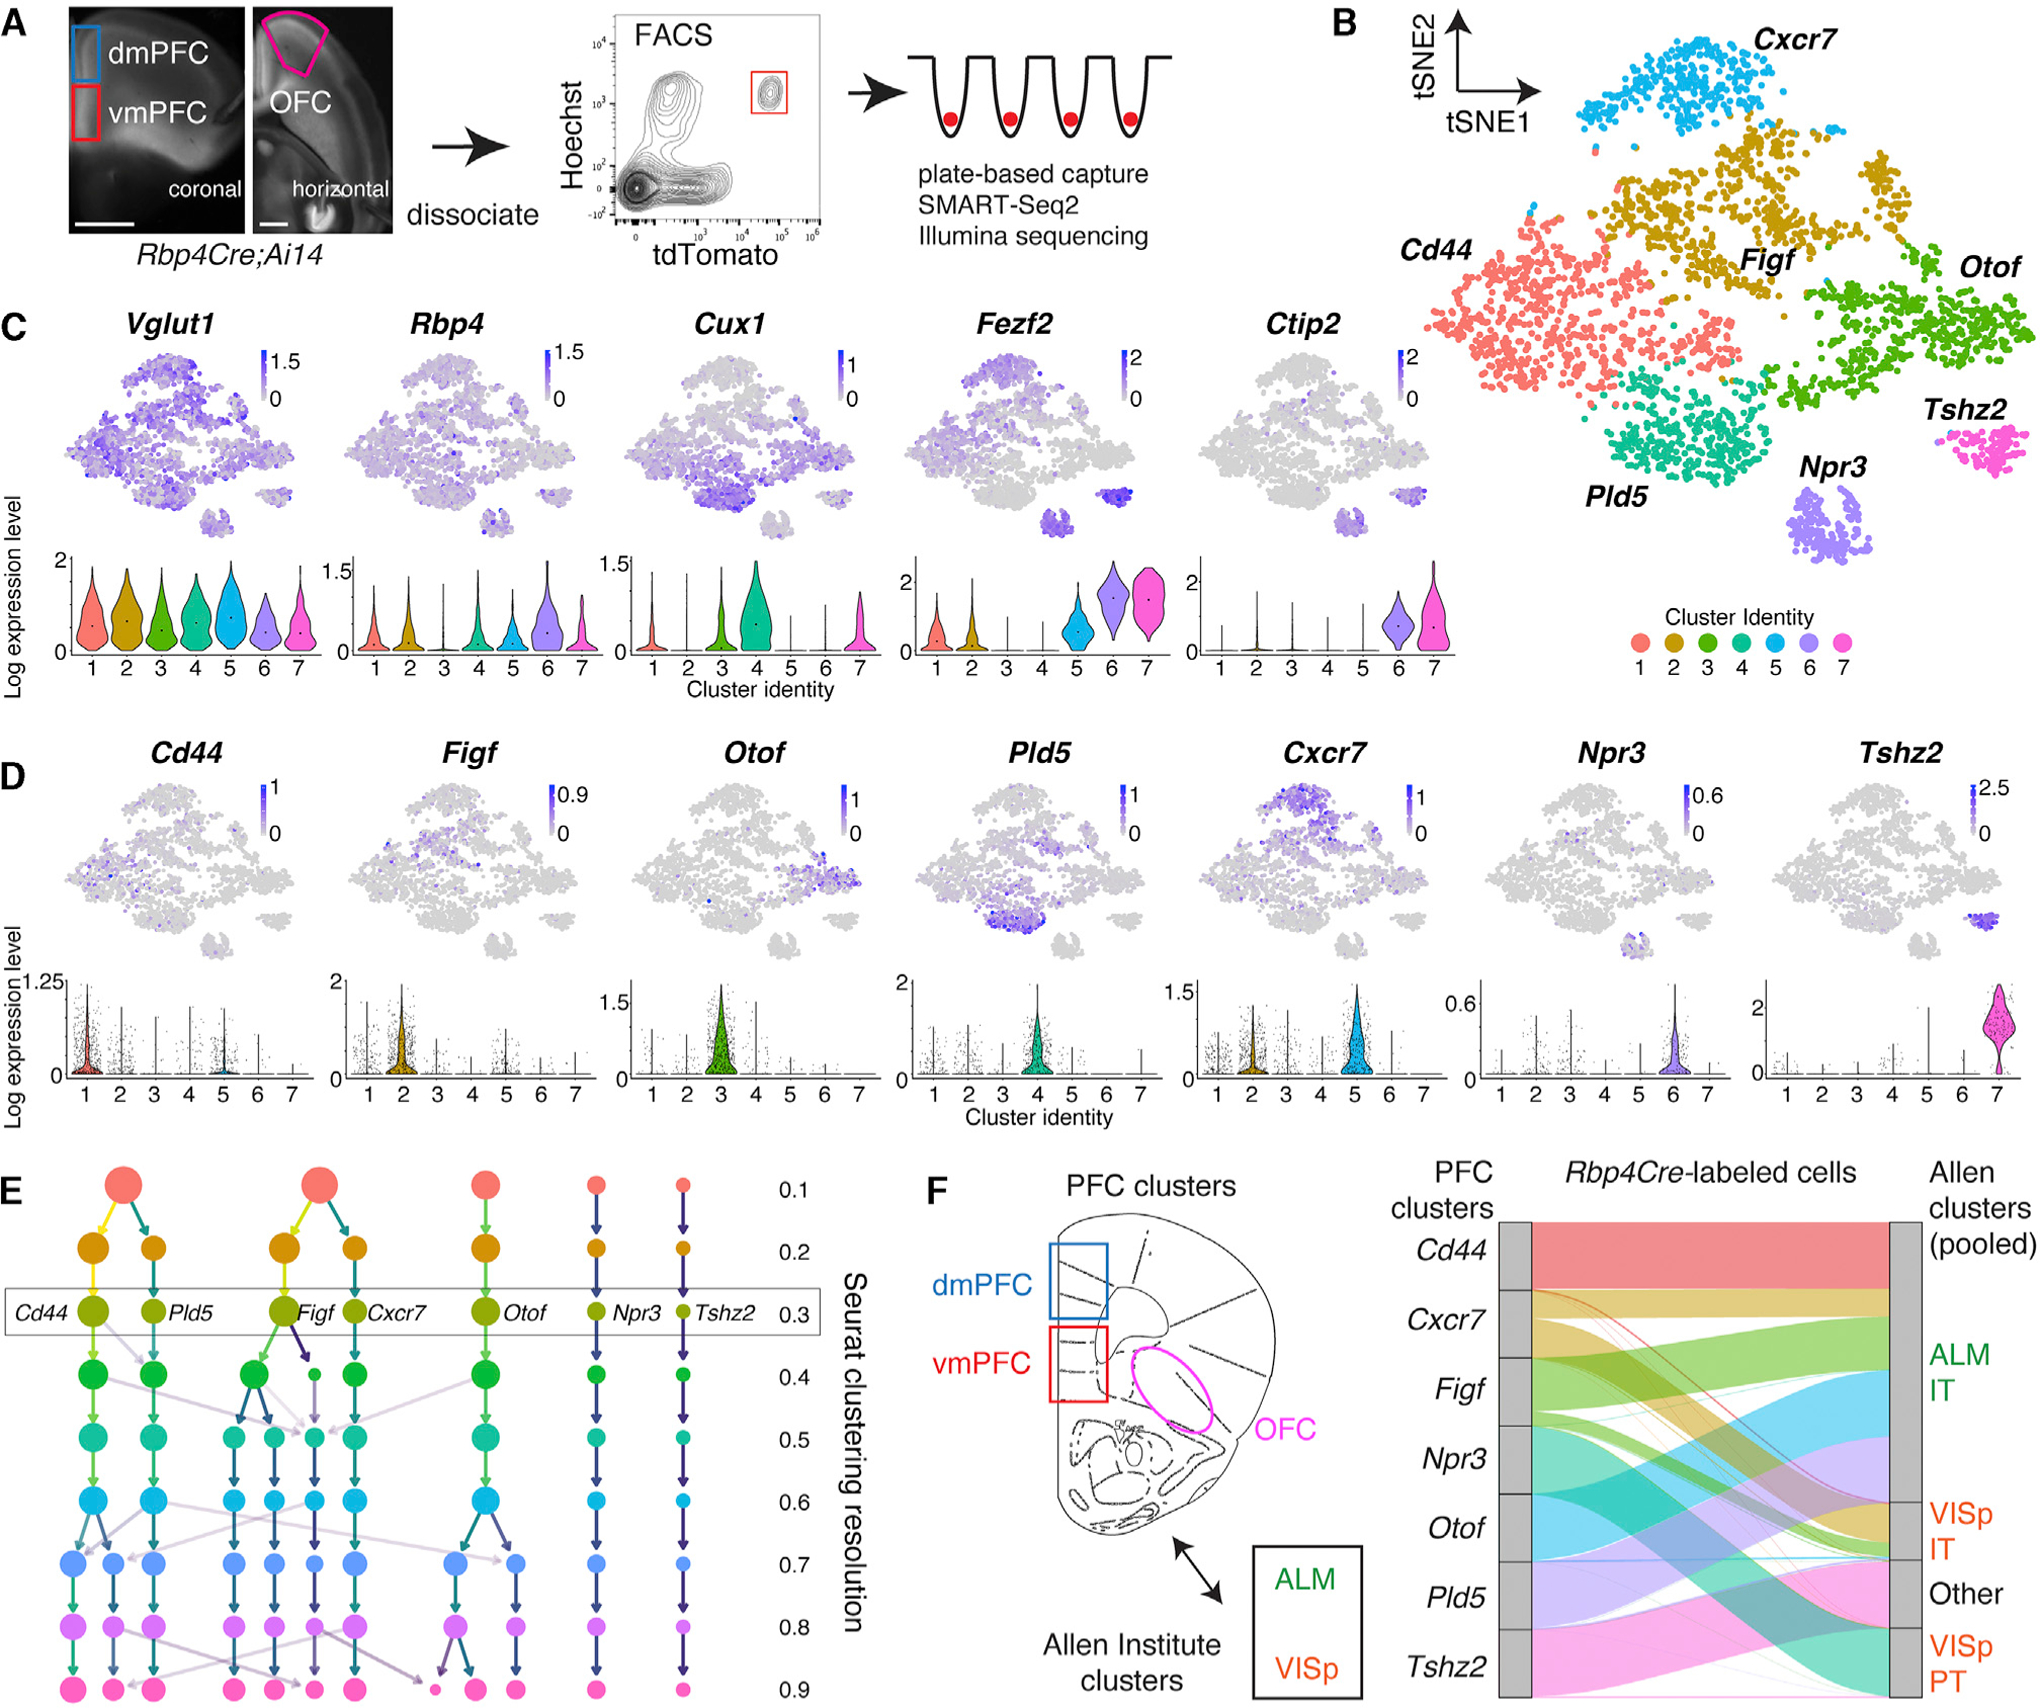
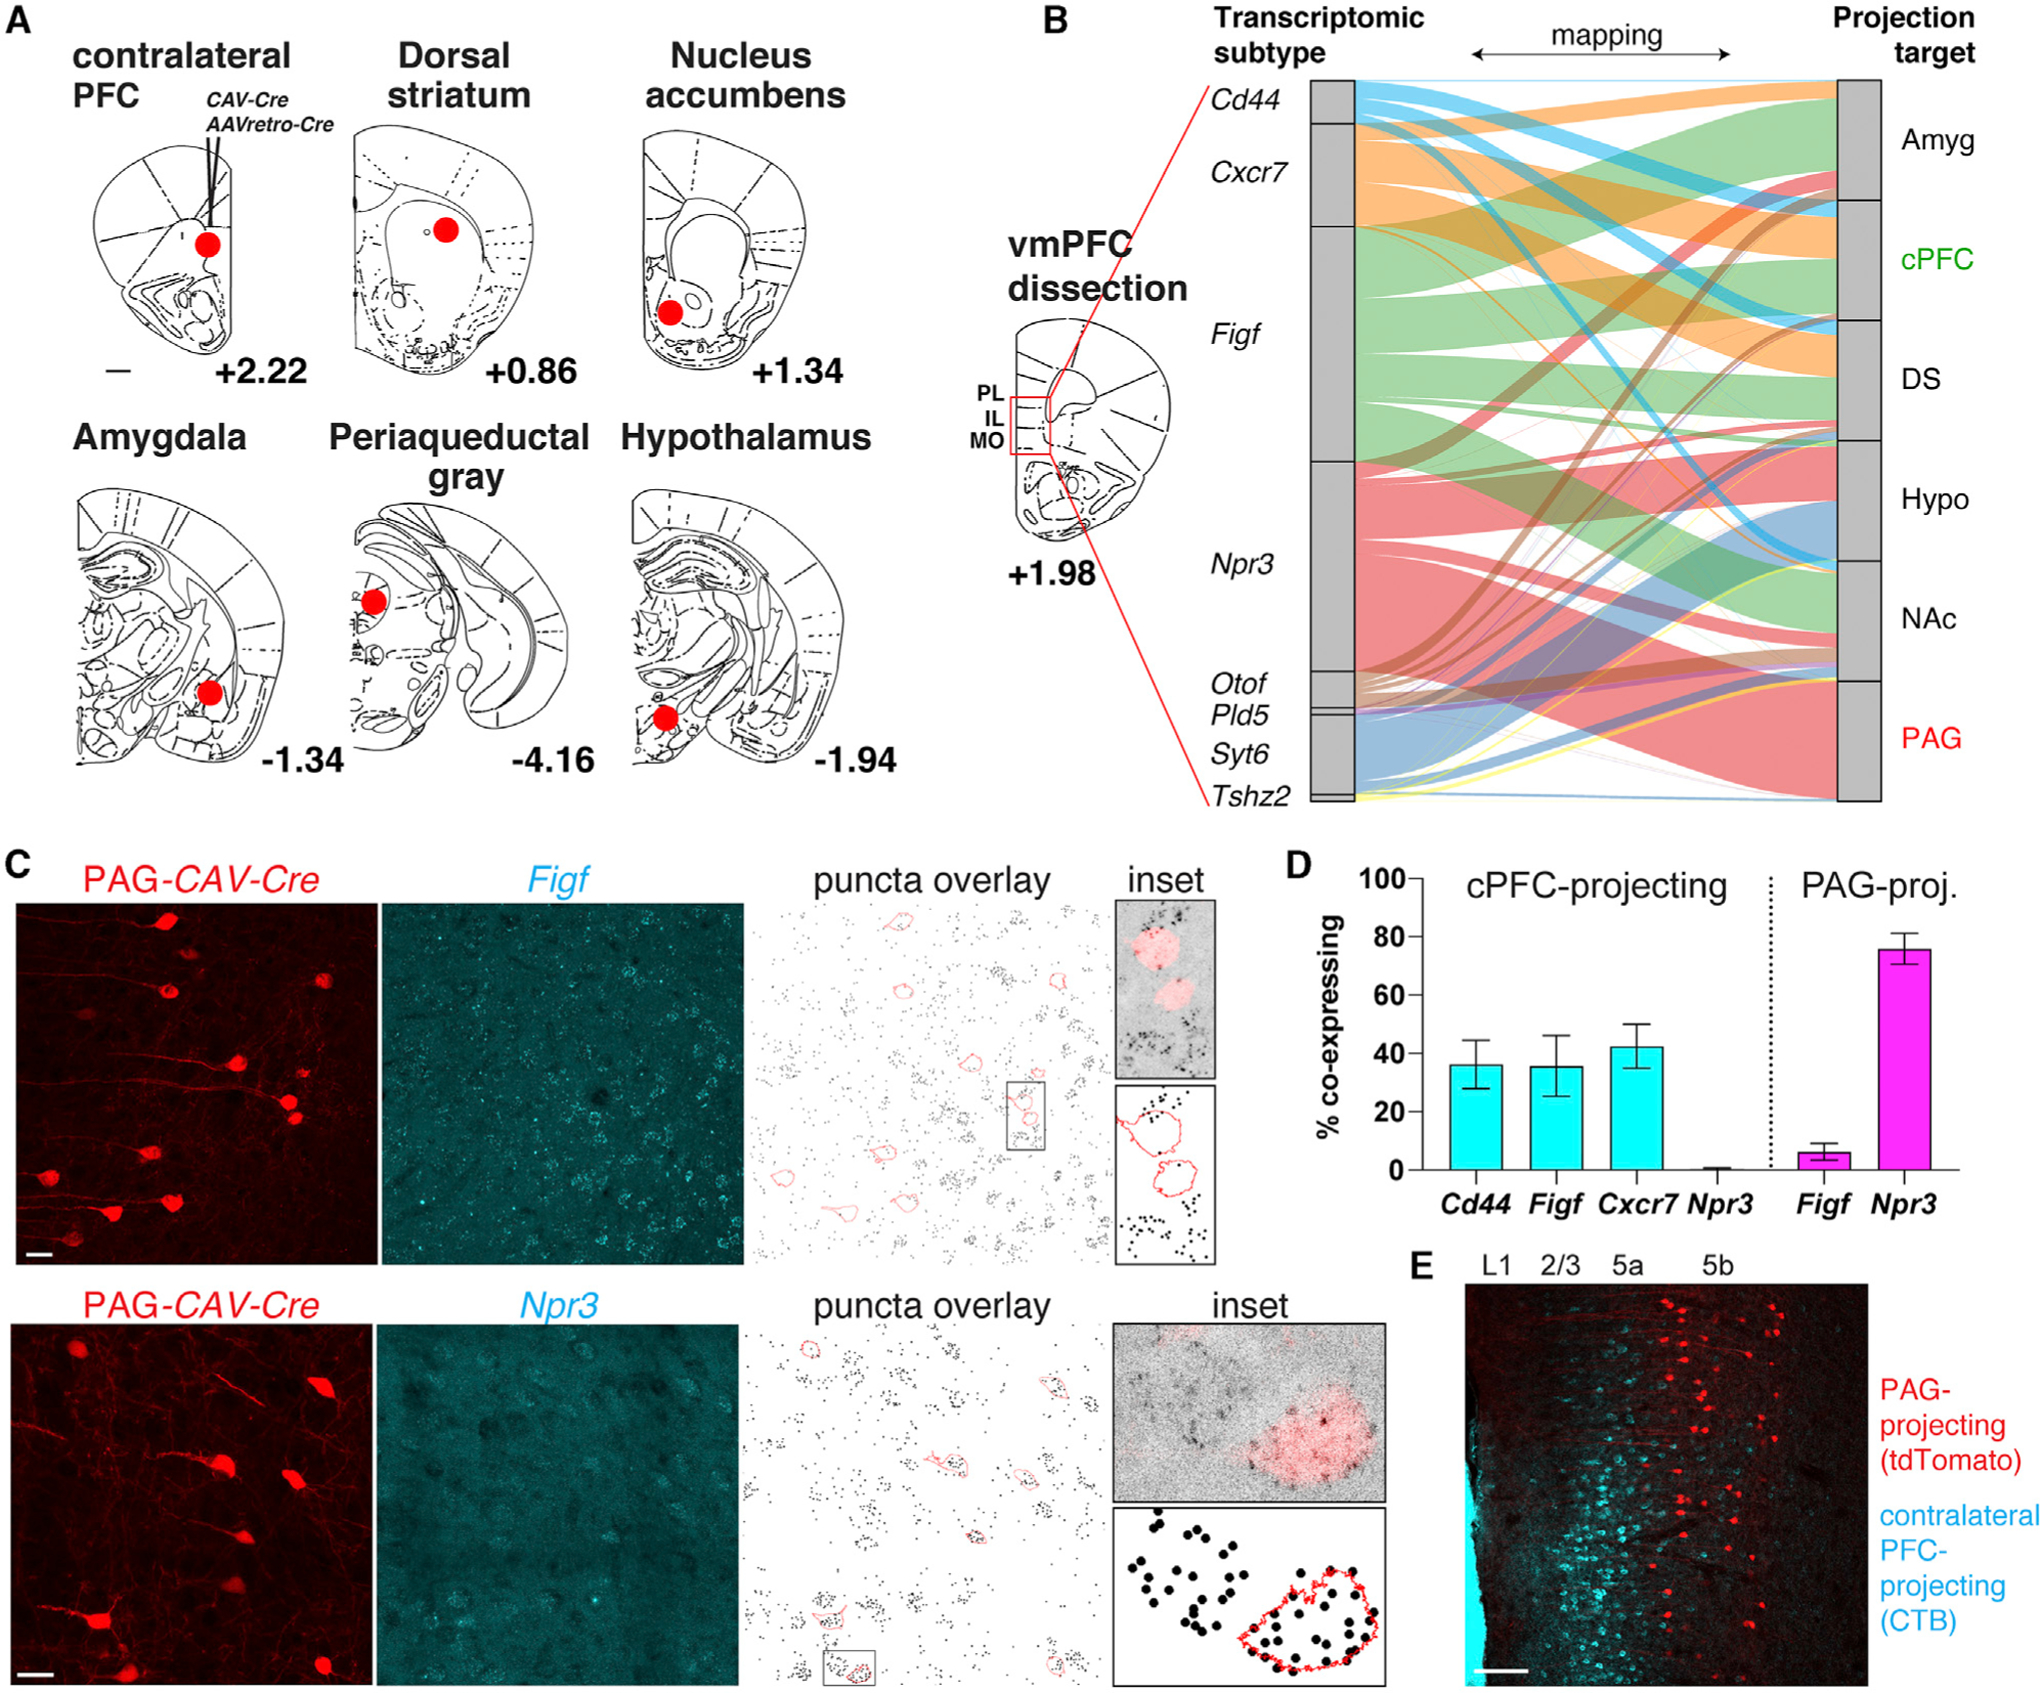
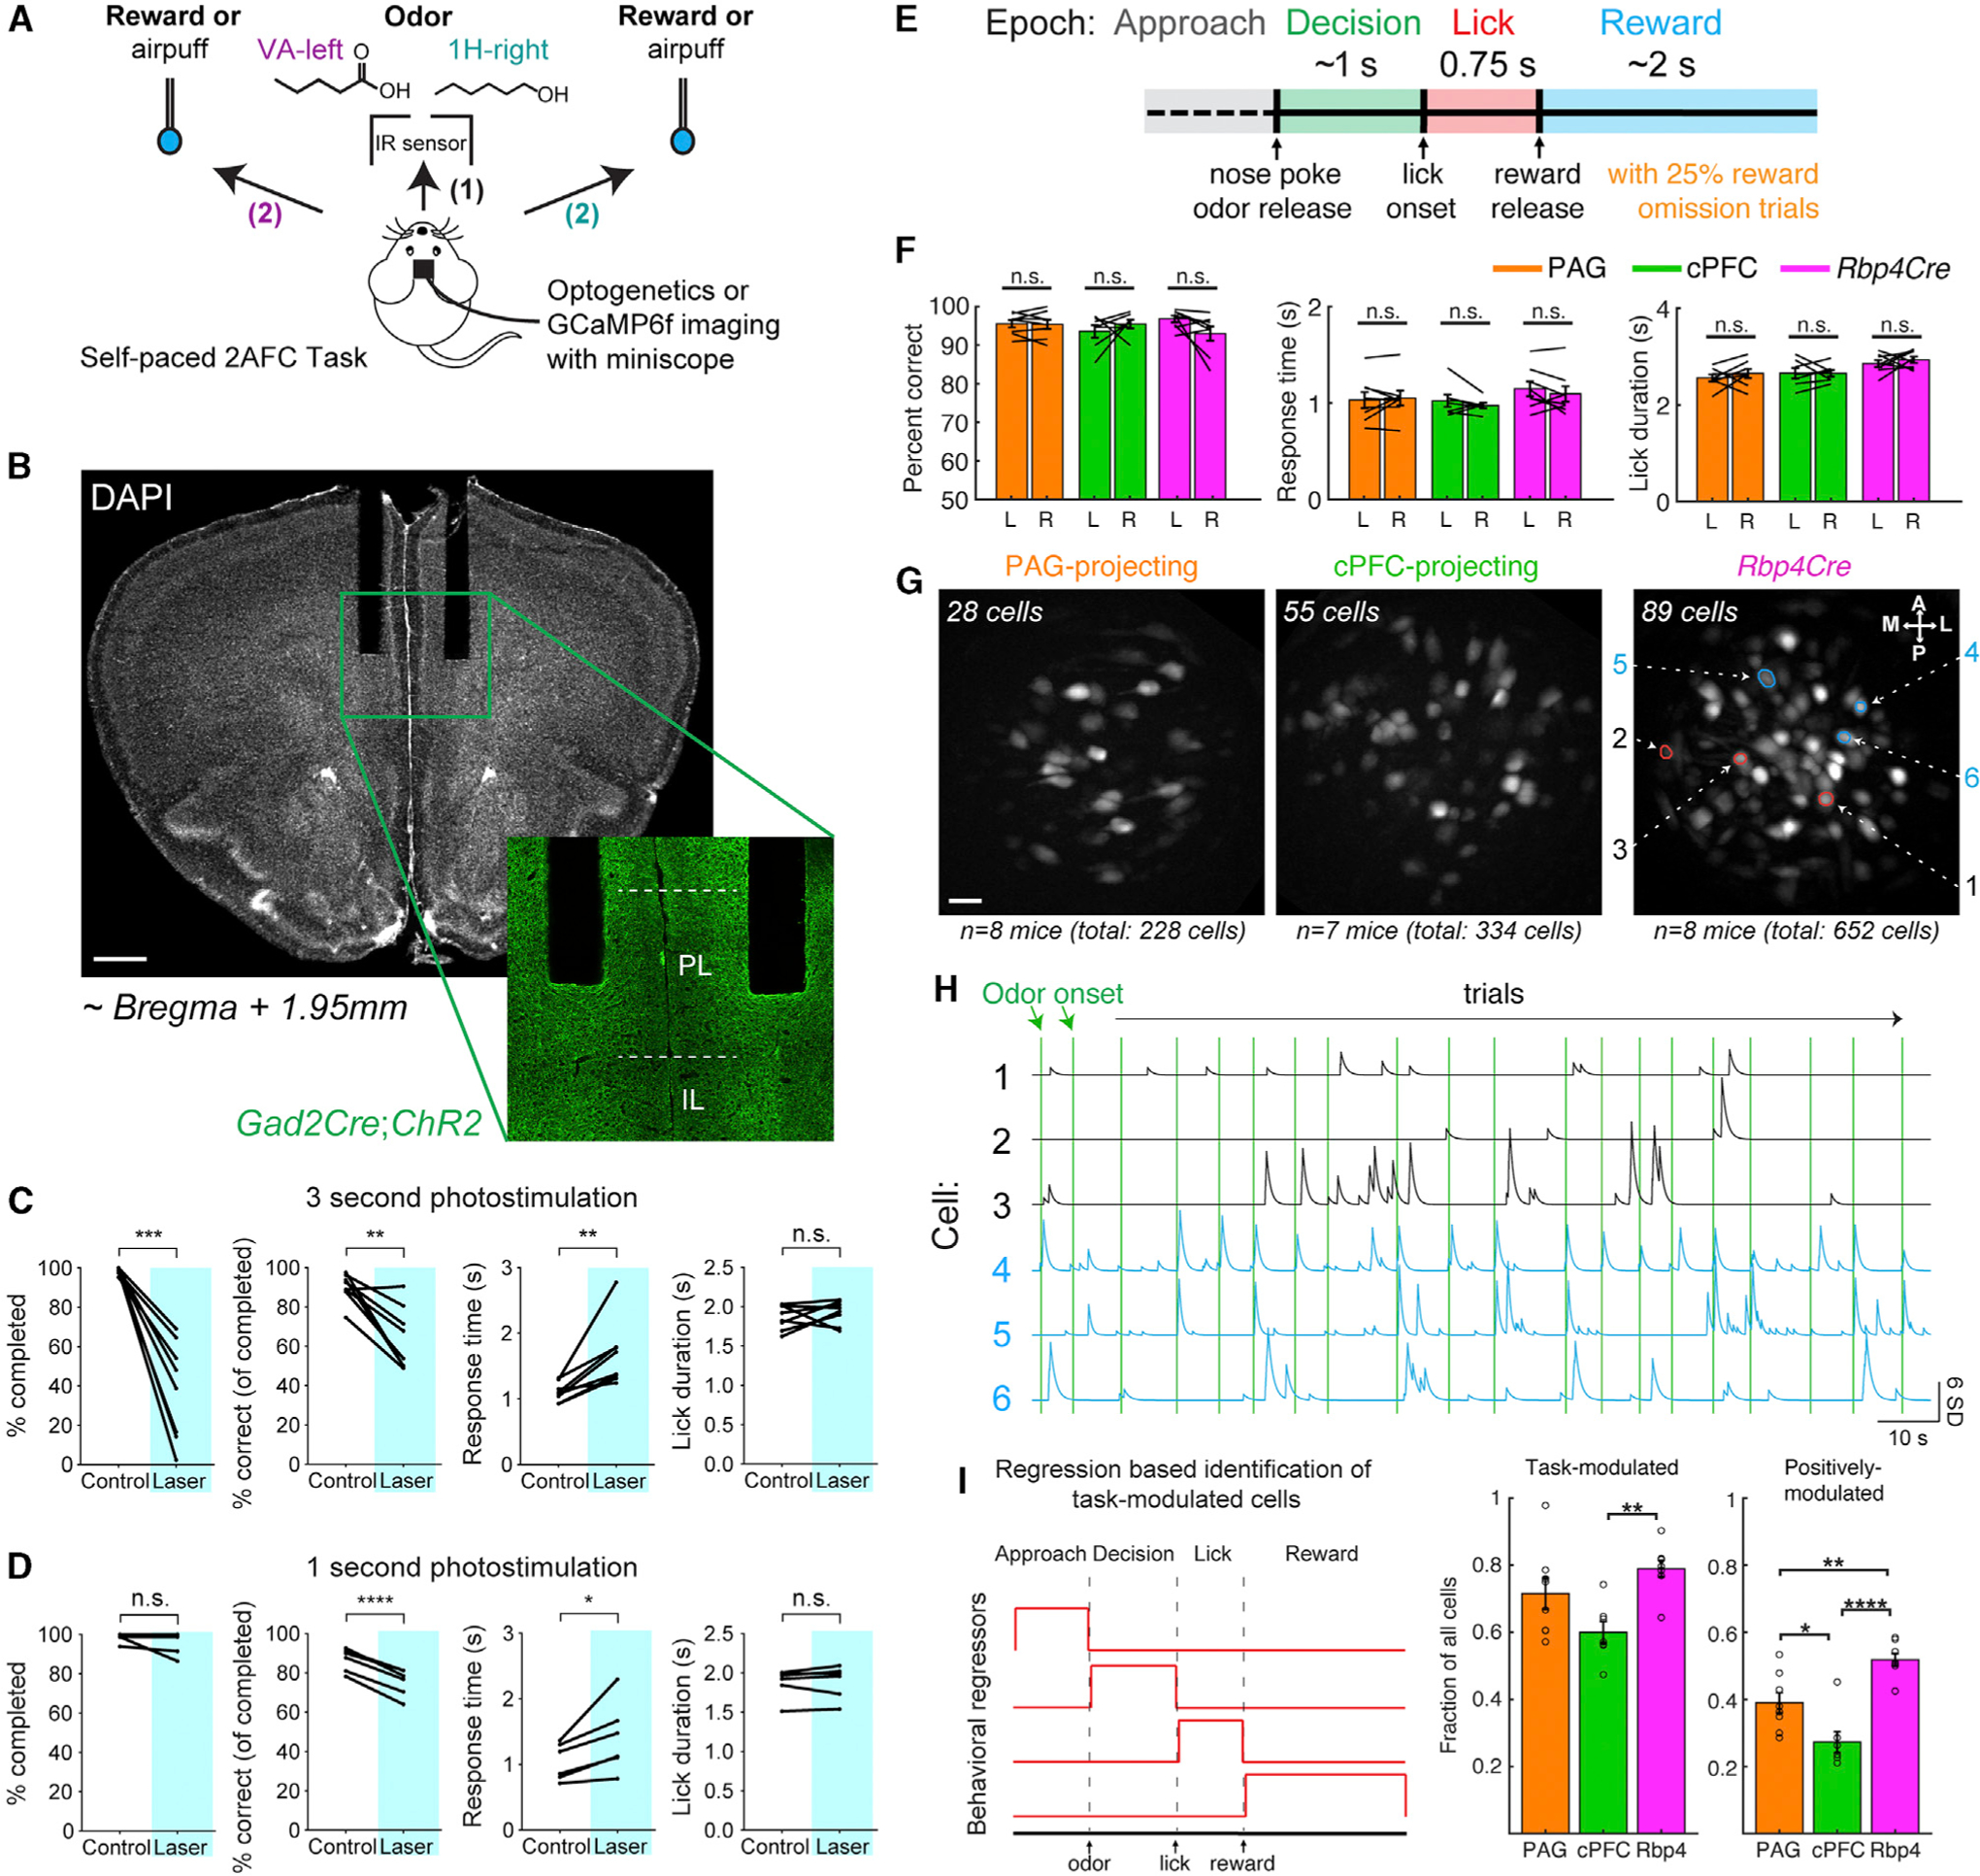
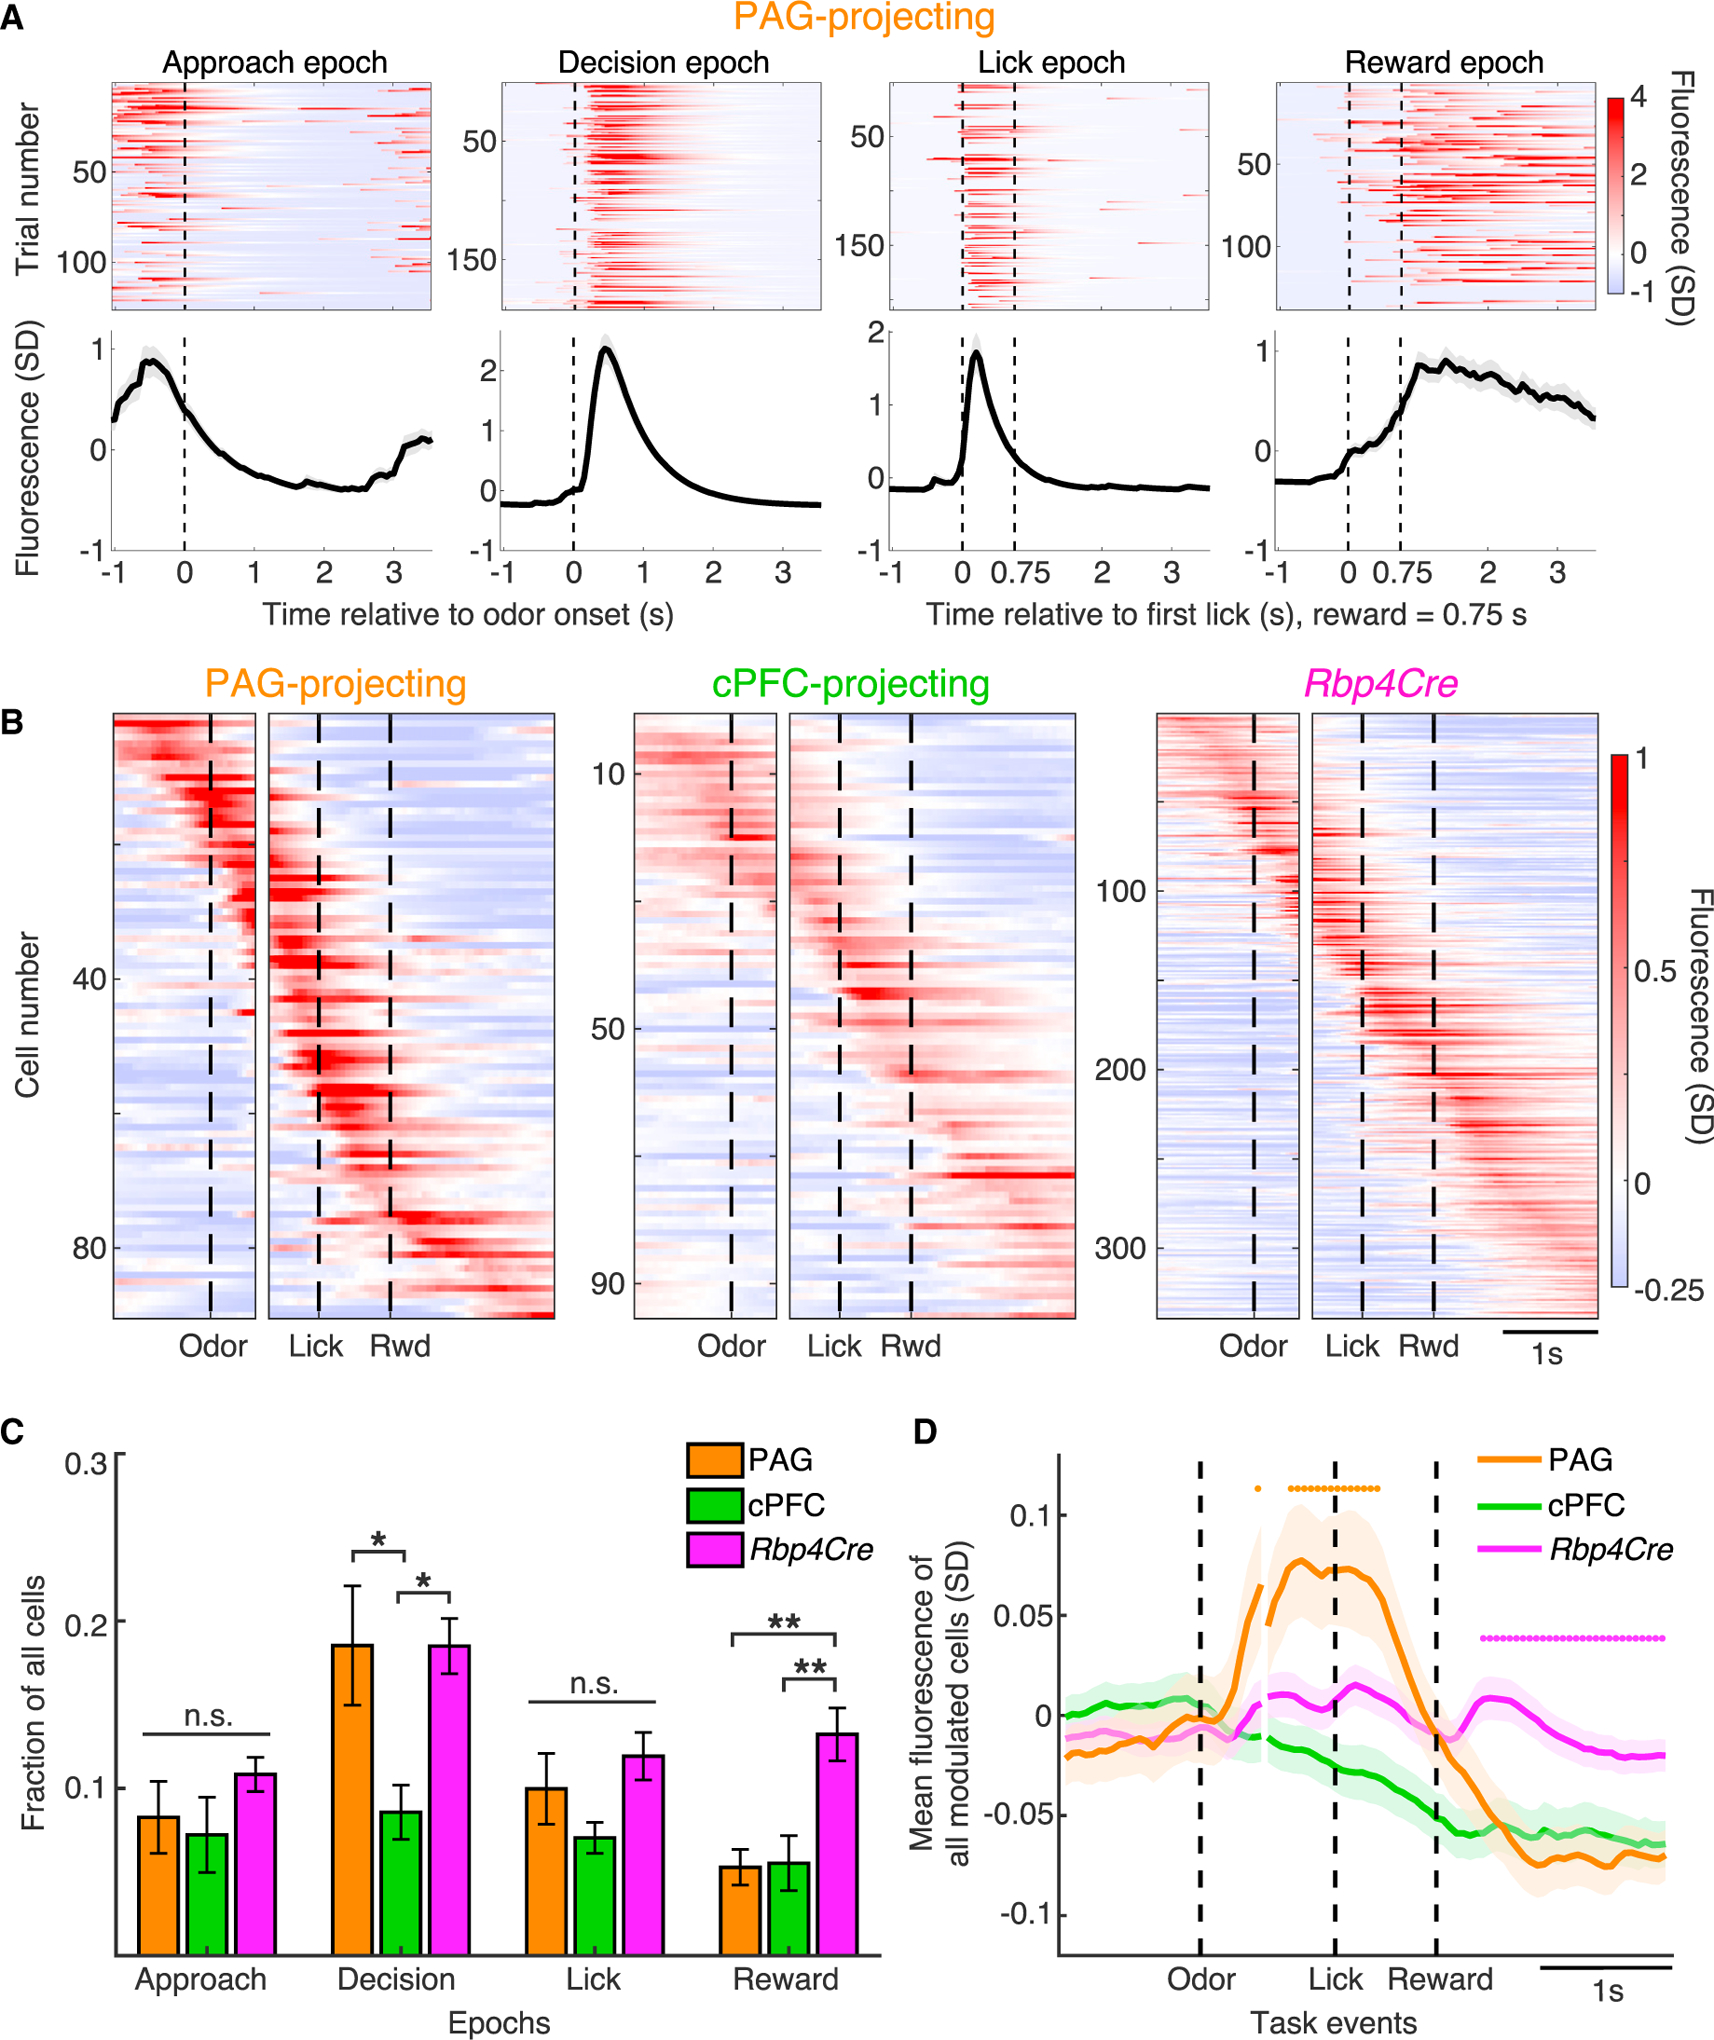
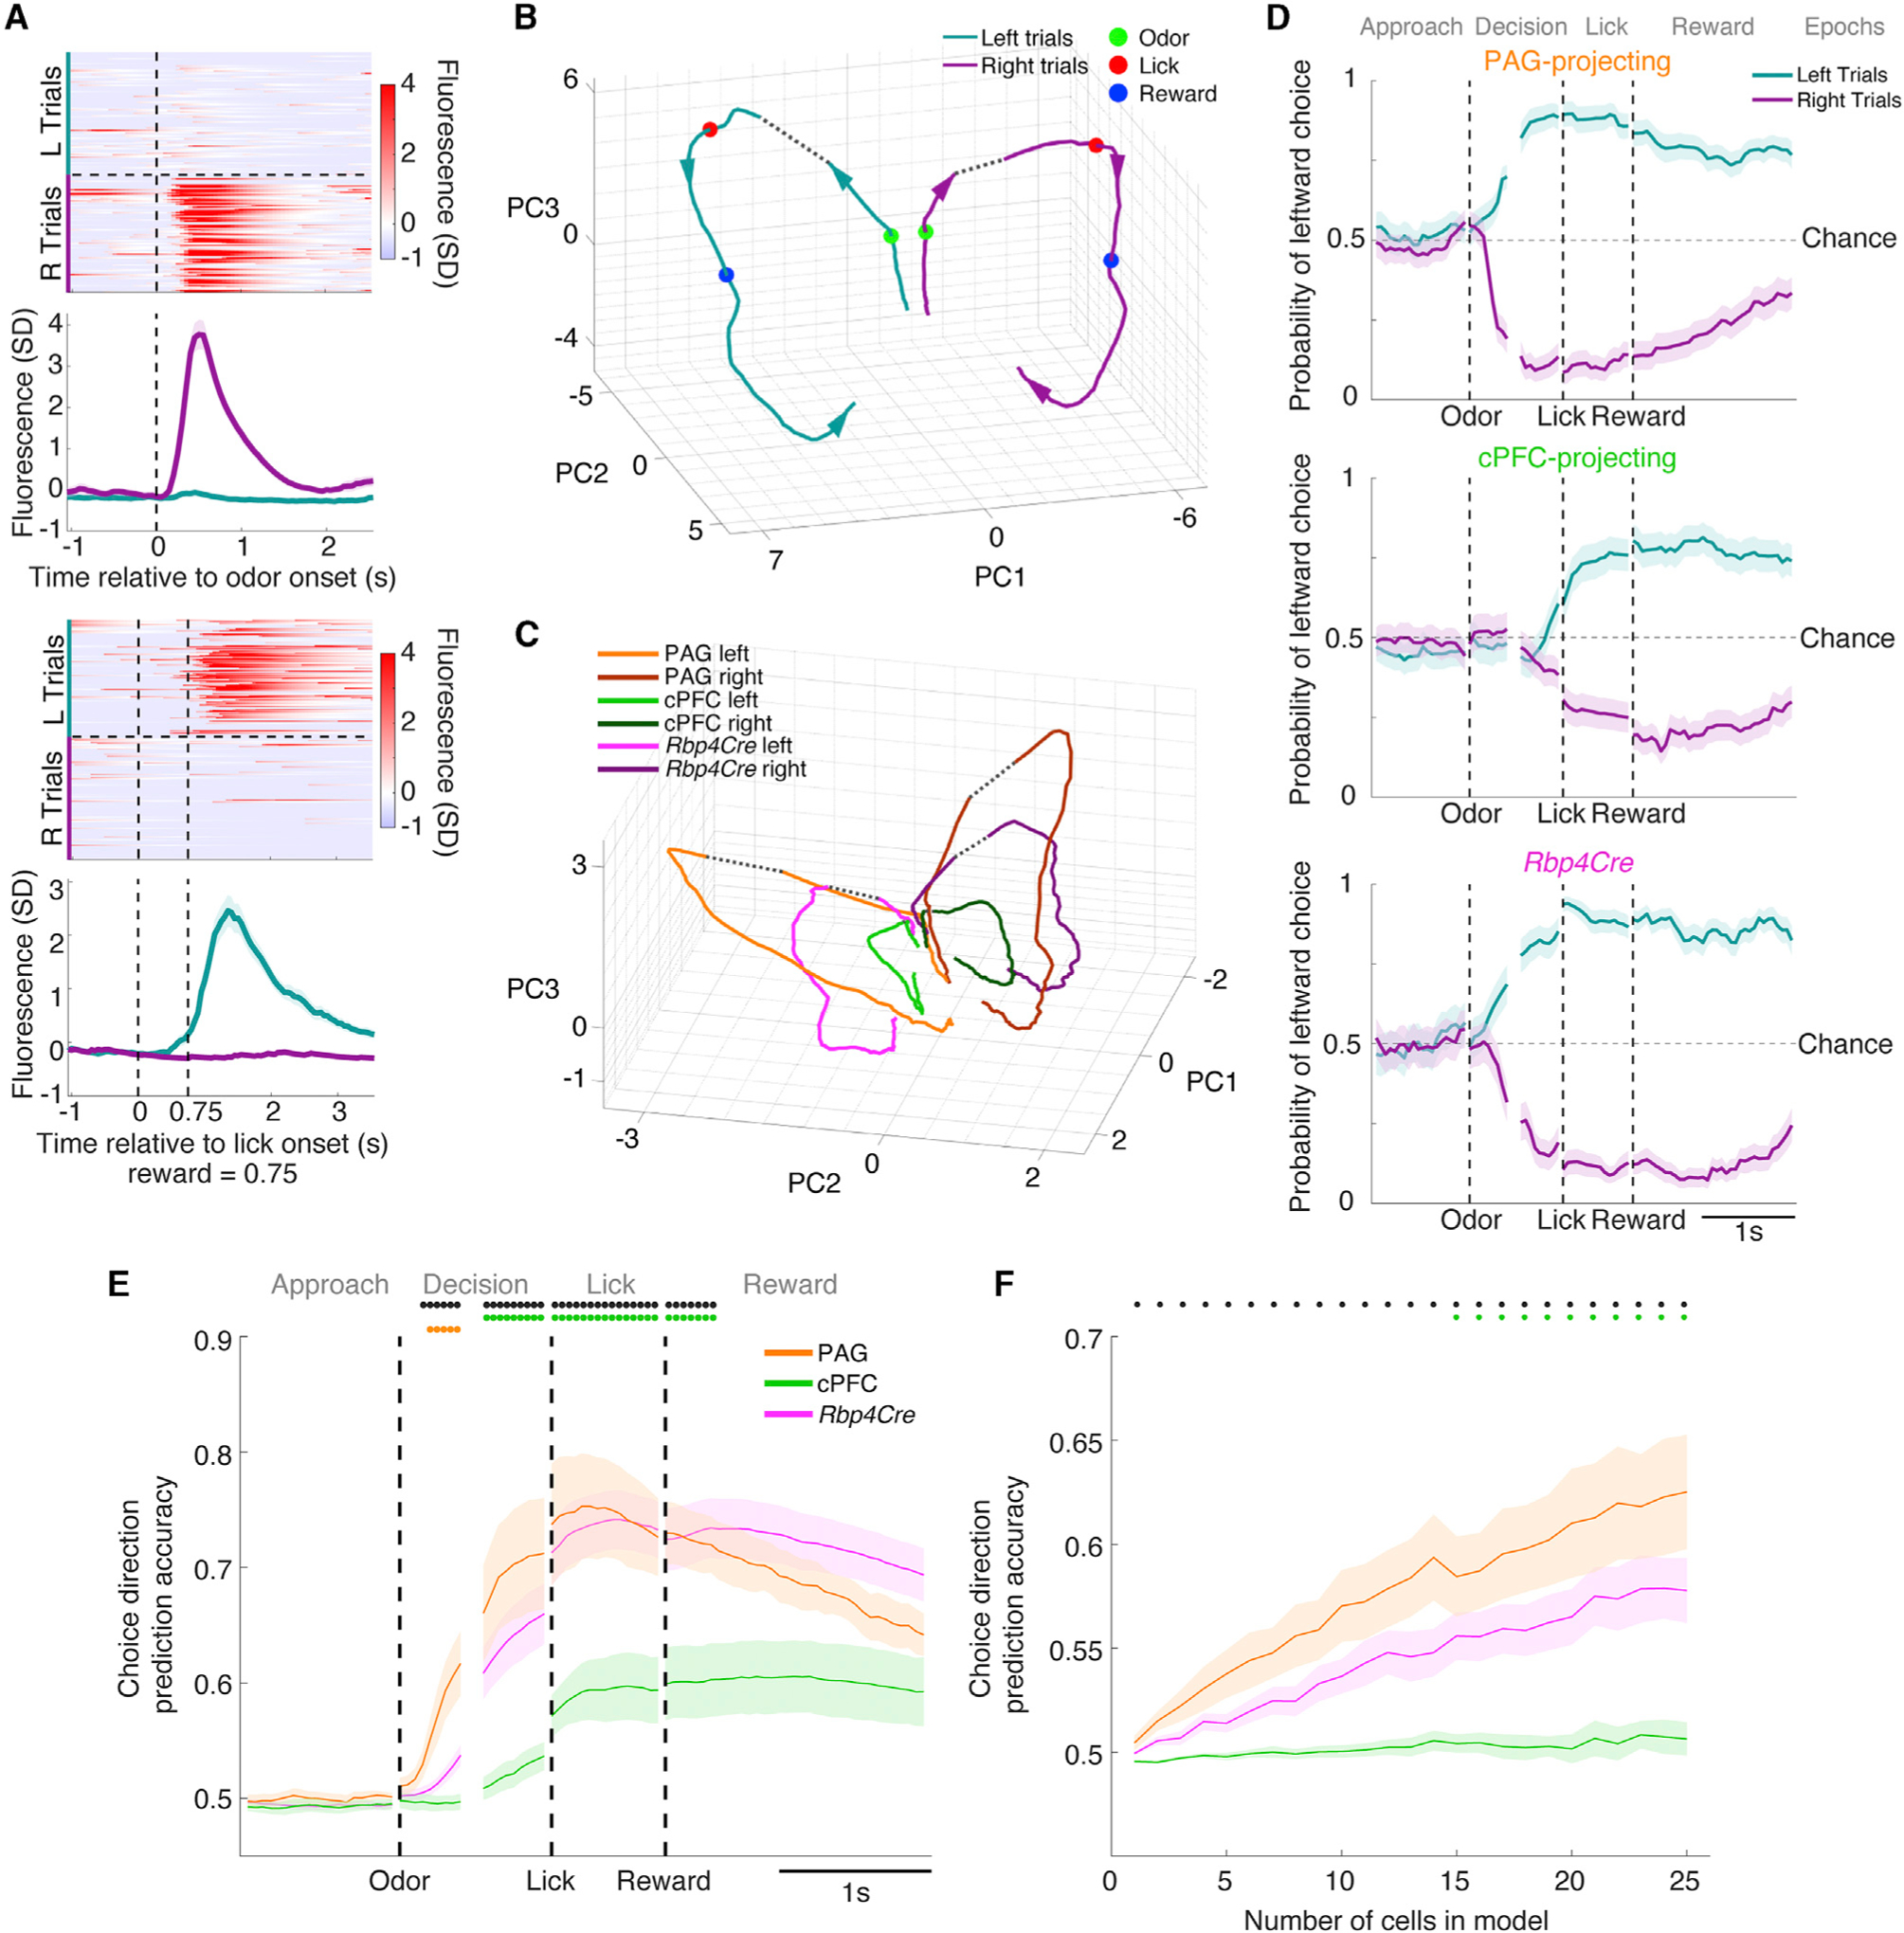
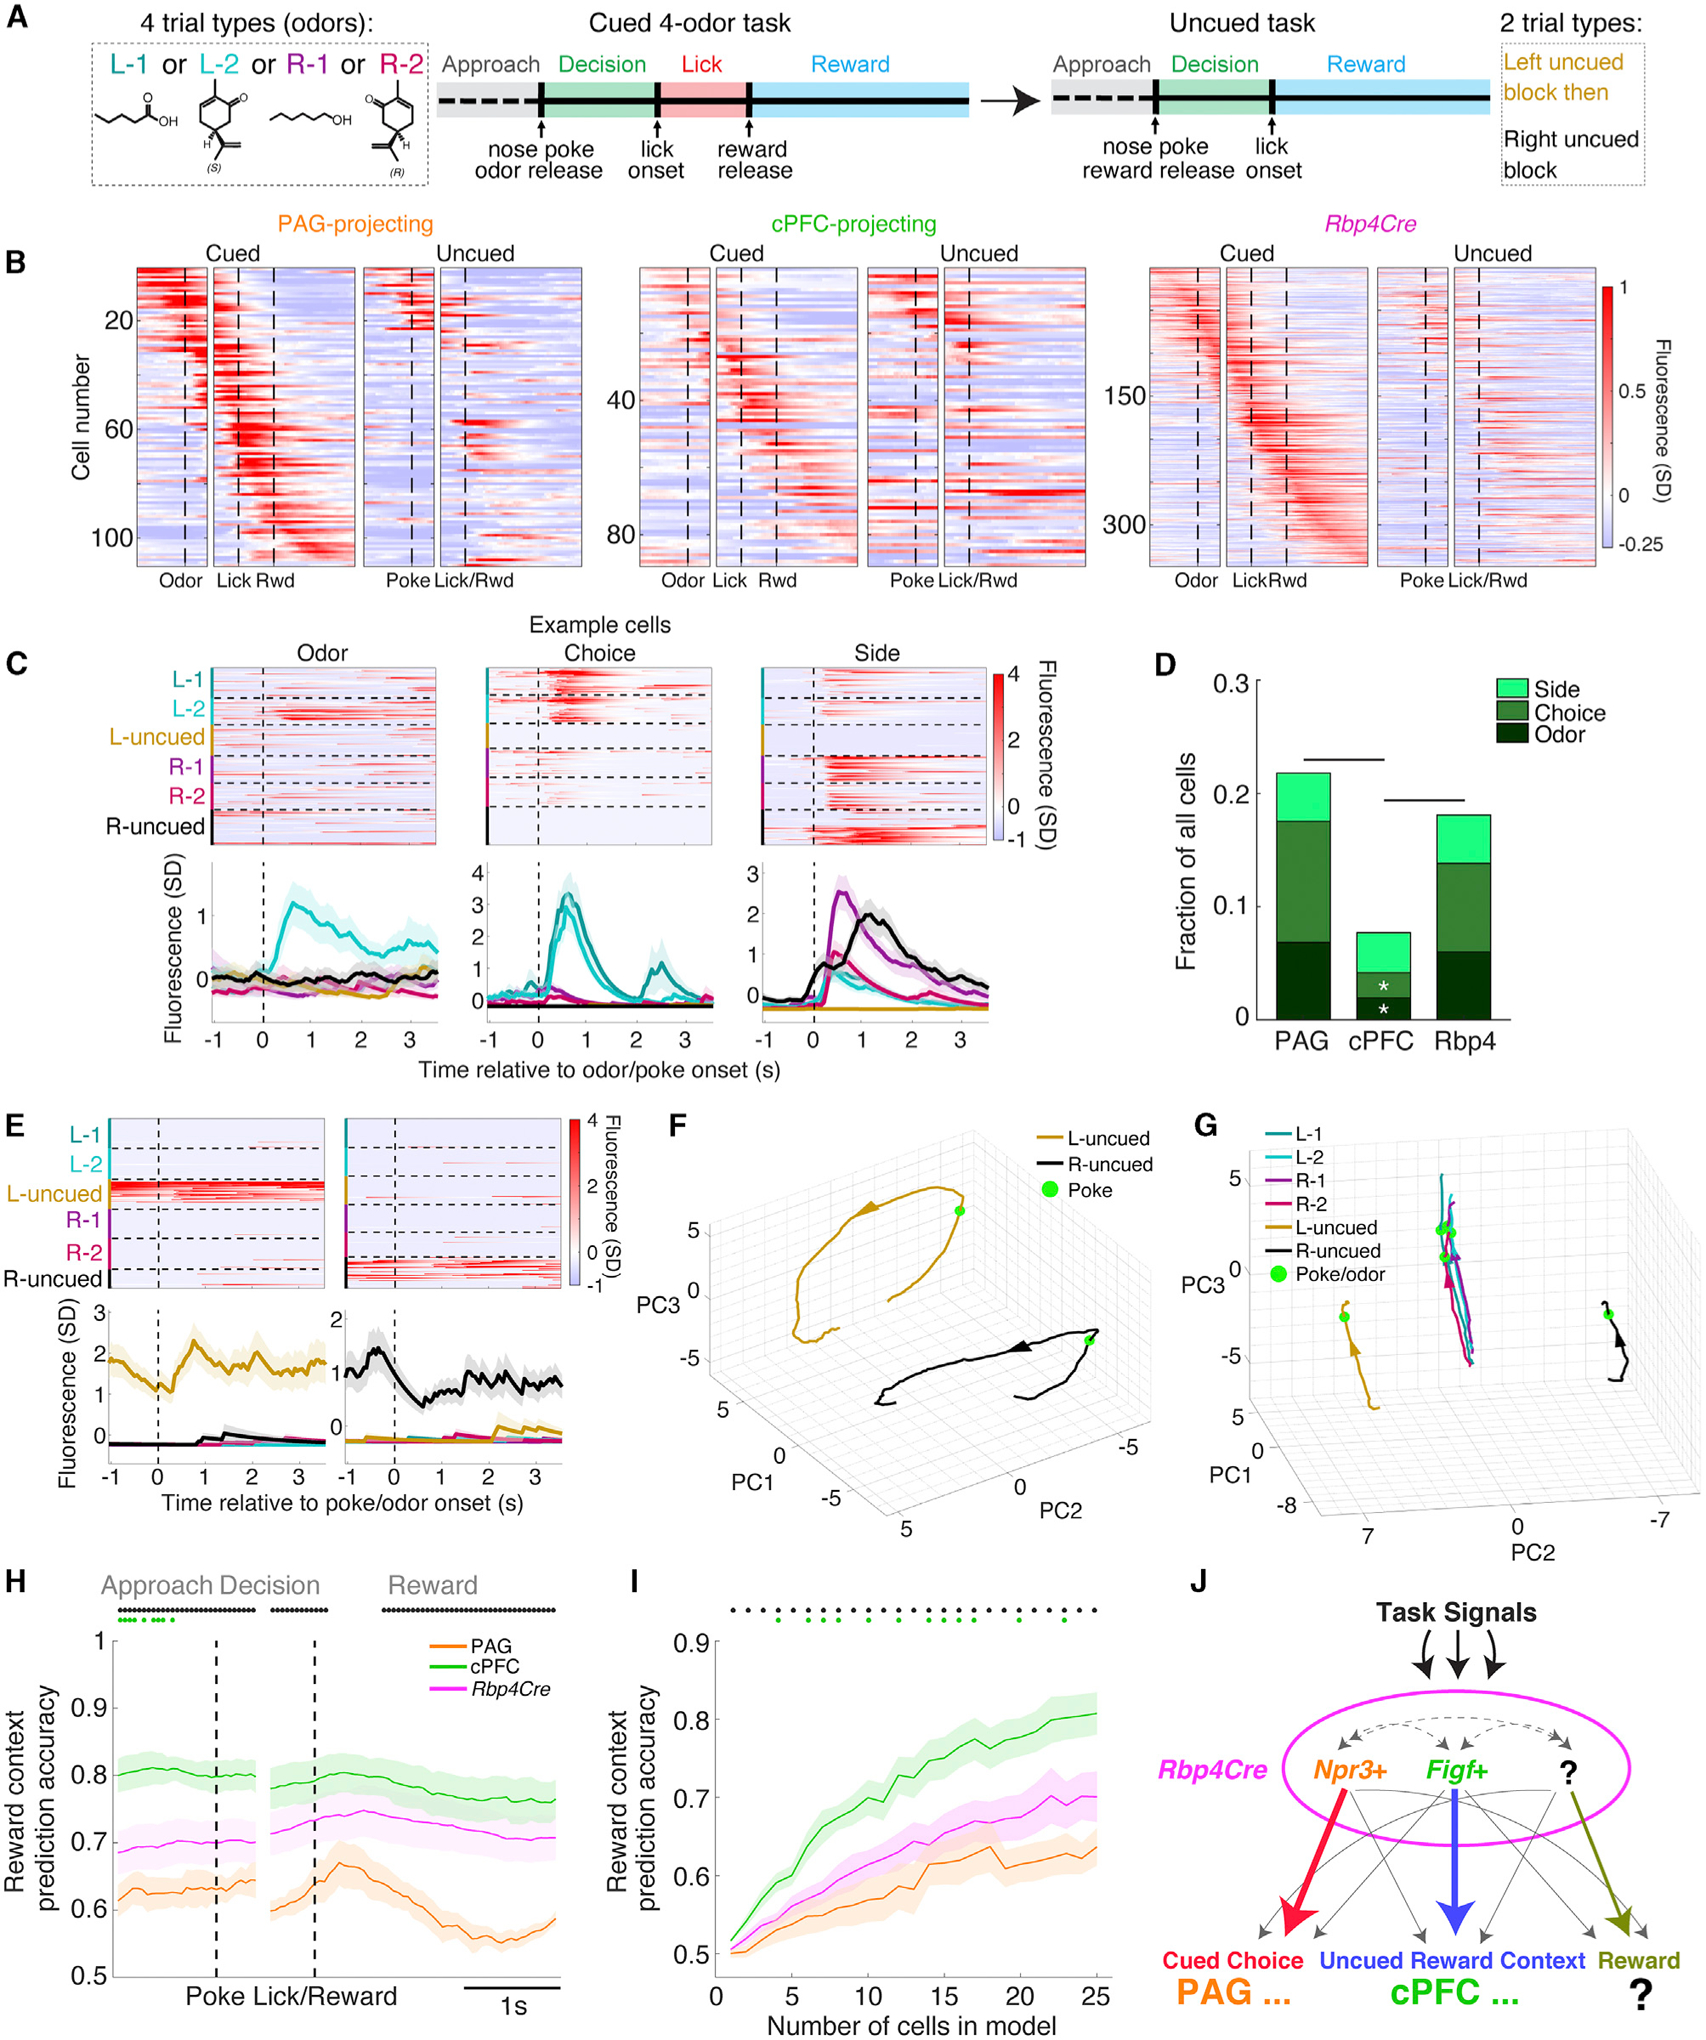
Single-cell transcriptomics has been widely applied to classify neurons in the mammalian brain, while systems neuroscience has historically analyzed the encoding properties of cortical neurons without considering cell types. Here we examine how specific transcriptomic types of mouse prefrontal cortex (PFC) projection neurons relate to axonal projections and encoding properties across multiple cognitive tasks. We found that most types projected to multiple targets, and most targets received projections from multiple types, except PFC→PAG (periaqueductal gray). By comparing Ca2+ activity of the molecularly homogeneous PFC→PAG type against two heterogeneous classes in several two-alternative choice tasks in freely moving mice, we found that all task-related signals assayed were qualitatively present in all examined classes. However, PAG-projecting neurons most potently encoded choice in cued tasks, whereas contralateral PFC-projecting neurons most potently encoded reward context in an uncued task. Thus, task signals are organized redundantly, but with clear quantitative biases across cells of specific molecular-anatomical characteristics.

Keywords: cell type atlas; cognitive behavior task; mini-endoscopic Ca(2+) imaging; molecular neuroscience; prefrontal cortex; projection mapping; systems neuroscience; transcriptomic neuron type; two-alternative forced choice.


Conflict of interest statement

Declaration of interests The authors have no competing interests.

Figures

Figure 1.
Figure 1.. Transcriptomic map of Rbp4Cre-labeled PFC projection neurons
(A) Cell isolation from three PFC subregions in Rbp4Cre;Ai14 mice for scRNAseq. Tissue was dissociated, FAC-sorted into plates, and processed with SMART-Seq2. Scale, 1 mm. (B) Unbiased clustering of 3139 high-quality projection neurons (median ~7000 genes/cell, ~1–2 million reads/cell) based on transcriptomic data, shown in t-distributed stochastic neighbor embedding (tSNE) space, using Seurat with batch correction. The 7 labels are based on marker genes from differential expression analysis across clusters. (C) Feature plots (top) and violin plots (bottom) showing single-cell gene expression of known markers for excitatory pyramidal neurons (Vglut1+), upper (Cux1) versus deeper (Fezf2) layers, and subcortically projecting neurons (Ctip2). Color scale of feature plots and y axis of violin plots in this and other panels are in the unit of ln[1+ (reads per 10000)]. Dot in each violin plot is the median. (D) Feature and violin plots similar to (C) for cluster-specific marker genes that best distinguish clusters (see Table S1 Tab 1). Dots in violin plots represent cells. (E) “Clustree” flowchart (Zappia and Oshlack, 2018) of how cell classifications change across different Seurat clustering resolutions. Arrow intensity indicates the population size moving between levels. The relatively low resolution of 0.3 was chosen because clusters could be distinguished by 1–2 marker genes. Note the relative stability of the Otof, Pld5, Cxcr7, and in particular the Npr3 and Tshz2 clusters. (F) Determination of Seurat nearest neighbor mapping (Stuart et al., 2019) between Rbp4Cre-labeled types in PFC (defined here) and in ALM or VISp (Tasic et al., 2018). An alluvial diagram (right) shows the mapping of 7 PFC clusters to the 4 ALM and VISp groups (from a full list of 20 types in Figure S1D), with normalization to the same population size for each PFC cluster. IT: intratelencephalic, PT: pyramidal tract (subcortical). See also Figure S1.
Figure 2.
Figure 2.. Anatomical locations of PFC transcriptomic types
(A) HCR-FISH of cluster-specific marker genes in vmPFC (A–P ~1.95 mm, D–V ~–2.35 mm). Dashed lines are approximate cortical layer boundaries (Allen Atlas; beginning of L2/3, 120 μm; L5a, 230 μm; L5b, 410 μm; L6: 600 μm from midline). Scale, 50 μm. (B) Laminar distribution of cells expressing cluster-specific markers across vmPFC. Vglut1 was used to segment cell soma to quantify expression of markers. Averaged across n = 4 mice, with 1–2 images per mouse. Layer boundaries are the same as (A) but begin at L2/3. (C) Double HCR-FISH for Npr3 and Tshz2 in vmPFC. Quantified for both dmPFC and vmPFC and averaged across 4 mice (252 dmPFC, 322 vmPFC cells). Scale, 50 μm. (D) Triple HCR-FISH for Otof, Cxcr7, and Figf in vmPFC. Quantification similar to (C) (4 mice; 540 dmPFC, 591 vmPFC cells). Scale, 50 μm. In this and all subsequent figures, stereotactic coordinates are in millimeters (mm) with respect to bregma, and error bars are SEM unless otherwise stated. See also Figures S2A–S2D.
Figure 3.
Figure 3.. Relationship between projection patterns and transcriptomic types in vmPFC
(A) Retrograde labeling from vmPFC targets (red circles indicate injection sites) for scRNAseq. tdTomato+ cells were collected from vmPFC one week after injection. Numbers are distance in mm from bregma (A–P axis). Scale, 500 μm. (B) Nearest neighbor mapping of retrograde cells collected from vmPFC (n = 440 cPFC, 129 DS, 93 NAc, 290 Amyg, 94 PAG, and 109 Hypo cells) to the 7 transcriptomic types from Figure 1 and Syt6+ L6 cells (Figure S3A), with normalization to the same population size for each target. Mapping to reference datasets with higher clustering resolution (Figure S3B), of only Rbp4+ cells, or of only vmPFC cells gave similar results (data not shown). PL, prelimbic; IL, infralimbic; MO, medial orbital cortex. (C) Images of retrograde tracing from PAG (red) and HCR-FISH showing that PAG-projecting cells (tdTomato) express Npr3 but not Figf (cyan). HCR-FISH signal was converted to binary puncta and overlaid with tdTomato cell outlines for quantification. Inset is magnification of the boxed region. Scale, 25 μm. (D) Quantification of retrograde cells (cPFC- or PAG-projecting) that co-localized with markers for different transcriptomic types (Cd44, Figf, Cxcr7, Npr3, n = 3 mice for each). (E) PAG- (tdTomato) and cPFC-projecting (CTB-488) cells in vmPFC in the same section. Scale, 100 μm. See also Figures S2E, S2F, and S3.
Figure 4.
Figure 4.. vmPFC is engaged by a two-alternative forced choice task
(A) Self-paced 2AFC task for freely moving mice. Mice were trained to nose poke in a center port (1), discriminate between two odor cues (presented for up to 1 s), and move to the correct reward port to obtain a 4 μL water reward (2). Incorrect cue-outcome associations resulted in a brief air puff punishment. (B) Bilateral optogenetic fibers implanted into PL (A–P: +1.95, M–L: ± 0.35, D–V: −2.3) of mice expressing ChR2(H134R) in all inhibitory neurons (Gad2Cre;Ai32). Scale, 500 μm. (C, D) Behavioral effects of vmPFC optogenetic inhibition. Photostimulation lasted 3 s (C) or 1 s (D) starting at nose poke, randomly interleaved on 25% of trials. Response time was calculated on all completed trials, and lick duration was calculated only for correct trials. Paired t test was used. (E) Trial structure and definition of 4 task epochs for imaging. (F) Performance metrics of mice during imaging for left and right trial types (Rbp4Cre: n = 8, PAG-projecting: n = 8, and cPFC-projecting: n = 7 mice; paired t test). Left: L, Right: R. (G) Example fields of view for the 3 cell classes, from 2-odor task imaging. Cre-dependent GCaMP6f expression (Ai148) was from CAV-Cre injections at target sites or from crossing to Rbp4Cre. Images are maximum intensity projections from a typical FOV. Rings are example regions-of-interest (ROIs) from CNMF-E. Scale, ~25 μm. (H) Ca2+ signals (CNMF-E denoised) for 6 highlighted cells (G, right). 3 are time-locked (blue) and 3 are not time-locked (black). Vertical green lines denote odor onset following each voluntary nose poke/trial. (I) Determination and quantification of cells with task-modulated activity. Four behavioral regressors were used for linear regression, separately for left and right trial types (left). Average fraction of imaged cells that were significantly modulated (middle: positively and negatively; right: only positively) for each cell class (circles represent individual mice, one-way ANOVA, post hoc Tukey’s HSD test). In this and subsequent figures, mean ± SEM is displayed. n.s.: not significant, p > 0.05; *p < 0.05; **p < 0.01; ***p < 0.001; ****p < 0.0001. Ca2+ data is represented as the Z score (SD) of the fluorescence intensity signal of single cells. See also Figure S4.
Figure 5.
Figure 5.. Differential enrichment of activity across epochs between cell classes
(A) Example single-trial (top) and corresponding trial-averaged activity (bottom) of significantly modulated PAG-projecting cells during the 4 task epochs defined in Figure 4E. Traces include all correct trials. Vertical dashed line in Approach/Decision epochs denotes odor onset. Vertical dashed lines in Lick/Reward epochs denote first lick (left) and reward delivery (right). (B) Trial-averaged activity of all positively modulated cells sorted by time of maximal activity and grouped by cell class. Panels are aligned to odor onset (left) and first lick (right) (n = 90 PAG-projecting, 95 cPFC-projecting, 339 Rbp4Cre-labeled cells). (C) Cells positively modulated in each of the four task epochs as a fraction of all imaged cells, on a per-mouse basis (one-way ANOVA, post hoc Tukey’s HSD test). (D) Average activity trace of task-modulated cells aligned to odor onset and first lick, for each cell class (n = 168 PAG-projecting, 205 cPFC-projecting, 518 Rbp4Cre-labeled cells). For this and subsequent figures, orange, green, or magenta dots represent PAG-projecting, cPFC-projecting, or Rbp4Cre traces being significantly different than the other two, respectively. Black dots represent where PAG-projecting and cPFC-projecting is significantly different. p < 0.05, one-way ANOVA, post hoc Tukey’s HSD test. See also Figure S5.
Figure 6.
Figure 6.. Choice direction-specific information differs quantitatively between cell classes
(A) Example single-trial (upper) and corresponding trial-averaged activity (lower) of two choice direction-selective cells. (B) Population neural activity trajectories of trial-averaged correct left and right trials represented using the first three PCs in activity state space. Arrows denote the direction of time. Green, red, and blue dots represent onset of odor, lick, and reward delivery, respectively. All imaged cells are included (n = 1214). Dotted lines connect data between the two alignment points. (C) Similar to (B), but neural activity trajectories are subdivided by cell class and randomly subsampled to 200 cells per class. (D) Choice direction prediction accuracy using a logistic regression model, shown over time across the four epochs, with one example mouse for each cell class. Values toward 1 or 0 indicate accurate left or right choice direction prediction, respectively. (E) Average choice direction prediction accuracy across mice (n = 5 PAG-projecting, 5 cPFC-projecting, and 8 Rbp4Cre-labeled mice), from data randomly subsampled to 25 cells per mouse (one-way ANOVA, post hoc Tukey’s HSD test). (F) Average choice direction prediction accuracy during the Decision epoch as a function of the number of cells included in the logistic regression analysis. See also Figures S6A and S6B.
Figure 7.
Figure 7.. Two additional cognitive tasks reveal how cell classes differentially encode task signals
(A) Task design. Mice first discriminated four possible odors to receive a 4μL reward per successful trial. They then immediately switched to an uncued task of repeated left (L-uncued) or right (R-uncued) trials in blocks, resulting in six trial types in the same imaging session. (B) Trial-averaged activity of all positively modulated cells during the cued task (left) sorted by the time of maximal activity and grouped by cell class (n = 110 PAG-projecting, 89 cPFC-projecting, 348 Rbp4Cre-labeled cells) followed by trial-averaged activity of the same cells during the uncued task (right). (C) Example Odor- (L-2 only), Choice- (L-1 + L-2), and Side-selective (R-1 + R-2 + R-uncued) cells with single-trial (top) and trial-averaged activity (bottom). Vertical dashed line denotes nose poke/odor onset. (D) Proportions of cells positively modulated in the Decision epoch, grouped by cell class, and categorized as Odor-, Choice-, or Side-selective using linear regression. Comparison across classes was performed using a permutation test. (E) Example cells with preferential activity during L-uncued trials (left) or R-uncued trials (right). Vertical dashed line denotes nose poke/odor onset. (F) Population neural activity trajectories summarizing trial-averaged traces of left versus right uncued trials using the first three PCs in activity state space. All imaged cells were included (n = 1248). (G) Same as (F) except that all six trial types are plotted, and only the Approach epoch leading up to the nose poke/odor onset is analyzed. (H) Average reward context prediction accuracy (left versus right block-type) over the course of the uncued task, across mice (n = 4 PAG-projecting, 5 cPFC-projecting, and 8 Rbp4Cre-labeled mice), from data randomly subsampled to 25 cells per mouse (one-way ANOVA, post hoc Tukey’s HSD test). (I) Average reward context prediction accuracy during the Approach epoch as a function of the number of cells included in the logistic regression analysis. (J) Schematic summary. Rbp4Cre-labeled cells in vmPFC are divided into cell classes defined by differential gene expression (Npr3+; Figf+/Cxcr7+/Cd44+, simplified as Figf+), which predominantly route different information (cued choice or uncued reward context) to different targets (PAG or cPFC). Note that PAG and cPFC are not the only sites these neurons project to. Our data also suggest that Rbp4Cre-labeled cells contain a subclass that preferentially encodes reward, distinct from PAG- or cPFC-projecting cells. See also Figures S6C and S7.

References

    1. Allen WE, DeNardo LA, Chen MZ, Liu CD, Loh KM, Fenno LE, Ramakrishnan C, Deisseroth K, and Luo L (2017a). Thirst-associated preoptic neurons encode an aversive motivational drive. Science 357, 1149–1155. - PMC - PubMed
    1. Allen WE, Kauvar IV, Chen MZ, Richman EB, Yang SJ, Chan K, Gradinaru V, Deverman BE, Luo L, and Deisseroth K (2017b). Global Representations of Goal-Directed Behavior in Distinct Cell Types of Mouse Neocortex. Neuron 94, 891–907.e6. - PMC - PubMed
    1. Allen WE, Chen MZ, Pichamoorthy N, Tien RH, Pachitariu M, Luo L, and Deisseroth K (2019). Thirst regulates motivated behavior through modulation of brainwide neural population dynamics. Science 364, 253. - PMC - PubMed
    1. Anders S, Pyl PT, and Huber W (2015). HTSeq-a Python framework to work with high-throughput sequencing data. Bioinformatics 31, 166–169. - PMC - PubMed
    1. Asaad WF, Rainer G, and Miller EK (1998). Neural activity in the primate prefrontal cortex during associative learning. Neuron 21, 1399–1407. - PubMed

Publication types