Review
. 2021 Apr:77:109-123.
doi: 10.1016/j.mri.2020.12.010. Epub 2020 Dec 16.

MR cell size imaging with temporal diffusion spectroscopy

Affiliations
Review

MR cell size imaging with temporal diffusion spectroscopy

Xiaoyu Jiang et al. Magn Reson Imaging. 2021 Apr.

Abstract

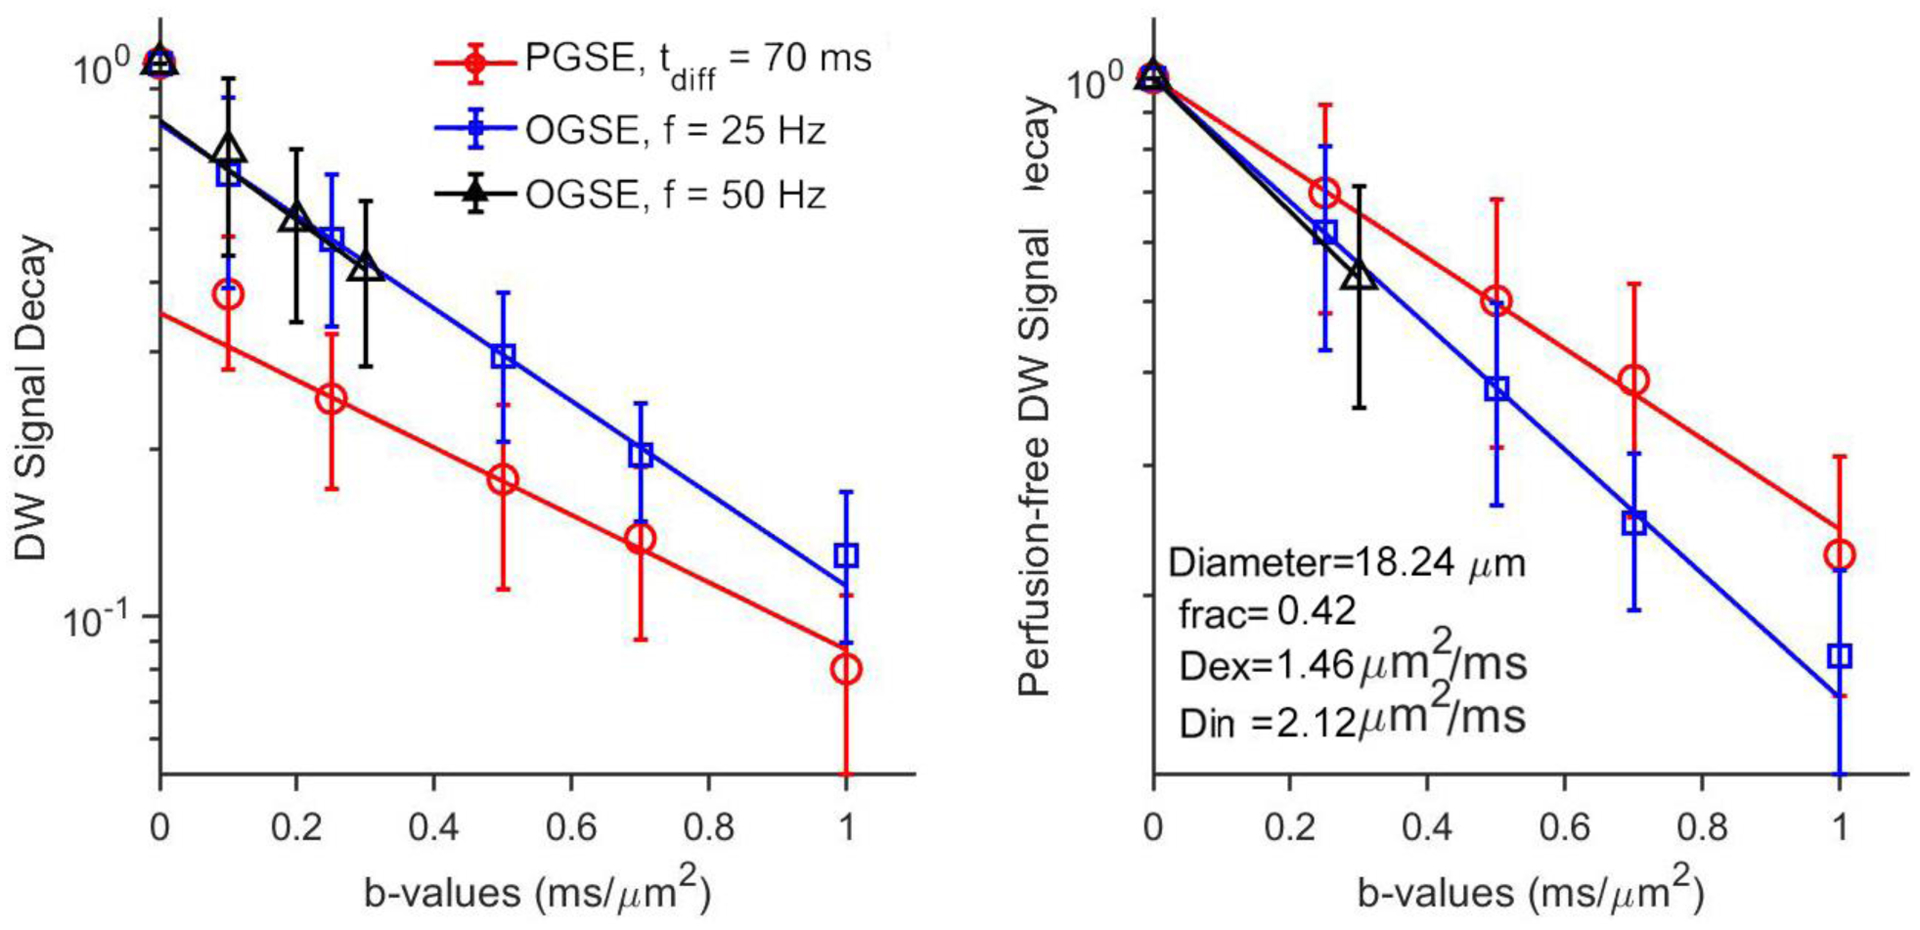
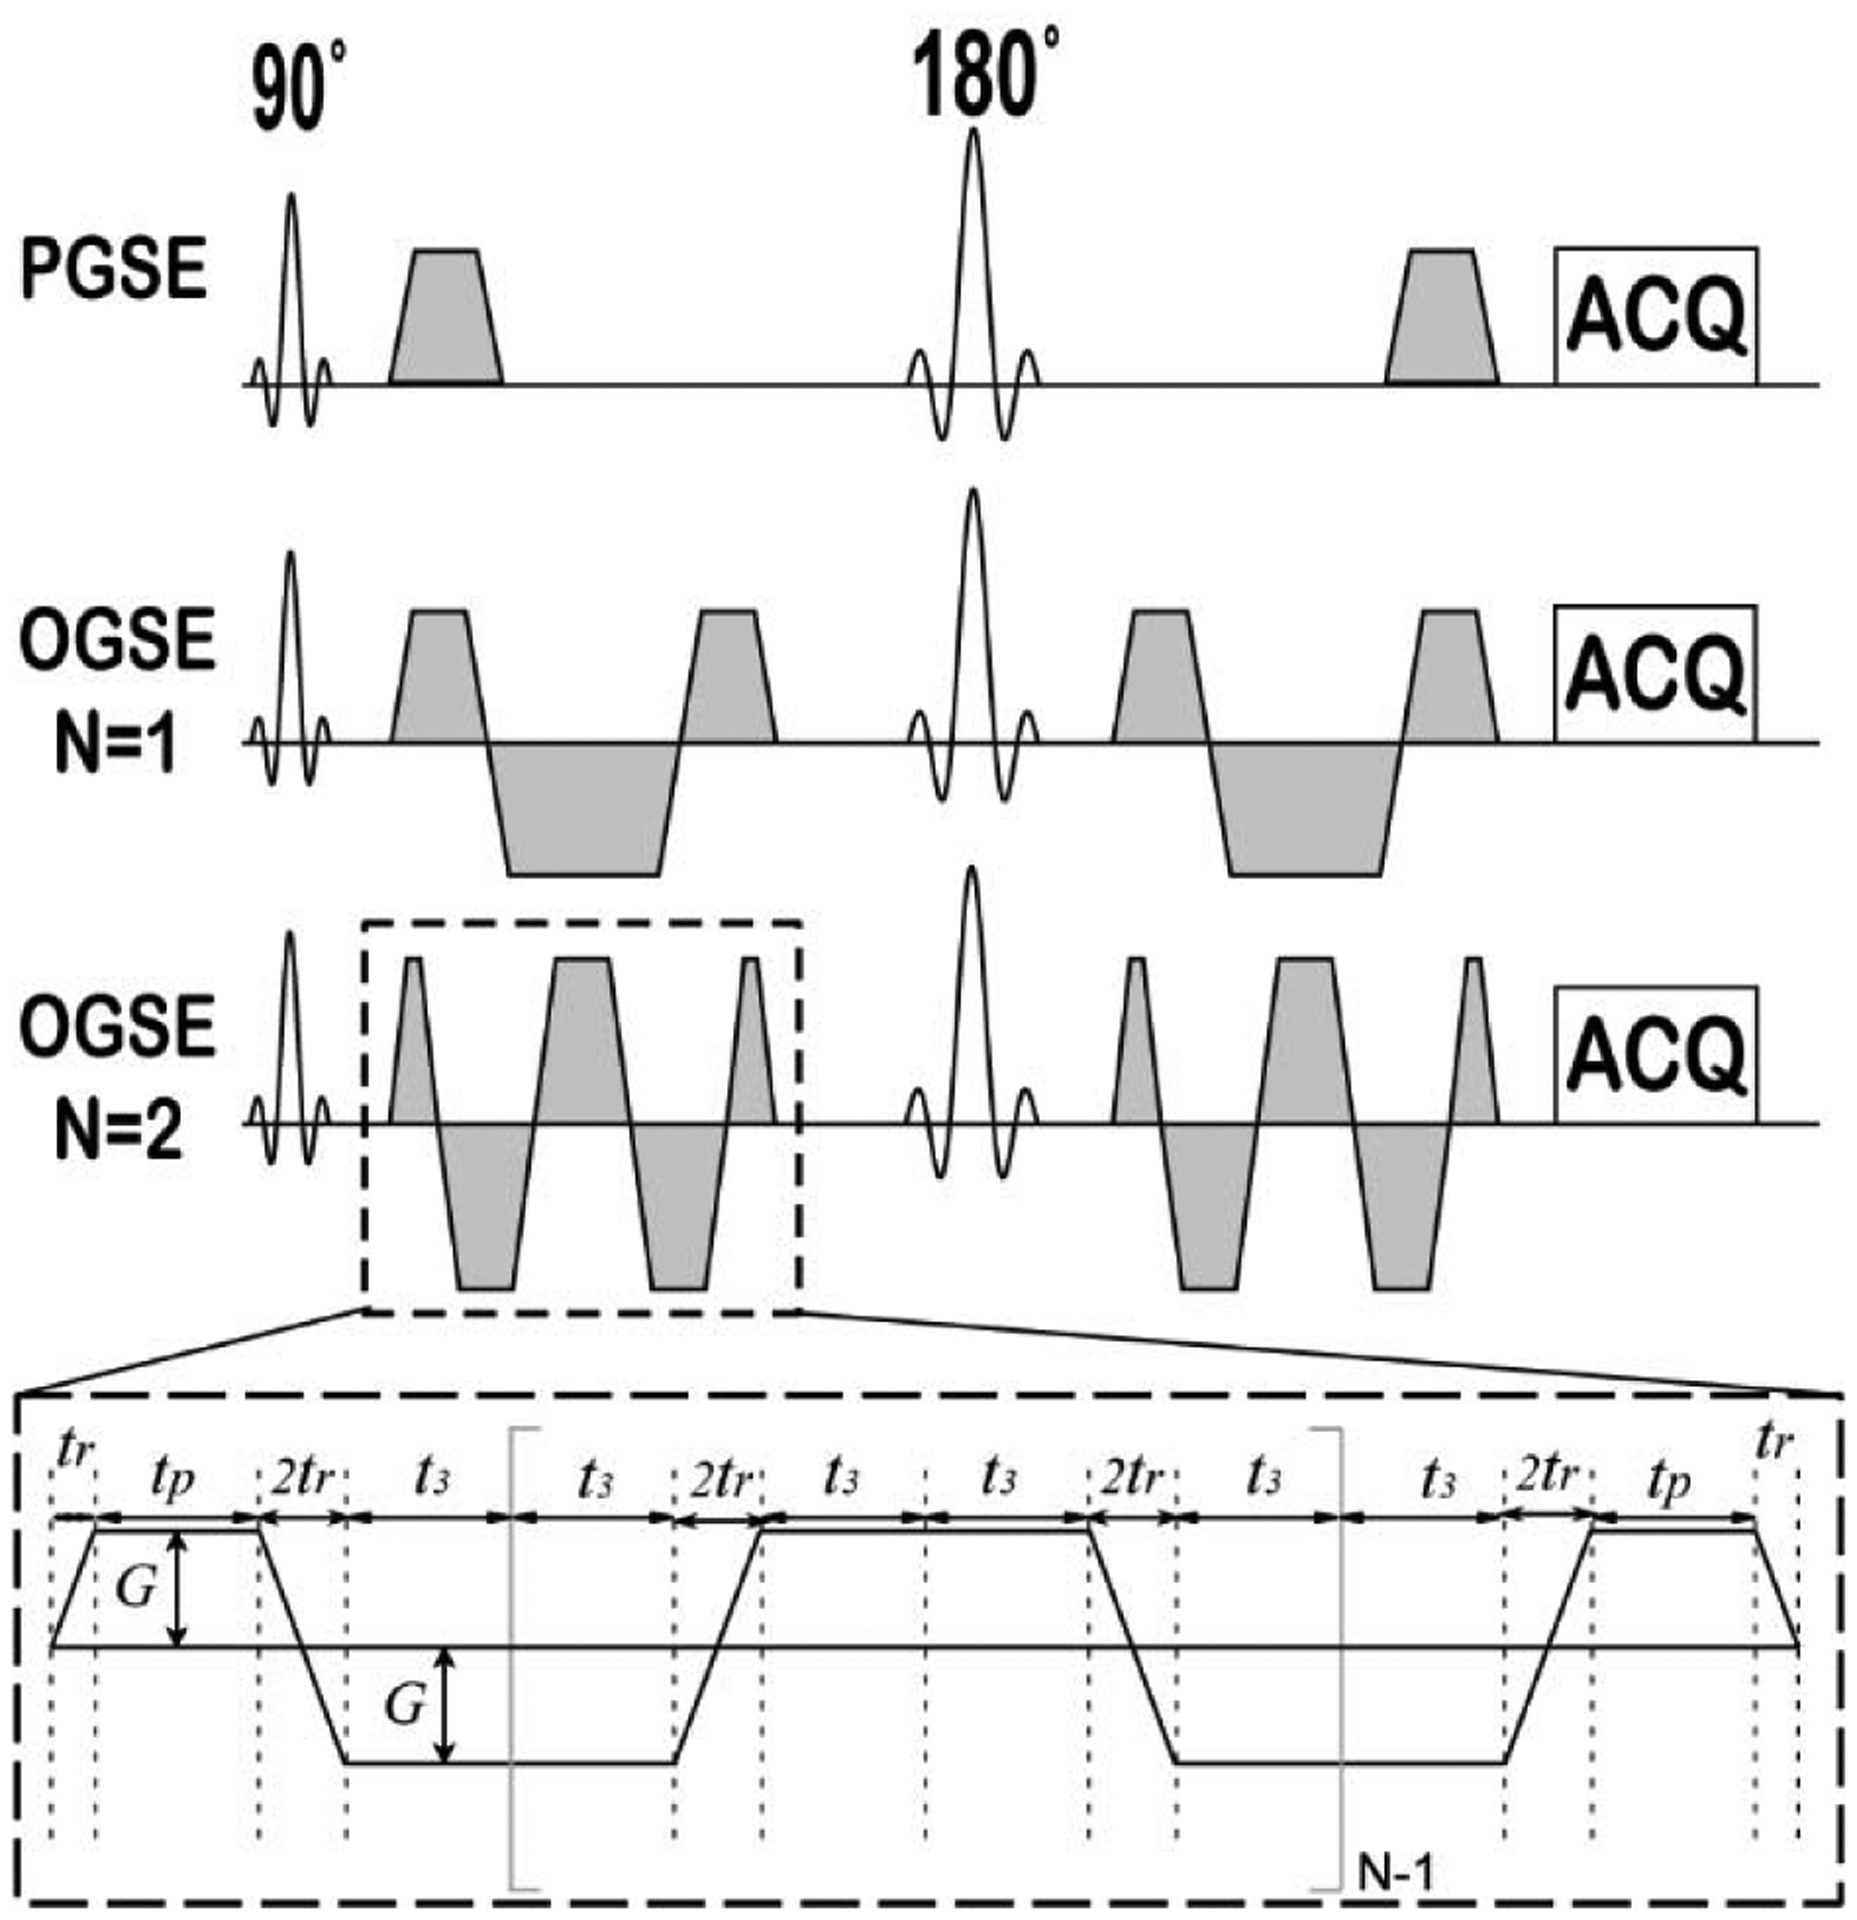
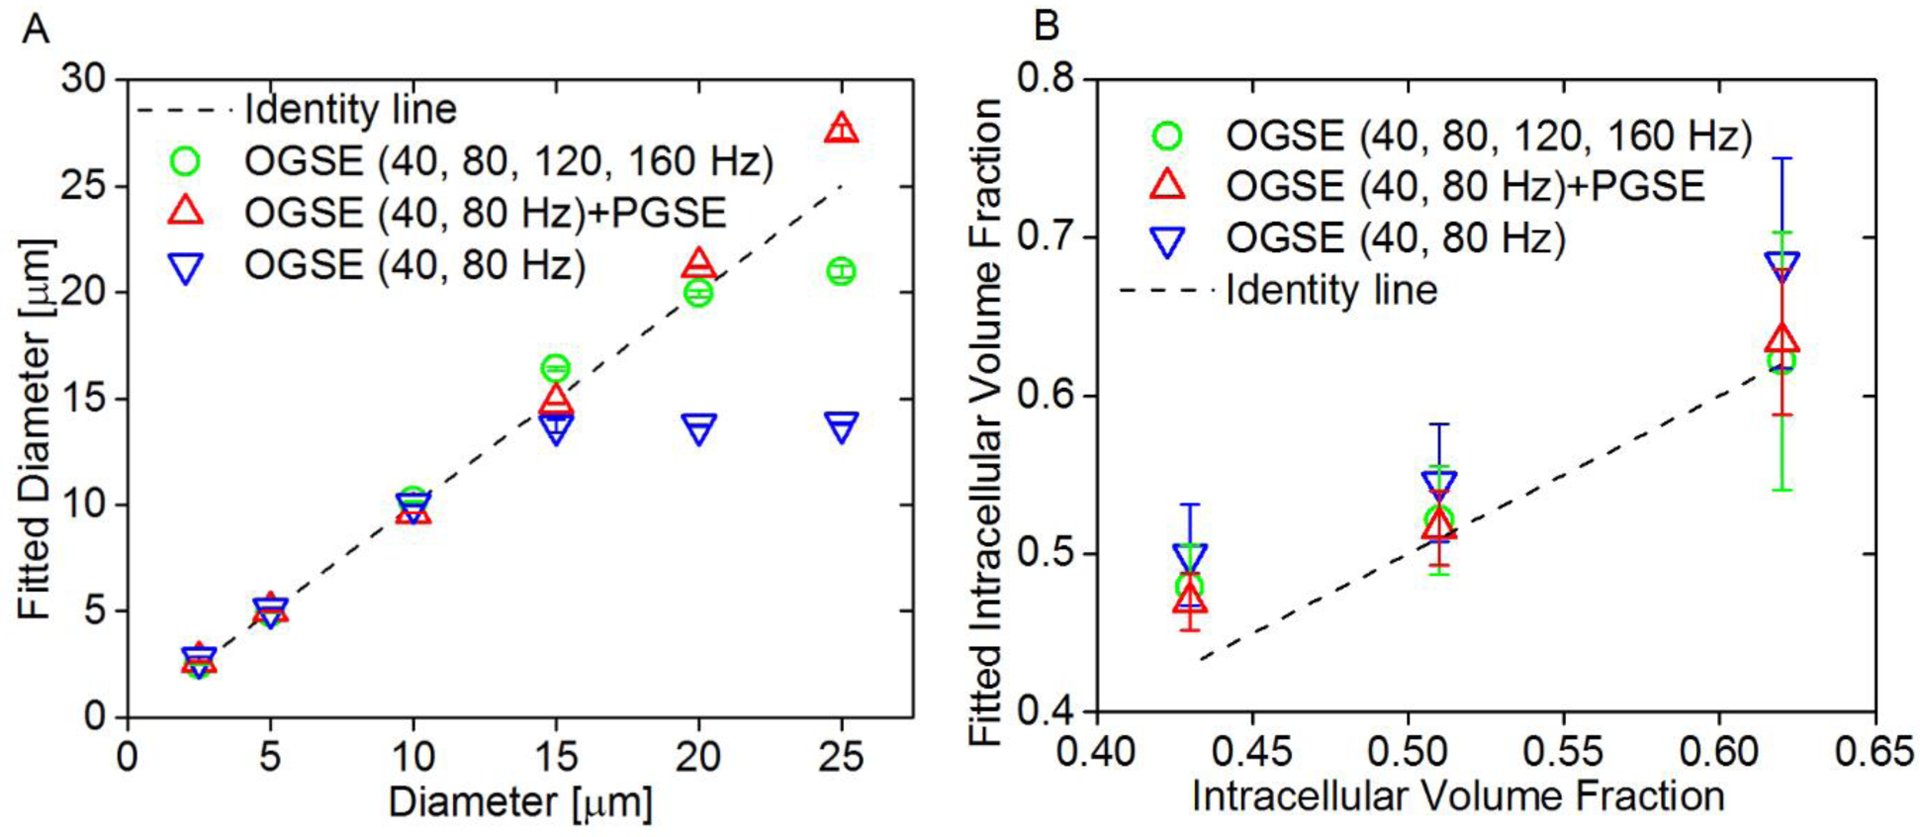
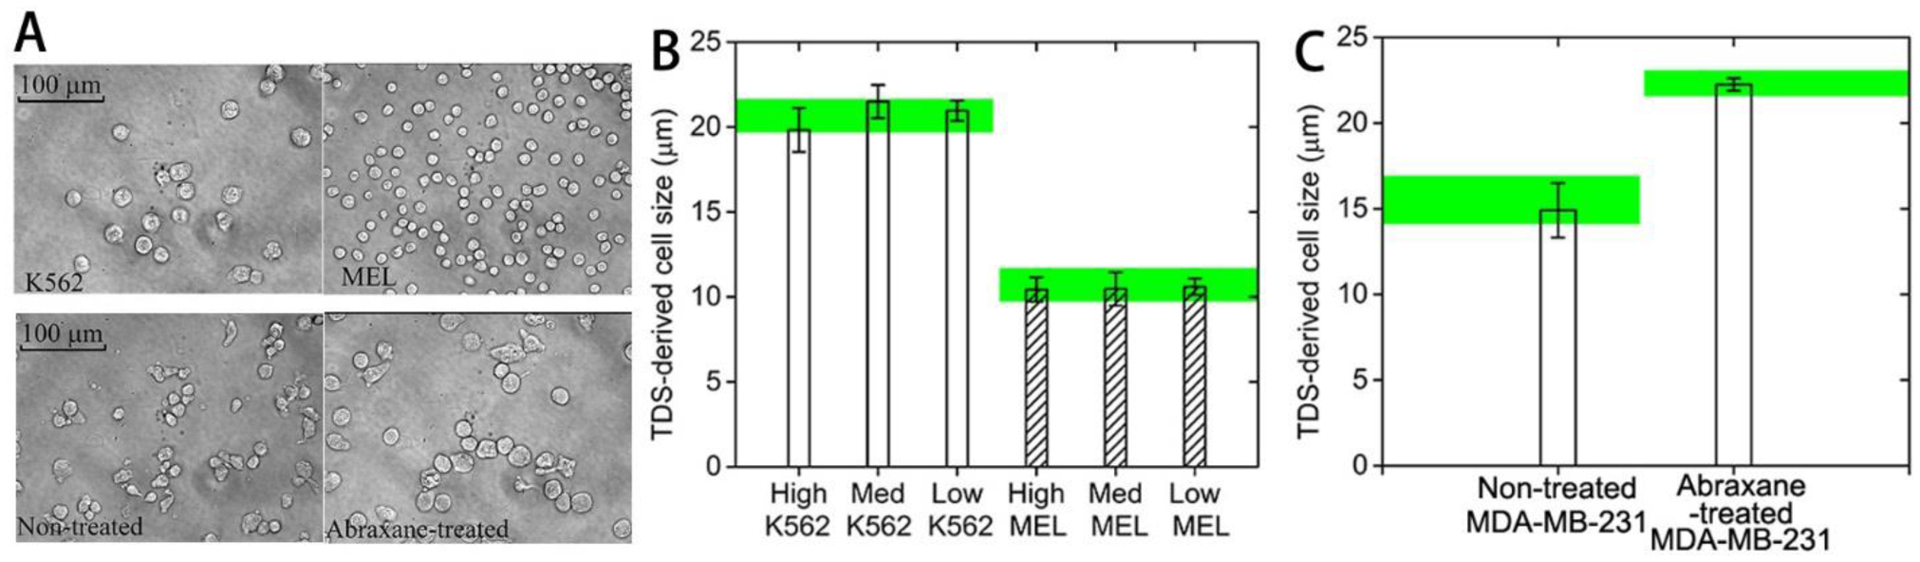
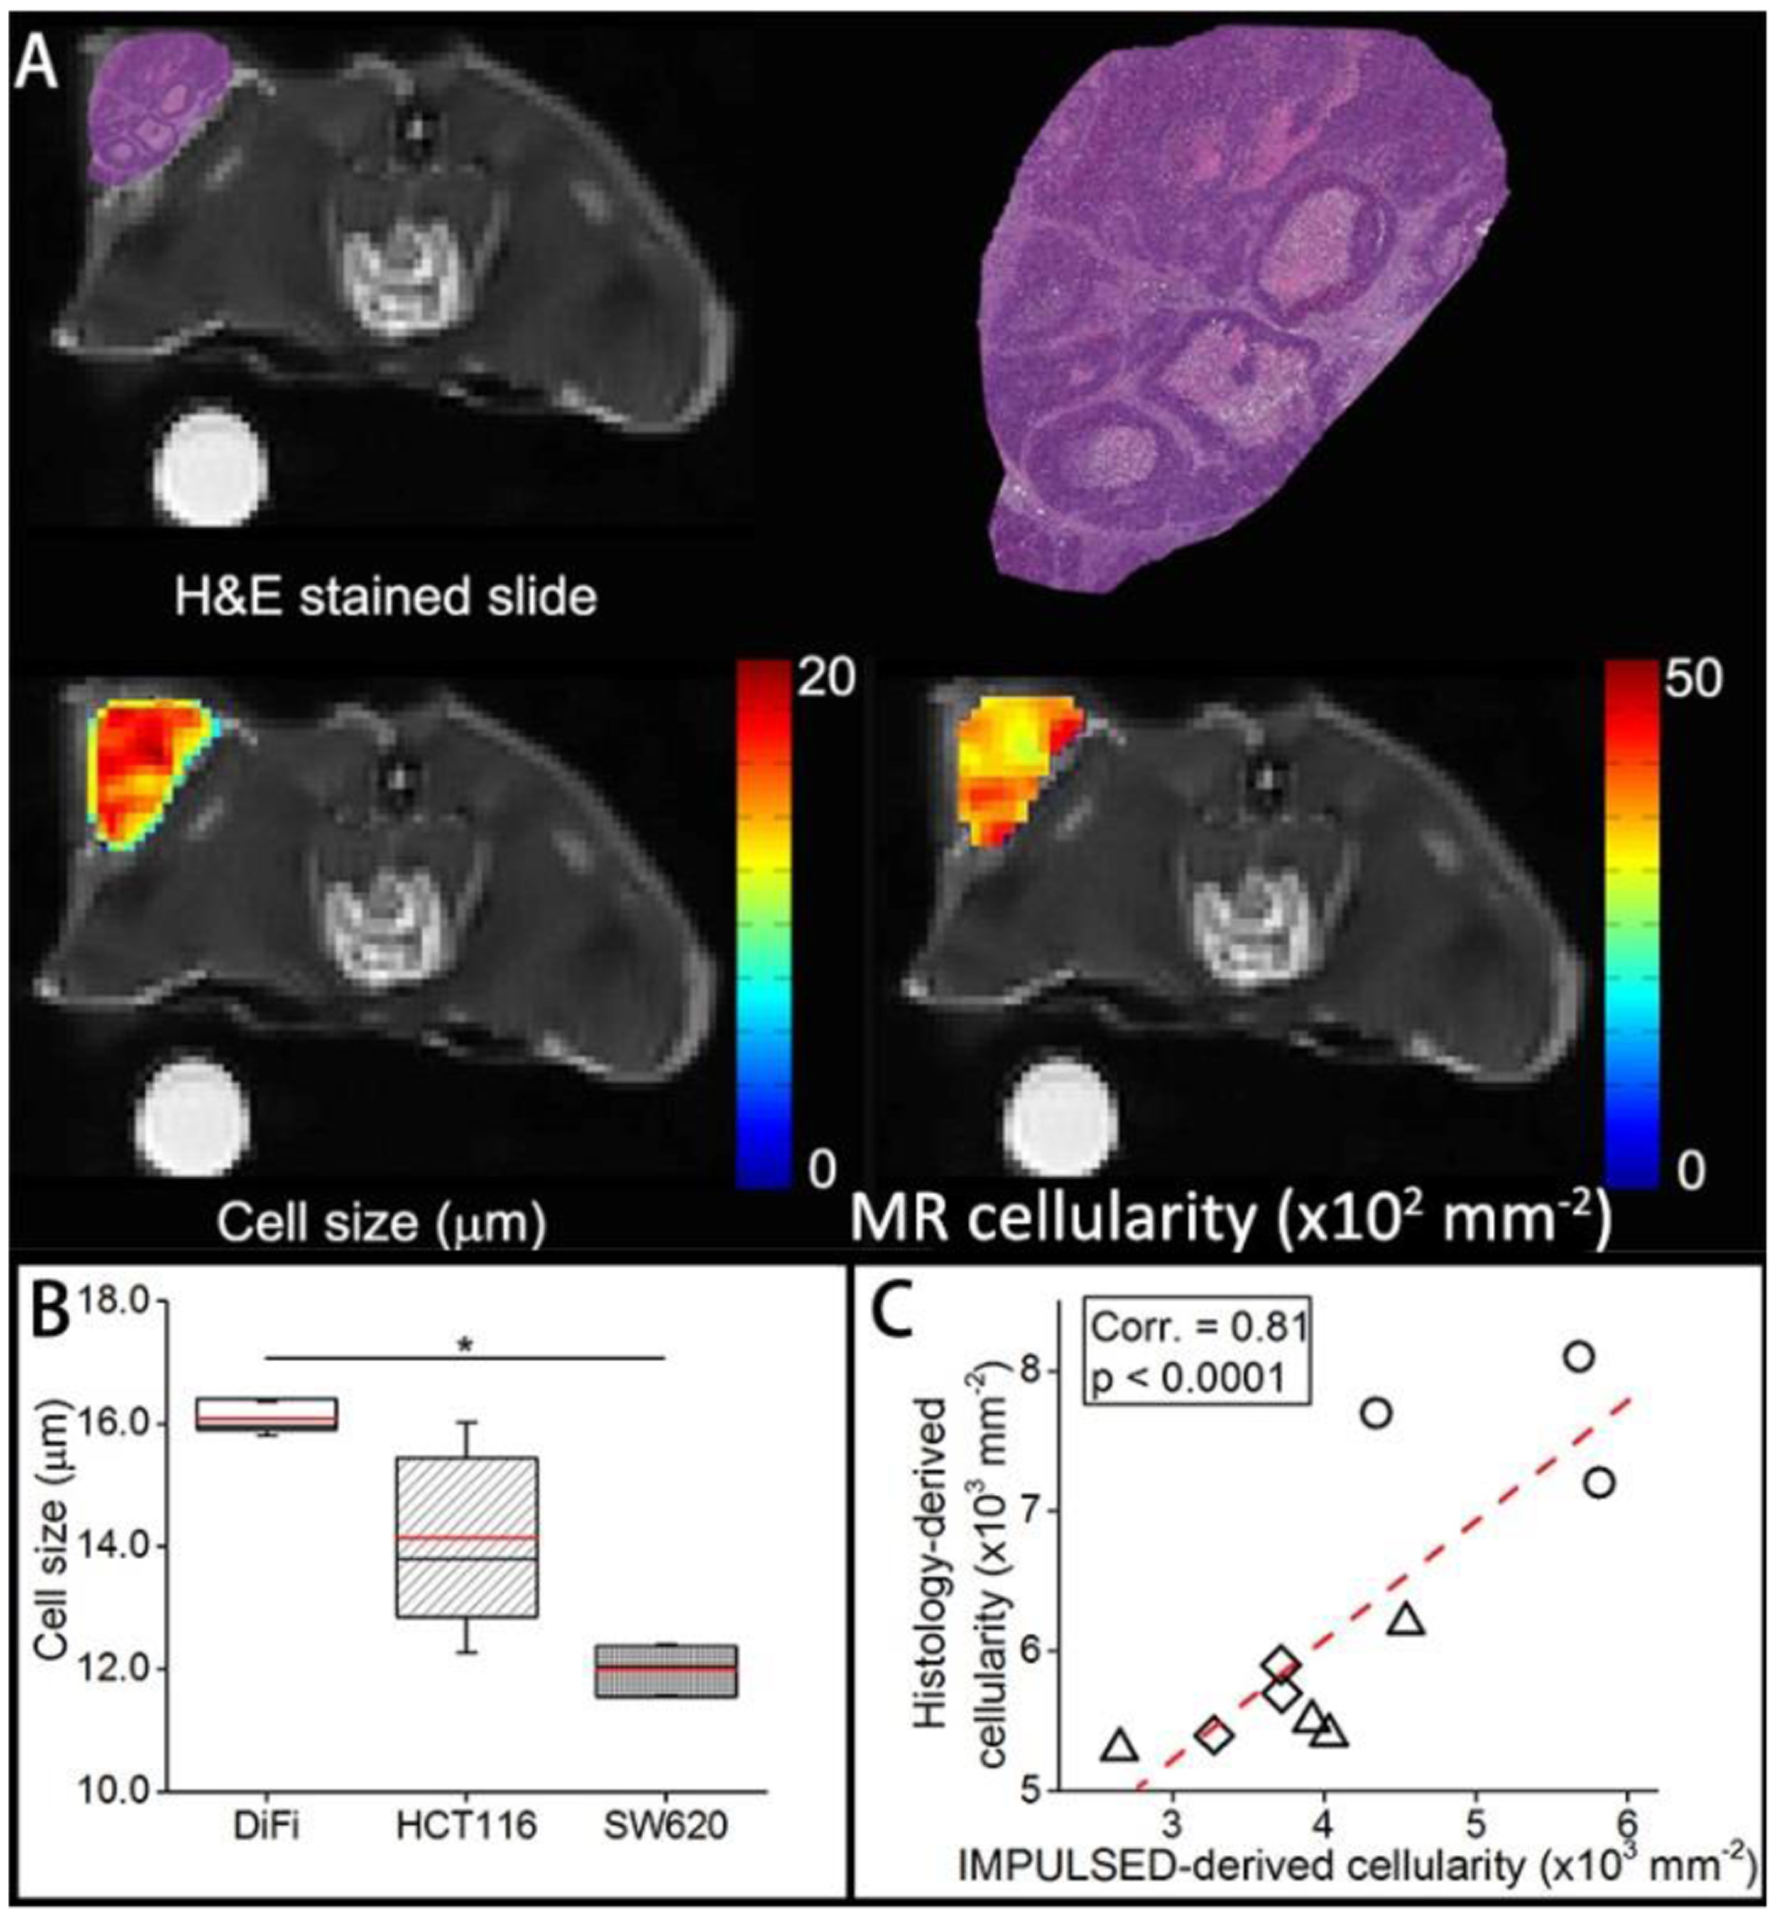
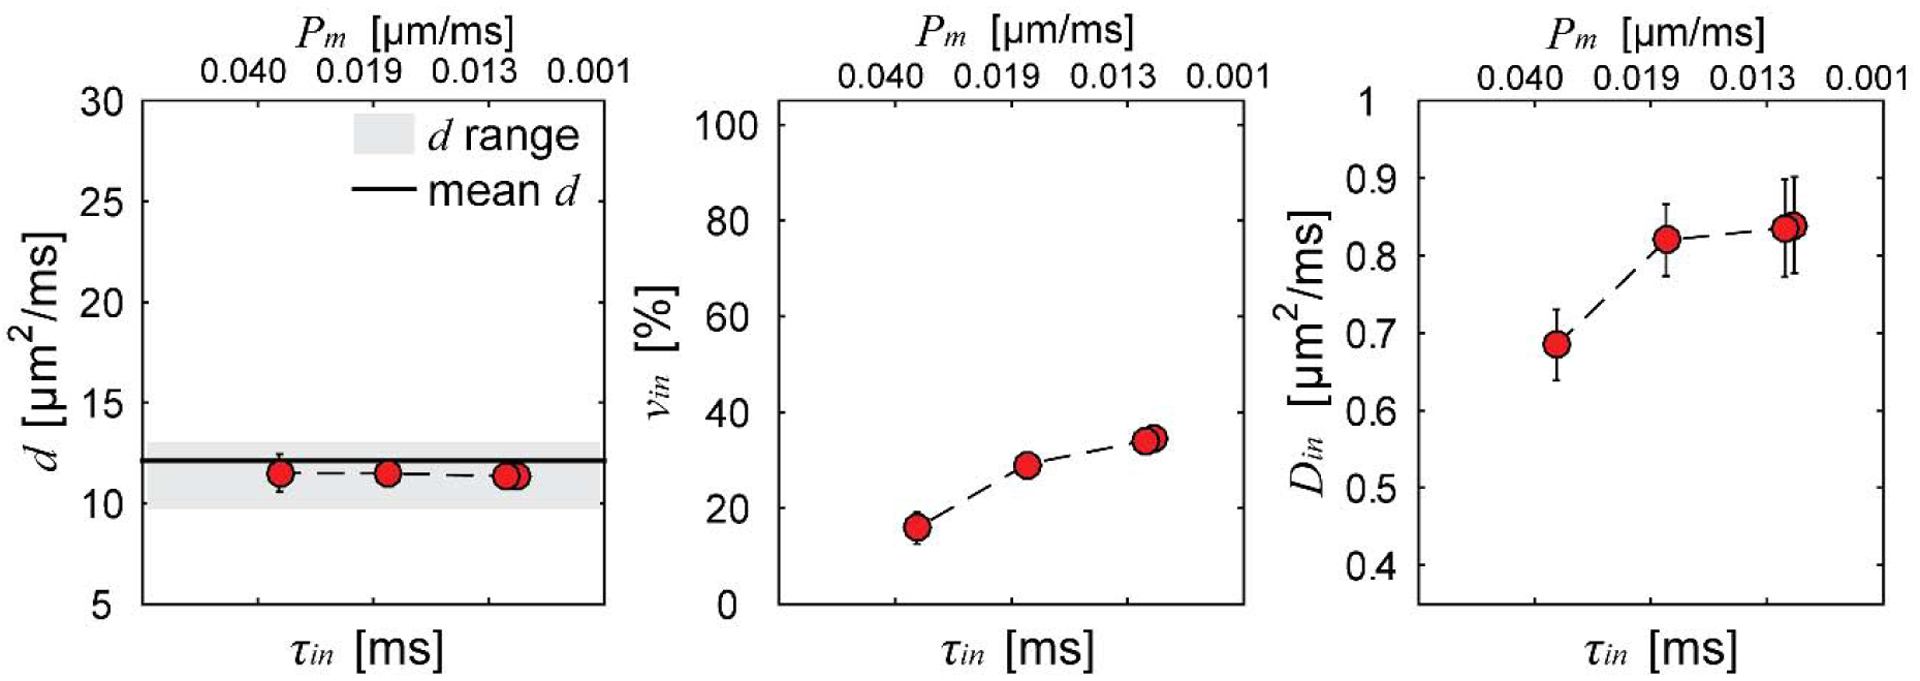
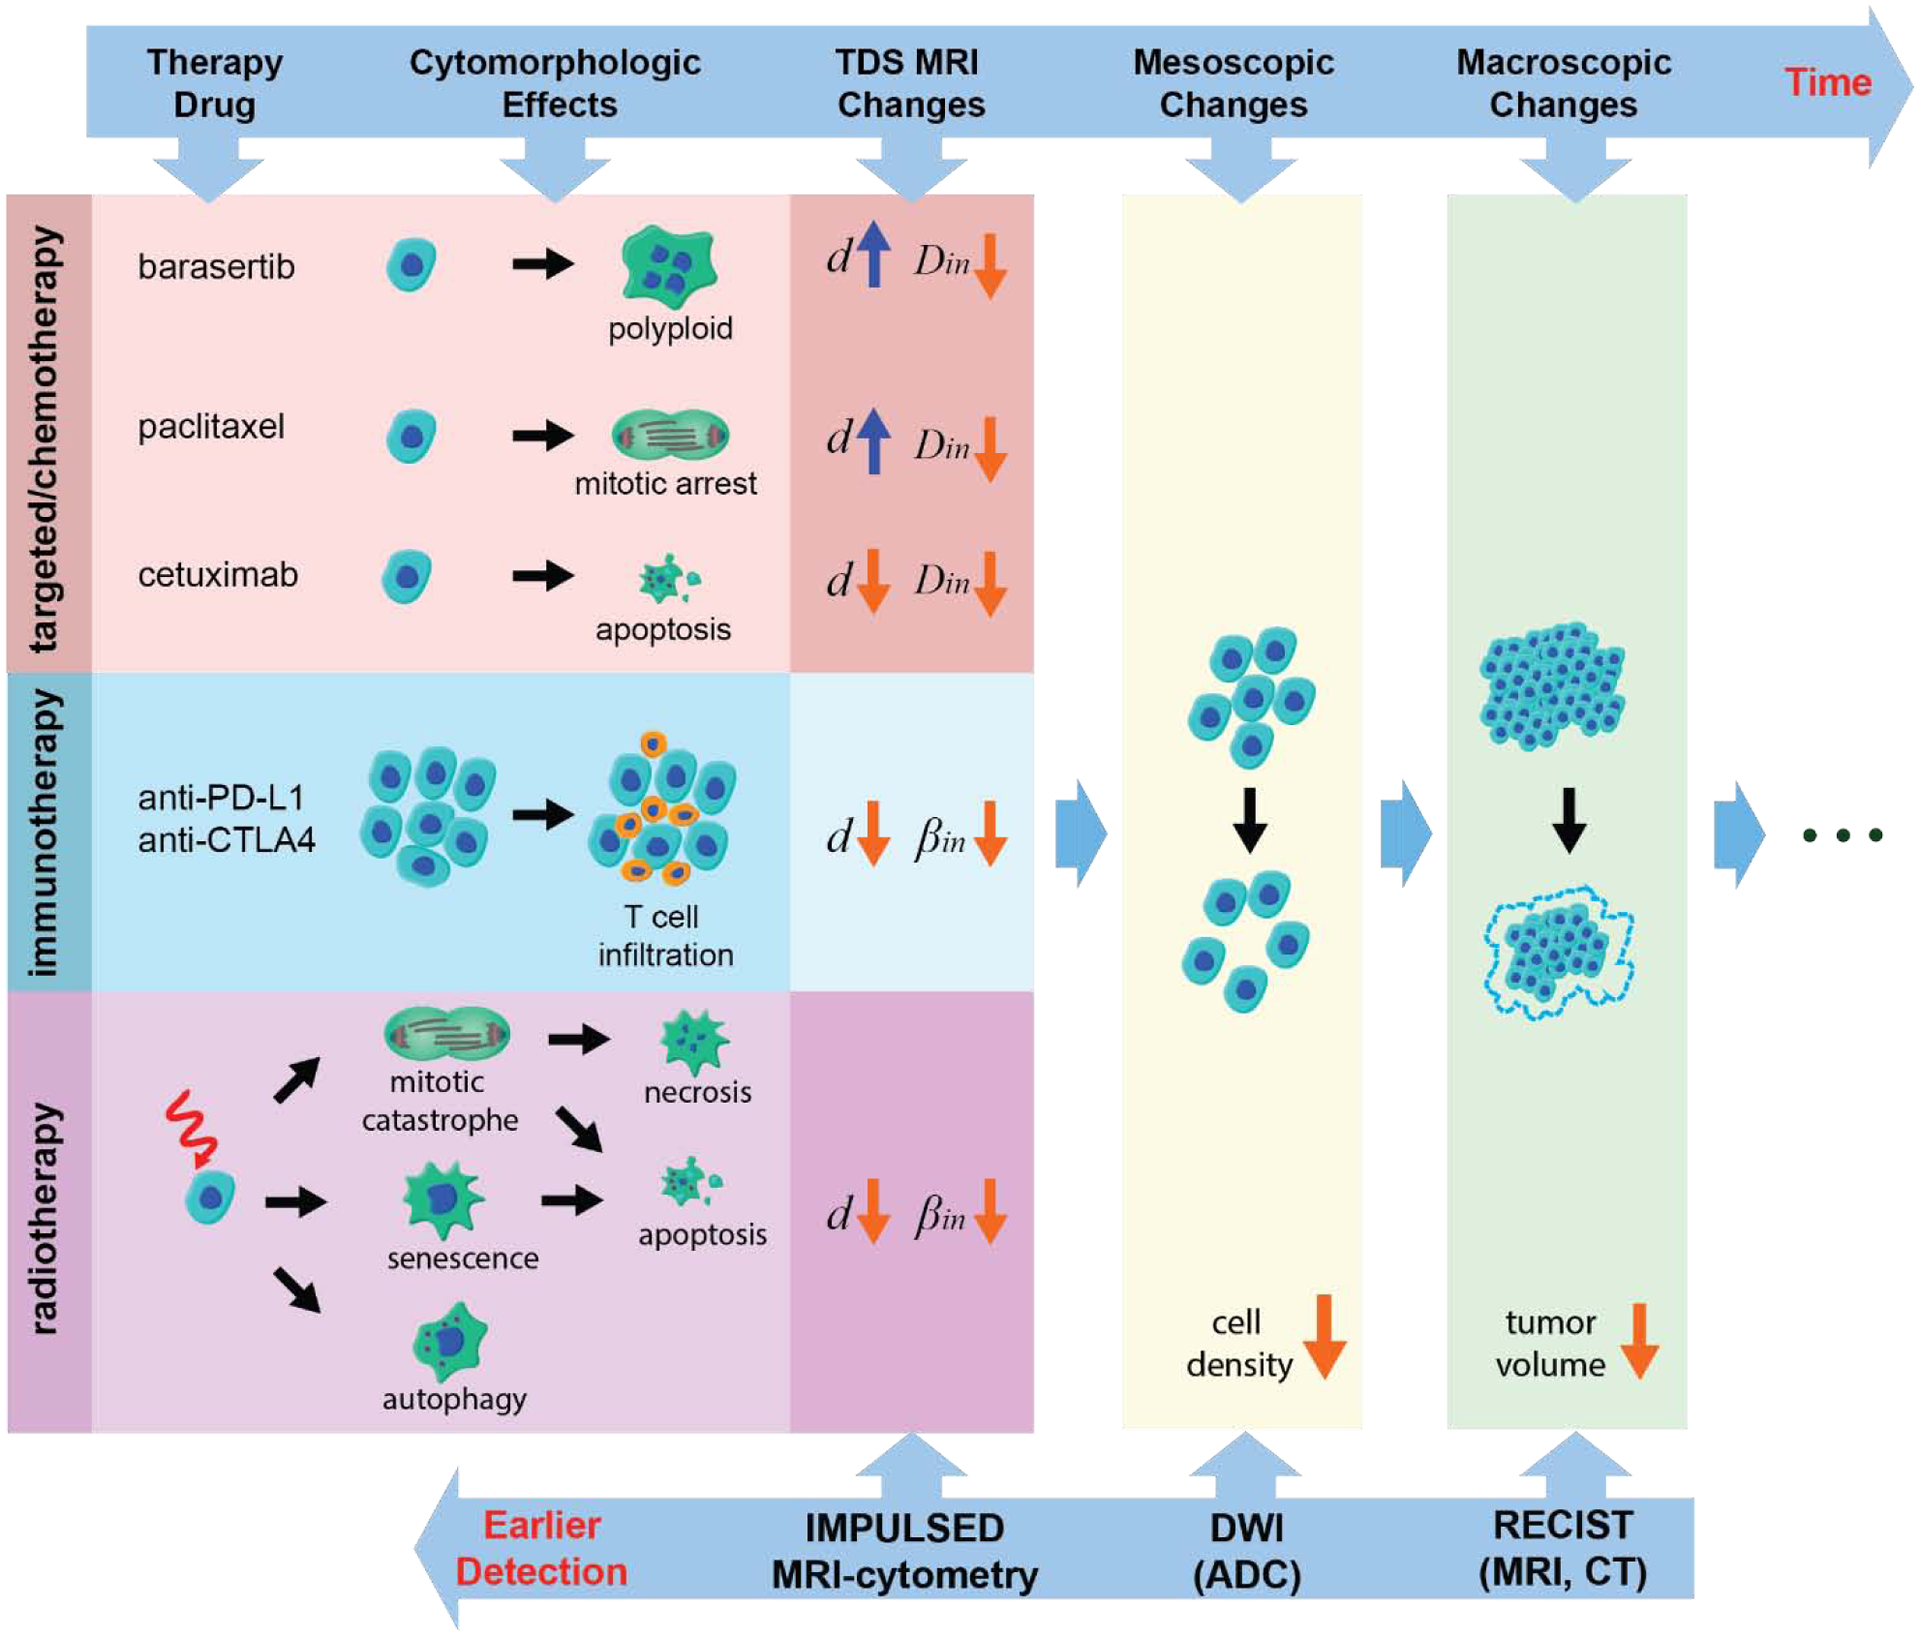
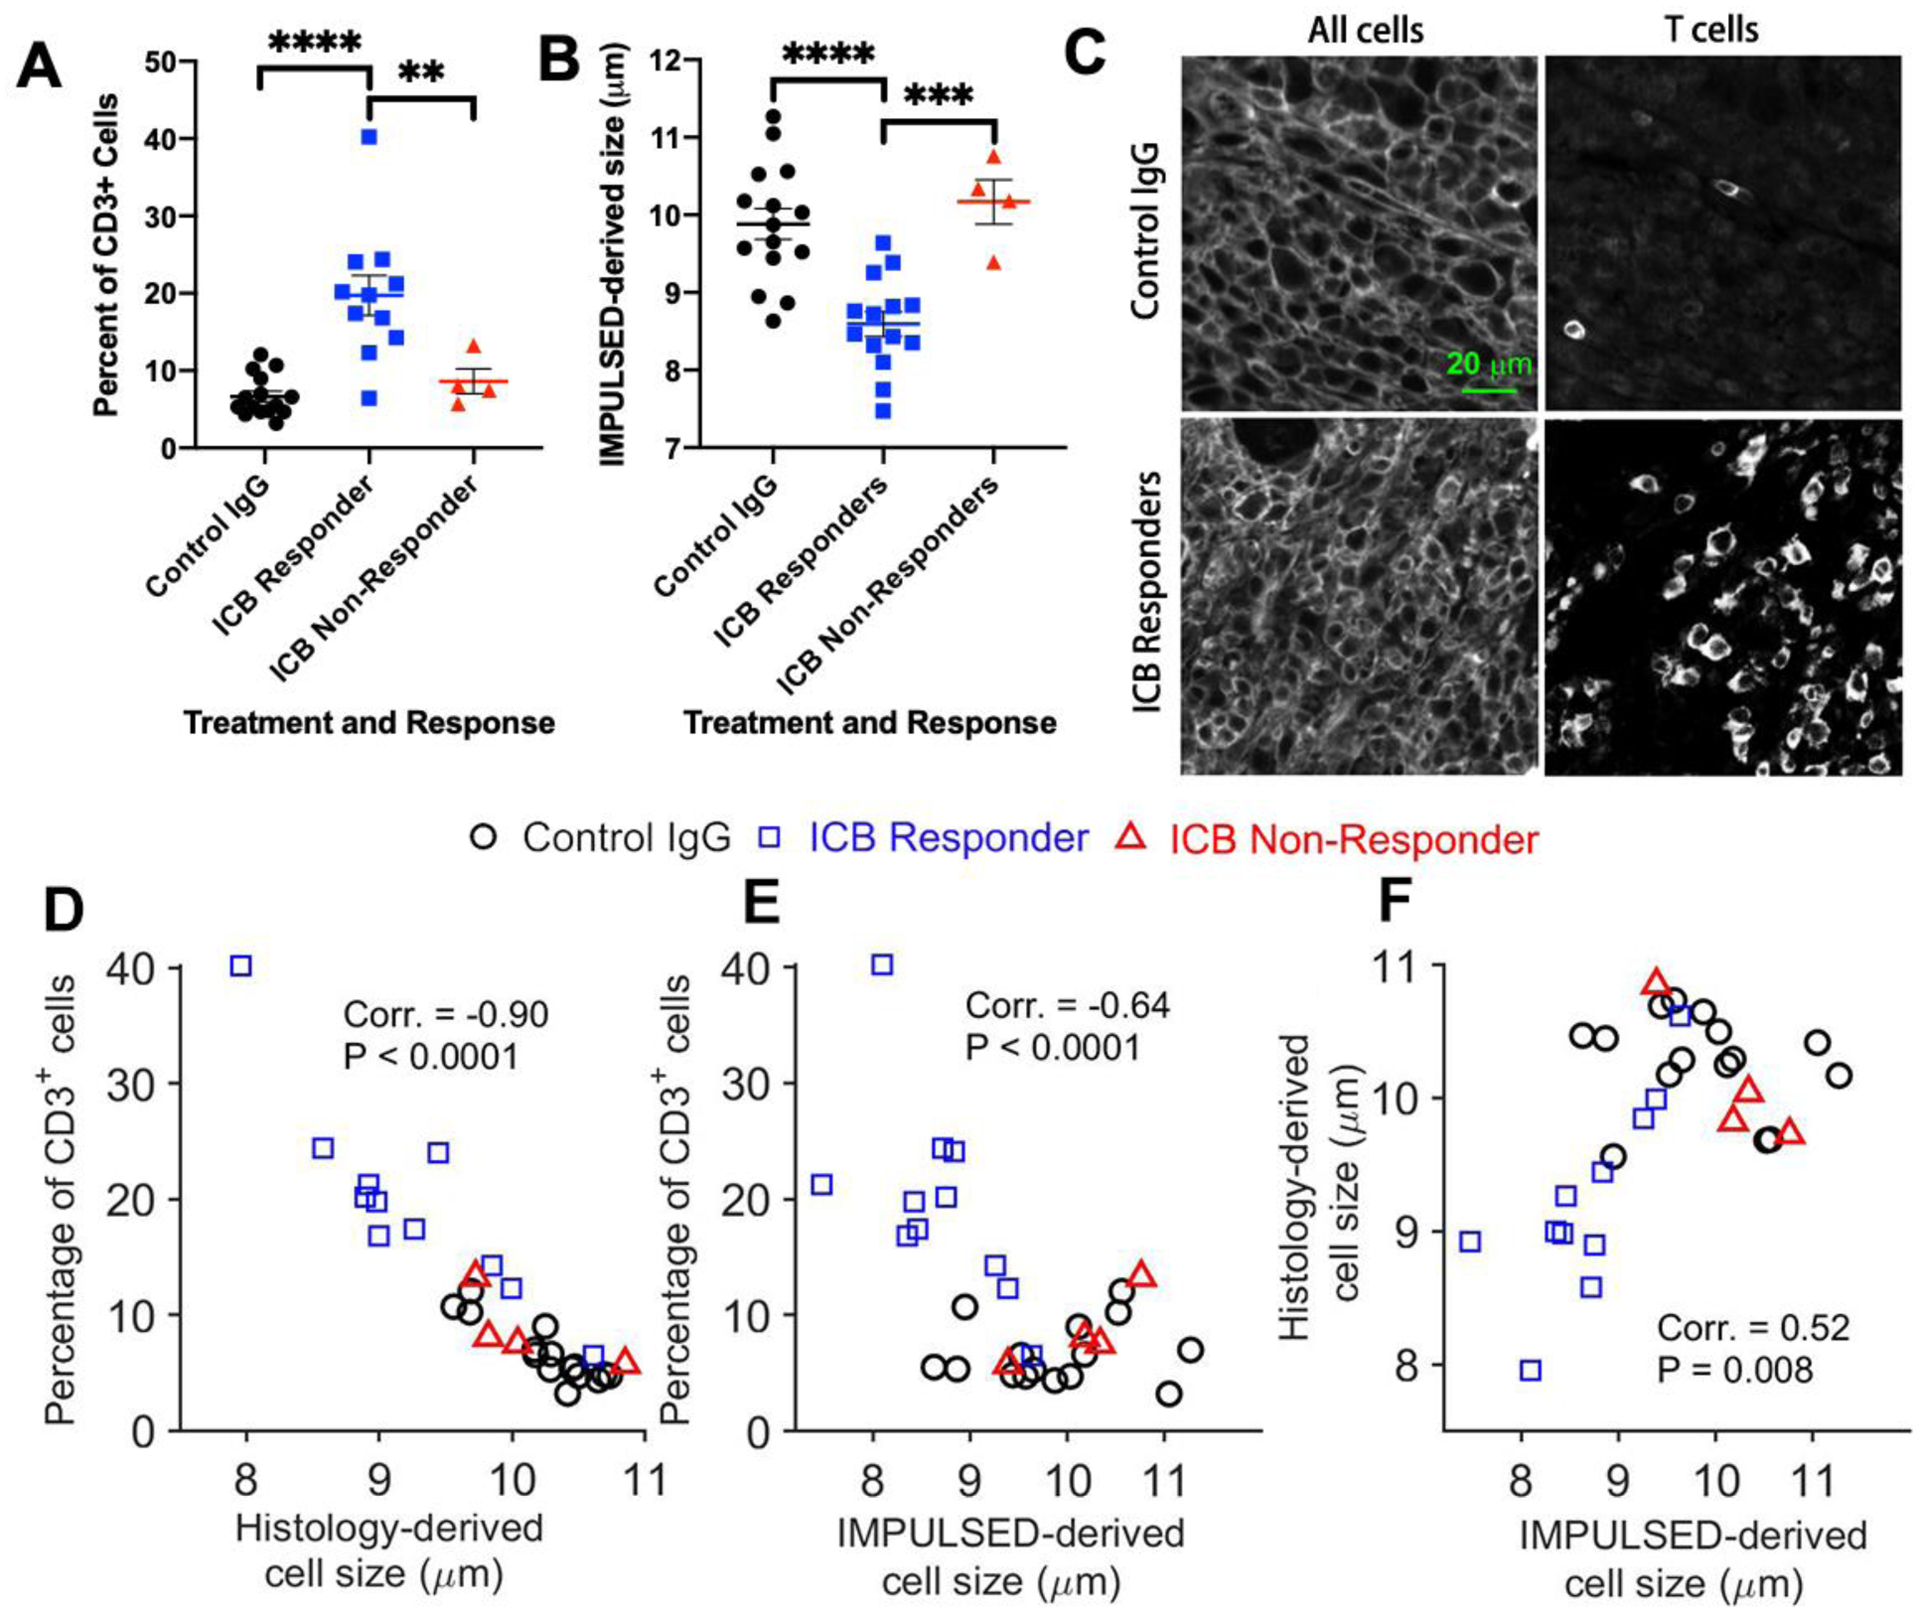
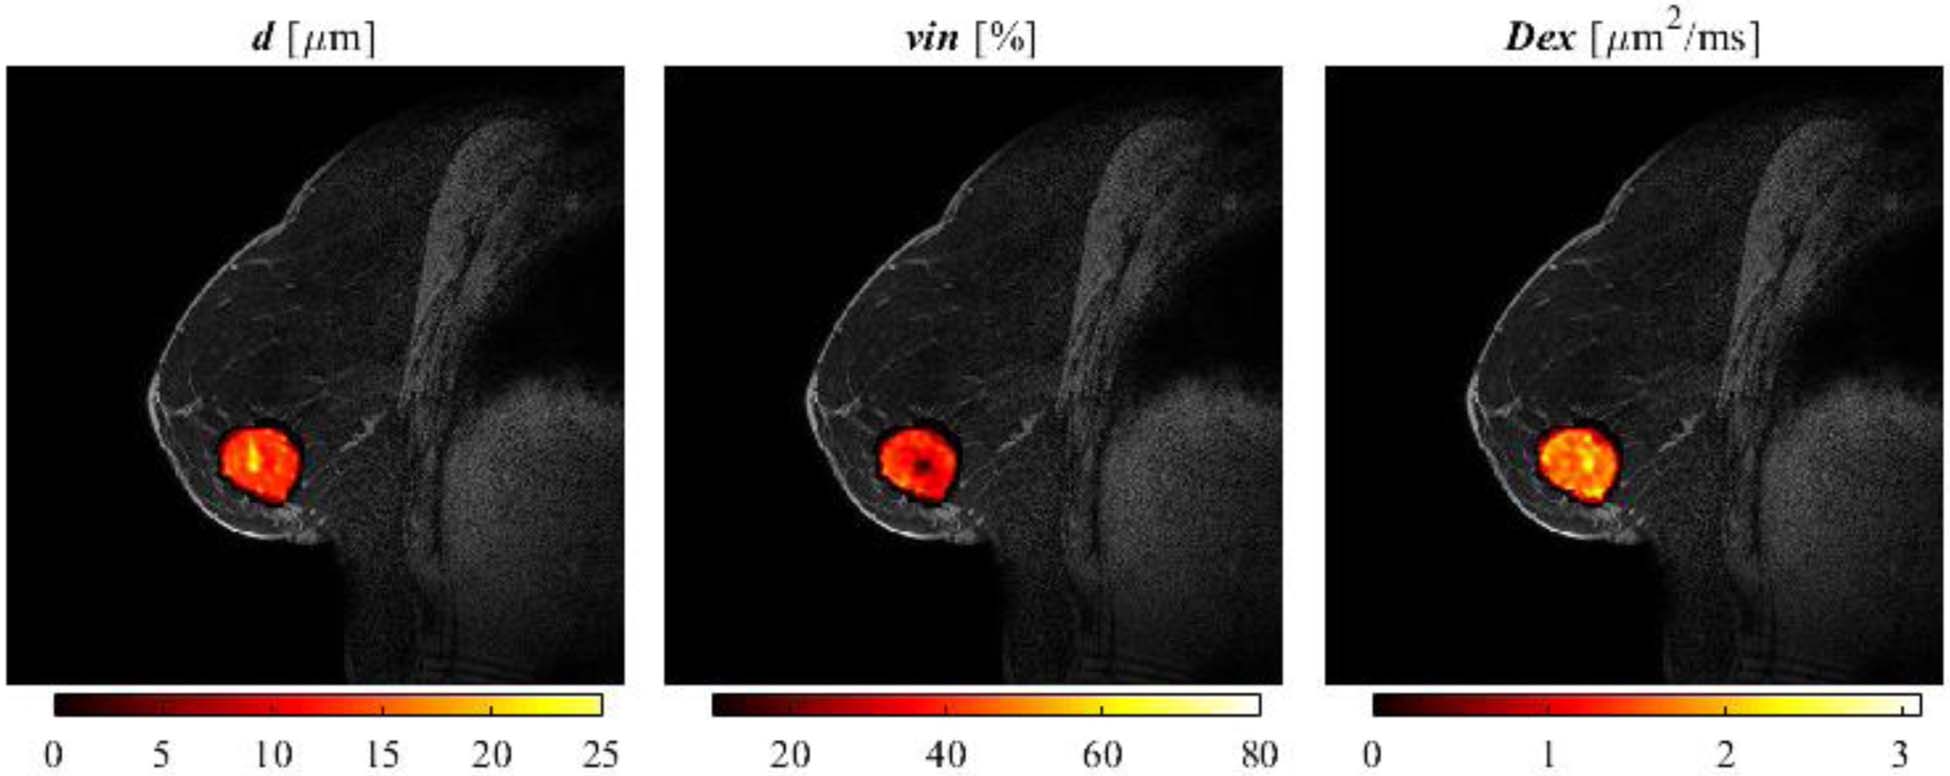
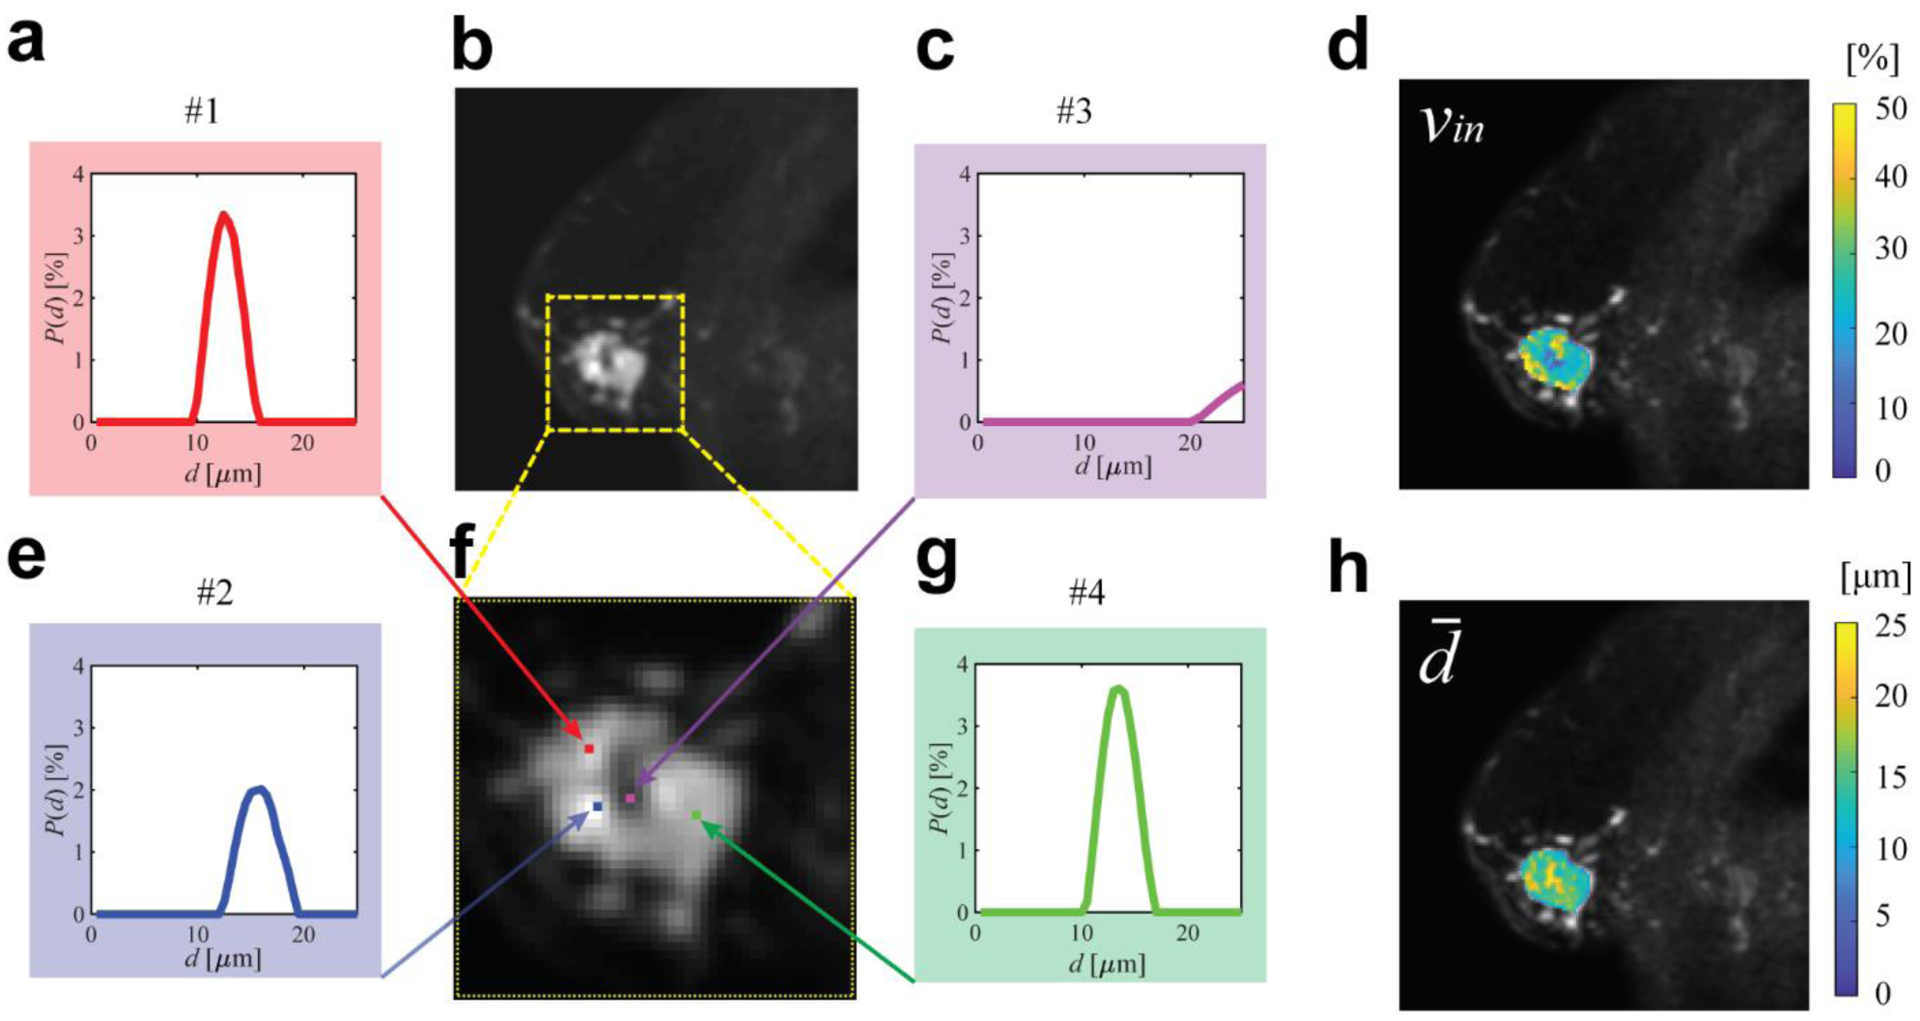
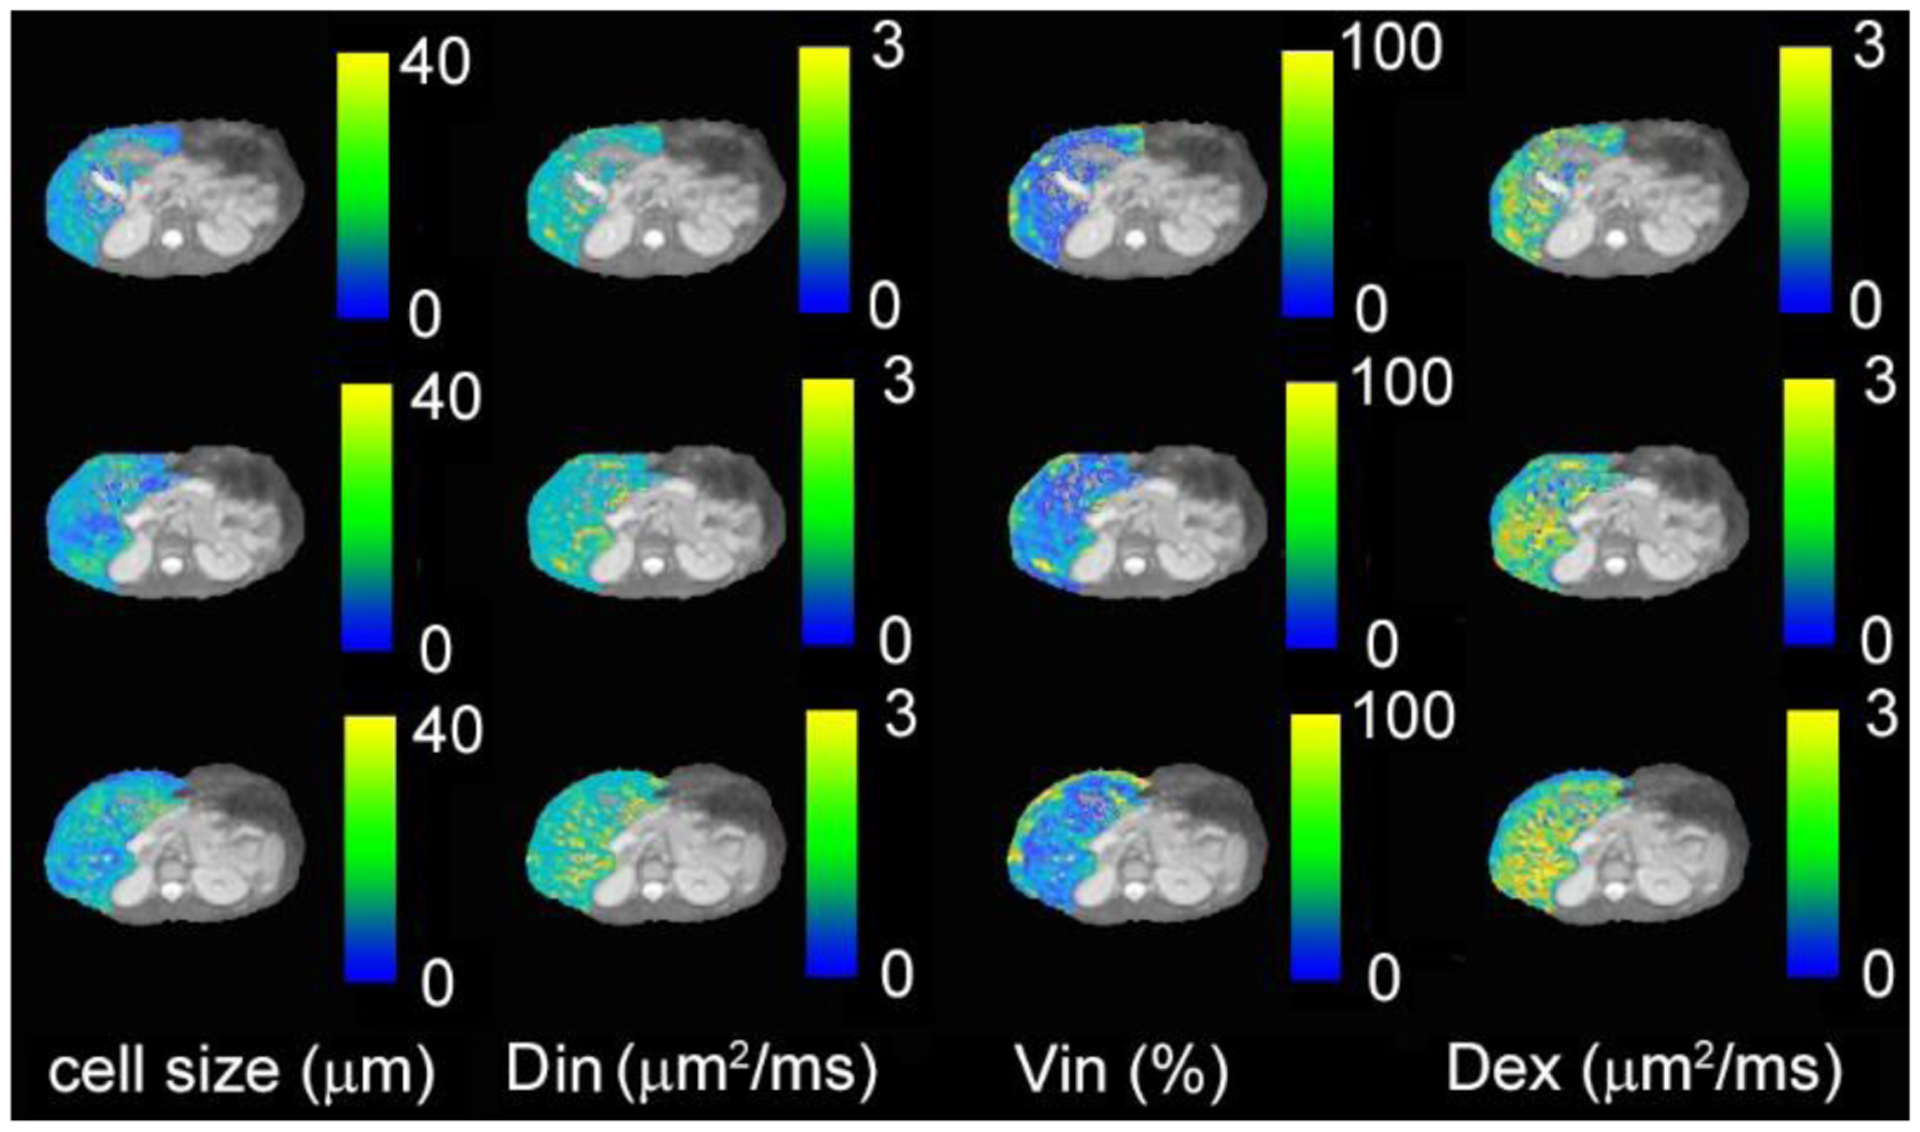
Cytological features such as cell size and intracellular morphology provide fundamental information on cell status and hence may provide specific information on changes that arise within biological tissues. Such information is usually obtained by invasive biopsy in current clinical practice, which suffers several well-known disadvantages. Recently, novel MRI methods such as IMPULSED (imaging microstructural parameters using limited spectrally edited diffusion) have been developed for direct measurements of mean cell size non-invasively. The IMPULSED protocol is based on using temporal diffusion spectroscopy (TDS) to combine measurements of water diffusion over a wide range of diffusion times to probe cellular microstructure over varying length scales. IMPULSED has been shown to provide rapid, robust, and reliable mapping of mean cell size and is suitable for clinical imaging. More recently, cell size distributions have also been derived by appropriate analyses of data acquired with IMPULSED or similar sequences, which thus provides MRI-cytometry. This review summarizes the basic principles, practical implementations, validations, and example applications of MR cell size imaging based on TDS and demonstrates how cytometric information can be used in various applications. In addition, the limitations and potential future directions of MR cytometry are identified including the diagnosis of nonalcoholic steatohepatitis of the liver and the assessment of treatment response of cancers.

Keywords: Cell size; Cytometry; Diffusion; IMPULSED; MRI; Oscillating gradient; dMRI.


Figures

Figure 1
Figure 1
Typical Diffusion-weighted signals for voxels from a single slice of healthy human liver. (A) raw DW signals; (B) Corrected DW signals with the removal of the IVIM effect.
Figure 2
Figure 2
Pulse sequences used in the IMPULSED data acquisitions.
Figure 3
Figure 3
(A) Correlation between fitted diameters and preset diameters in simulations. Fitted diameters generated from three different combinations of OGSE and PGSE signals, mean ± std (n=3, with three different intracellular volume fractions: 43%, 51%, and 62%) vs. preset diameters. The dot line represents the identity line. (B) Fitted intracellular volume fraction generated from three different combinations of OGSE and PGSE signals, mean ± std (n=6, with cell size ranging from 2.5 to 25 μm) vs. preset intracellular volume fractions. The dot line represents the identity line.
Figure 4
Figure 4
Microscopic pictures of K562, MEL, and MDA-MB-231 before and after anti-mitotic treatment. (B) IMPULSED-derived cell sizes for K562 and MEL at three different cell densities and for MDA-MB-231 before and after anti-mitotic treatment. Noted that the green bands represent the microscopy-derived cell sizes.
Figure 5
Figure 5
H&E stained histological image, IMPULSED-derived cell size and cell density maps of a representative slice through tumor, overlaid on T2-weighted MR images. (B). Box-and-whisker plot of the fitted cell size for three types of tumors. The 25th-75th percentiles are blocked by the box, the black and red bands inside the box are the median and mean, respectively, and the whiskers mark the SD. C. Correlation between histological-derived cellularities and IMPULSED-derived apparent cellularities for all the tumors.
Figure 6
Figure 6
Summary of IMPULSED fitted microstructural parameters versus intracellular water lifetime τin and cell membrane permeability Pm. Error bars in each subfigure denote across-sample STD. The dvw¯ range indicates histology-derived mean cell diameter ± STD of all cells, and mean d is the volume-weighted cell diameter.
Figure 7
Figure 7
Diagram of various cell morphology changes responding to anti-cancer treatment. All listed therapy approaches and corresponding TDS MRI results are reported previously: barasertib (7), paclitaxel (40), cetuximab (42), anit-PD-L1/anti-CTLA4 (4), and radiation (60)
Figure 8
Figure 8
(A) Tumors from ICB responders had a significantly higher percent of CD3+ T cells as measured by immunohistochemistry compared to ICB non-responders and control IgG-treated mice; (B) ICB responding tumors had a significantly smaller mean cell size as measured by IMPULSE than tumors from control or ICB non-responders; (C). Examples of Immunohistochemical analyses of MC38 tumors treated with either control IgG (top) or checkpoint inhibitors (bottom); (D). Validation of IMPULSED-derived cell sizes using histology.
Figure 9
Figure 9
Representative IMPULSED-derived maps of mean cell size d (left), intracellular volume fraction vin (middle), and extracellular diffusion coefficient Dex (rigth) overlaid on a high-resolution fat-suppressed anatomical image of a breast cancer patient.
Figure 10
Figure 10
Representative cell size distributions and MRI-Cytometry derived parametric maps of a breast tumor. (b) is T2-weighted b = 0 image of the tumor and (f) is an enlarged view. (a,c,e,g) are four examples of cell size distributions. (d) and (h) are MRI-Cytometry derived vin and d¯ maps of the same tumor.
Figure 11
Figure 11
IMPULSED-derived maps of mean cell size d, intracellular diffusion coefficient Din, apparent intracellular volume fraction vin, and extracellular diffusion coefficient Dex overlaid on a high-resolution fat-suppressed anatomical image for three continuous slices of liver from a healthy human subject.

References

    1. Moseley JB, Nurse P. Cell division intersects with cell geometry. Cell 2010;142(2):184–188. - PubMed
    1. Ginzberg MB, Kafri R, Kirschner M. Cell biology. On being the right (cell) size. Science 2015;348(6236):1245075. - PMC - PubMed
    1. Bortner CD, Cidlowski JA. A Necessary Role for Cell Shrinkage in Apoptosis. Biochemical Pharmacology 1998;56:1549–1559. - PubMed
    1. Jiang X, Dudzinski S, Beckermann KE, Young K, McKinley E, J McIntyre O, Rathmell JC, Xu J, Gore JC. MRI of tumor T cell infiltration in response to checkpoint inhibitor therapy. Journal for ImmunoTherapy of Cancer 2020;8(1):e000328. - PMC - PubMed
    1. Xu J, Does MD, Gore JC. Sensitivity of MR diffusion measurements to variations in intracellular structure: effects of nuclear size. Magn Reson Med 2009;61(4):828–833. - PMC - PubMed

Publication types

LinkOut - more resources