. 2020 Dec 16;20(24):7198.
doi: 10.3390/s20247198.

Single-Option P300-BCI Performance Is Affected by Visual Stimulation Conditions

Affiliations

Single-Option P300-BCI Performance Is Affected by Visual Stimulation Conditions

Juan David Chailloux Peguero et al. Sensors (Basel). .

Abstract

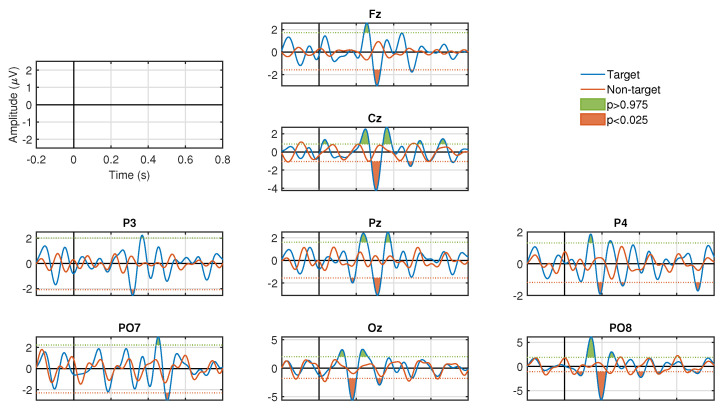
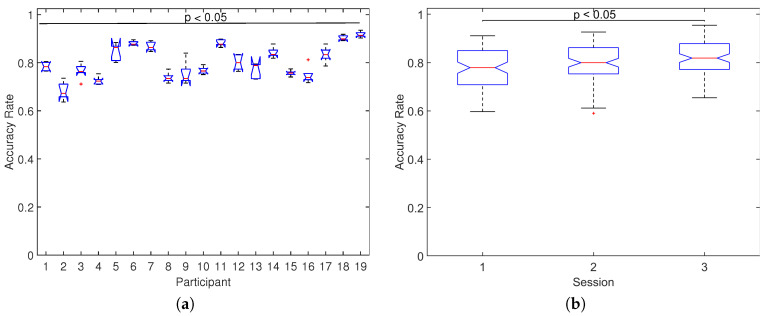
The P300 paradigm is one of the most promising techniques for its robustness and reliability in Brain-Computer Interface (BCI) applications, but it is not exempt from shortcomings. The present work studied single-trial classification effectiveness in distinguishing between target and non-target responses considering two conditions of visual stimulation and the variation of the number of symbols presented to the user in a single-option visual frame. In addition, we also investigated the relationship between the classification results of target and non-target events when training and testing the machine-learning model with datasets containing different stimulation conditions and different number of symbols. To this end, we designed a P300 experimental protocol considering, as conditions of stimulation: the color highlighting or the superimposing of a cartoon face and from four to nine options. These experiments were carried out with 19 healthy subjects in 3 sessions. The results showed that the Event-Related Potentials (ERP) responses and the classification accuracy are stronger with cartoon faces as stimulus type and similar irrespective of the amount of options. In addition, the classification performance is reduced when using datasets with different type of stimulus, but it is similar when using datasets with different the number of symbols. These results have a special connotation for the design of systems, in which it is intended to elicit higher levels of evoked potentials and, at the same time, optimize training time.

Keywords: P300 BCI; performance assessment; visual stimuli paradigm.


Conflict of interest statement

The authors declare that the research was conducted in the absence of any commercial or financial relationships that could be construed as a potential conflict of interest.

Ethical Statements: All subjects gave their informed consent for inclusion before they participated in the study. The study was conducted in accordance with the Declaration of Helsinki, and the protocol was approved by the School of Medicine’s Ethics Committee in Investigation at Tecnologico de Monterrey (ITESM) and the School of Medicine’s Committee of Investigation at Tecnologico de Monterrey (ITESM)(Registration numbers with the National Commission of Bioethics: CONBIOETICA-19-CEI-011-20161017 for the Ethics Committee in Investigation and 17 CI 19 039 003 for the Committee of Investigation).

Figures

Figure 1
Figure 1
Description of the experimental paradigm. (a) Picture of the experimental setup with a participant, the computer screen with the Graphical User Interface (GUI) displaying a set of 5 stimuli and the instruction box, and the electroencephalogram (EEG) recording system. (b) Illustration of the temporal sequence of a block. Each block consists of five phases: Fixation, Target Presentation, Preparation, Stimulation, and Rest.
Figure 2
Figure 2
Screenshots of the GUI with the two visual configurations under study. (a) Illustration of the two stimulation conditions with the configuration for 5 symbols. Left panel: standard flash based on green-highlight of the stimulus or stimulus (SF). Right panel: superimposing a yellow smiling cartoon face or cartoon face (CF). (b) Illustration of the configuration on the screen for 4, 6, 7, 8, and 9 symbols for both stimulation conditions. Note that, in all cases, the symbols are evenly distributed on the screen and the information box is in the bottom.
Figure 3
Figure 3
ERP responses for all channels in one participant for the target (blue signal) and non-target (red signal) events used in single-trial classification for SF stimulus. Reported signal-to-noise ratios (target vs. non-target): Fz-3.63 dB, Cz-0.48 dB, P3-0.88 dB, Pz-3.20 dB, P4-2.99 dB, PO7-1.86 dB, PO8-4.02 dB, Oz-4.26 dB. Green and orange areas in the ERP correspond to the positive and negative peaks that presented significant differences (p<0.05, two tail test) with the estimated Probability Density Function (PDF) of the baseline period. No significant peaks are observed in the ERP for the non-target condition.
Figure 4
Figure 4
ERP responses for all channels in one participant for the target (blue signal) and non-target (red signal) events used in single-trial classification for CF stimulus. Reported signal-to-noise ratios (target vs. non-target): Fz-10.38 dB, Cz-7.10 dB, P3-8.46 dB, Pz-7.51 dB, P4-6.36 dB, PO7-4.89 dB, PO8-6.05 dB, Oz-4.46 dB. Green and orange areas in the ERP correspond to the positive and negative peaks that presented significant differences (p<0.05, two tail test) with the estimated PDF of the baseline period. No significant peaks are observed in the ERP for the non-target condition.
Figure 5
Figure 5
Statistical significance for all channels in one participant for the target and non-target events used in single-trial classification for (a) SF stimulus and (b) CF stimulus.
Figure 6
Figure 6
Across all participants and sessions, distribution of accuracy rates for both types of stimuli (CF and SF). Significant differences were found between the two distributions (p<0.05, Wilcoxon rank-sum test) with median values of 0.829 and 0.779 for CF and SF, respectively.
Figure 7
Figure 7
Across all participants and sessions EPR target responses for the different number of symbols (from four to nine).
Figure 8
Figure 8
Across all participants and sessions distribution of accuracy rates for each number of symbols. No significant differences are found between the median of distributions (p=0.628, Kruskal–Wallis test).
Figure 9
Figure 9
Across all participants and sessions distribution of accuracy rates obtained for (a) each participant in all sessions, significant differences are verified (p<0.05, Kruskal–Wallis test), and (b) each session in all participants, significant differences are verified (p<0.05, Kruskal–Wallis test). These results are for all number of stimulus.

Similar articles

Cited by

References

    1. Vidal J.J. Toward Direct Brain-Computer Communication. Annu. Rev. Biophys. Bioeng. 1973;2:157–180. doi: 10.1146/annurev.bb.02.060173.001105. - DOI - PubMed
    1. Van Dokkum L., Ward T., Laffont I. Brain Computer Interfaces for neurorehabilitation–its current status as a rehabilitation strategy post-stroke. Ann. Phys. Rehabil. Med. 2015;58:3–8. doi: 10.1016/j.rehab.2014.09.016. - DOI - PubMed
    1. Soekadar S., Birbaumer N., Cohen L. Brain–Computer Interfaces in the Rehabilitation of Stroke and Neurotrauma. Springer; Tokyo, Japan: 2011. pp. 3–18. - DOI
    1. Bockbrader M.A., Francisco G., Lee R., Olson J., Solinsky R., Boninger M.L. Brain Computer Interfaces in Rehabilitation Medicine. PM&R. 2018;10:S233–S243. doi: 10.1016/j.pmrj.2018.05.028. - DOI - PubMed
    1. Karácsony T., Hansen J.P., Iversen H.K., Puthusserypady S. Brain Computer Interface for Neuro-Rehabilitation with Deep Learning Classification and Virtual Reality Feedback; Proceedings of the 10th Augmented Human International Conference; Reims, France. 11–12 March 2019; New York, NY, USA: Association for Computing Machinery; 2019. - DOI

LinkOut - more resources