. 2020 Dec 18;10(1):22299.
doi: 10.1038/s41598-020-79098-0.

Cortical bone adaptation to a moderate level of mechanical loading in male Sost deficient mice

Affiliations

Cortical bone adaptation to a moderate level of mechanical loading in male Sost deficient mice

Haisheng Yang et al. Sci Rep. .

Abstract

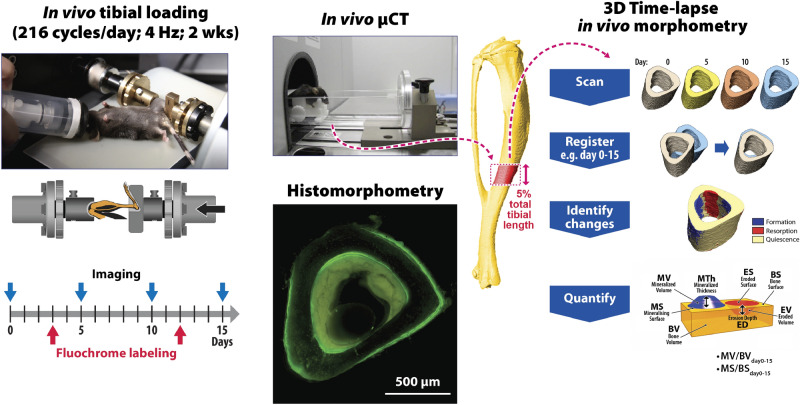
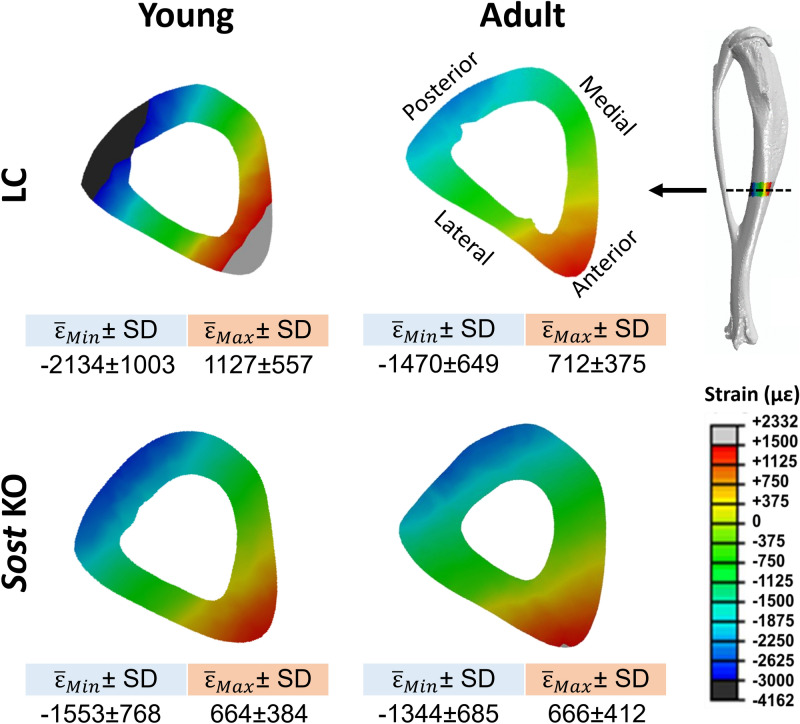
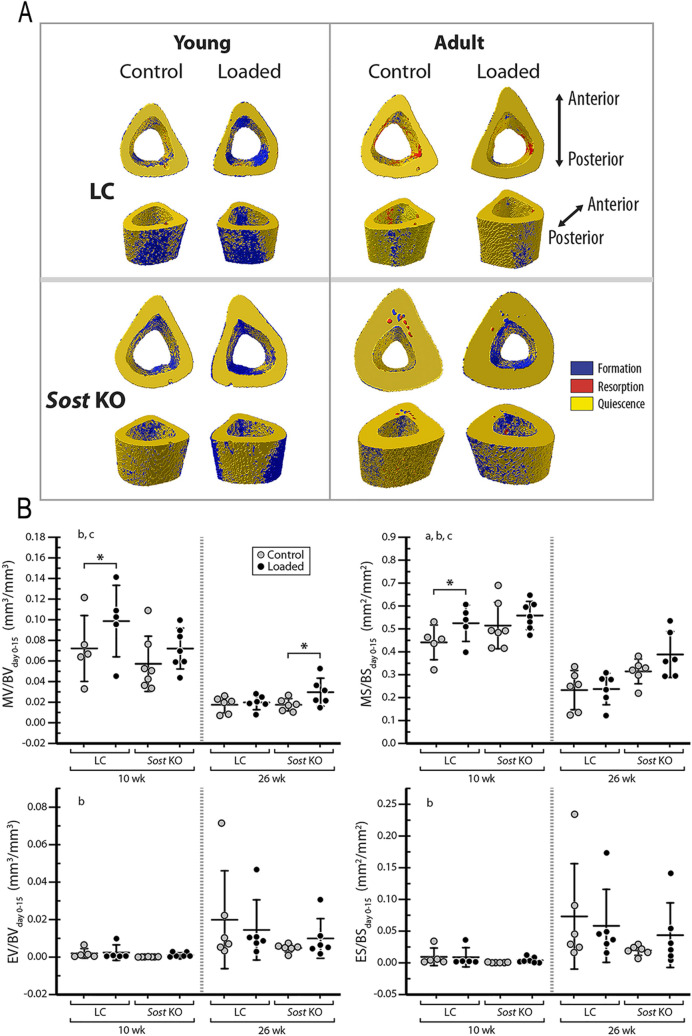
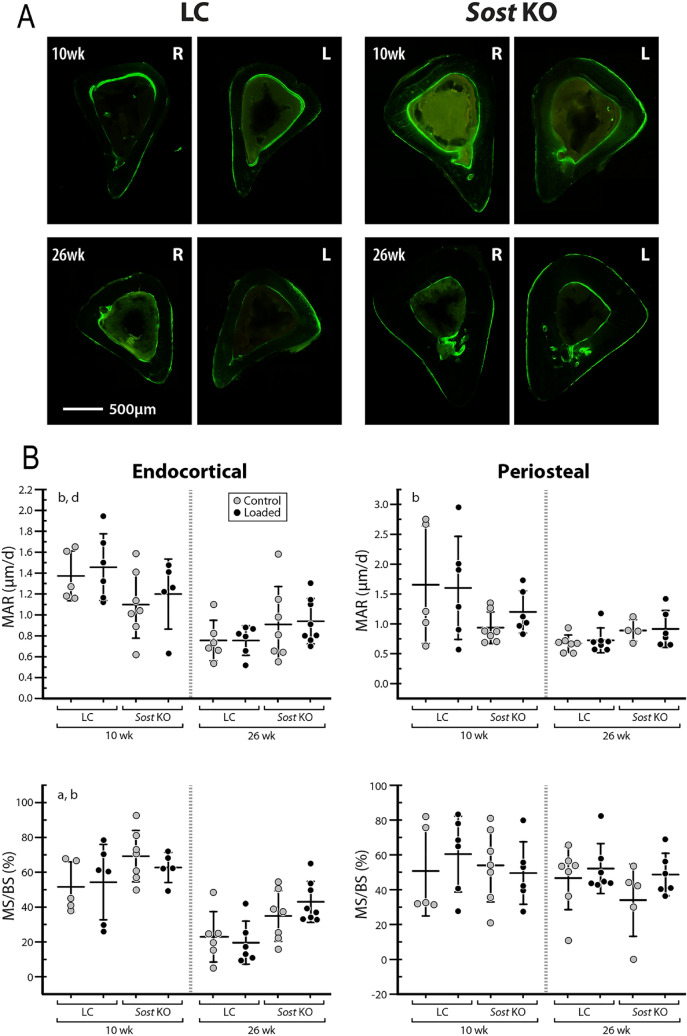
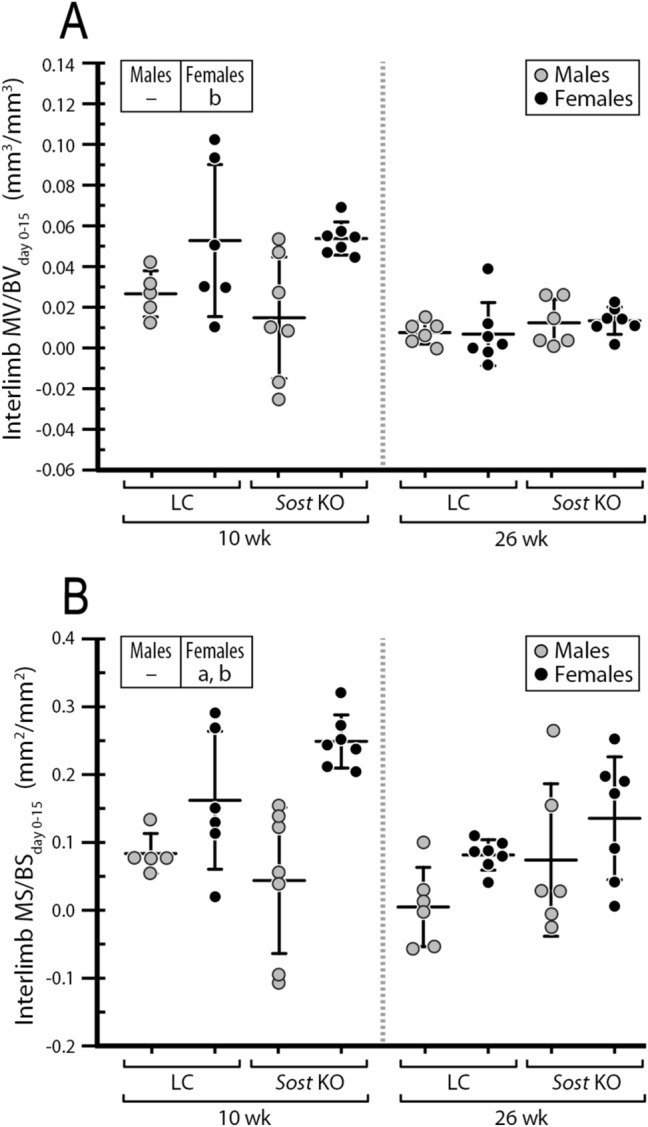
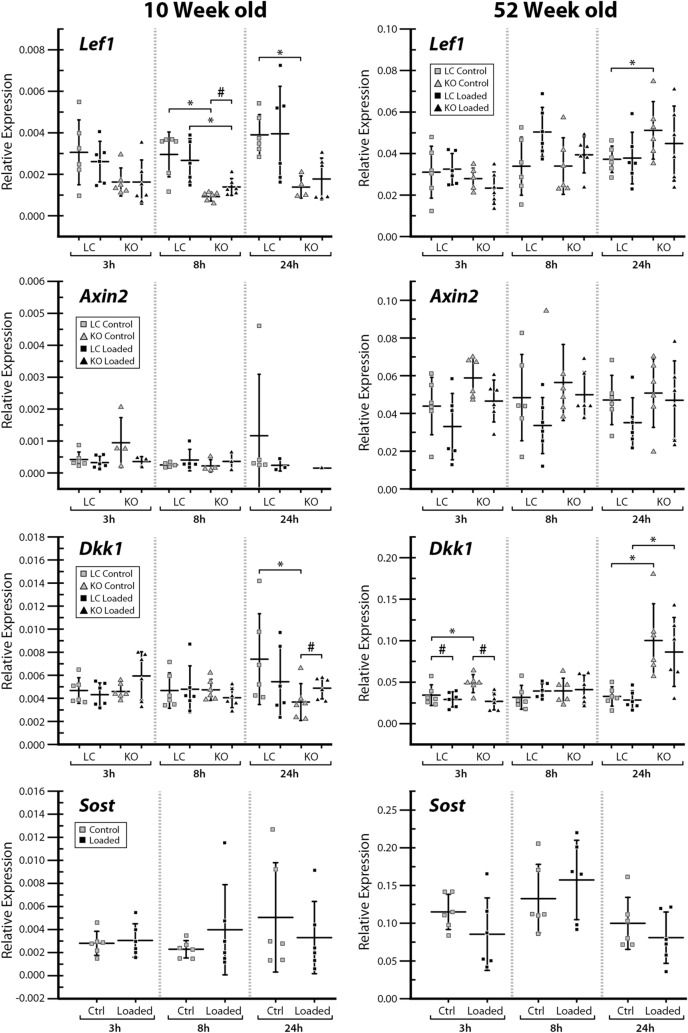
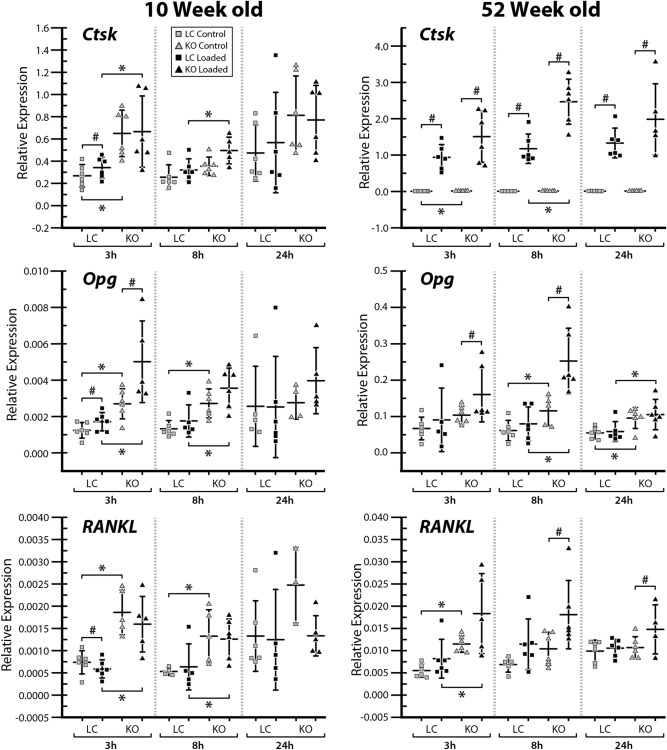
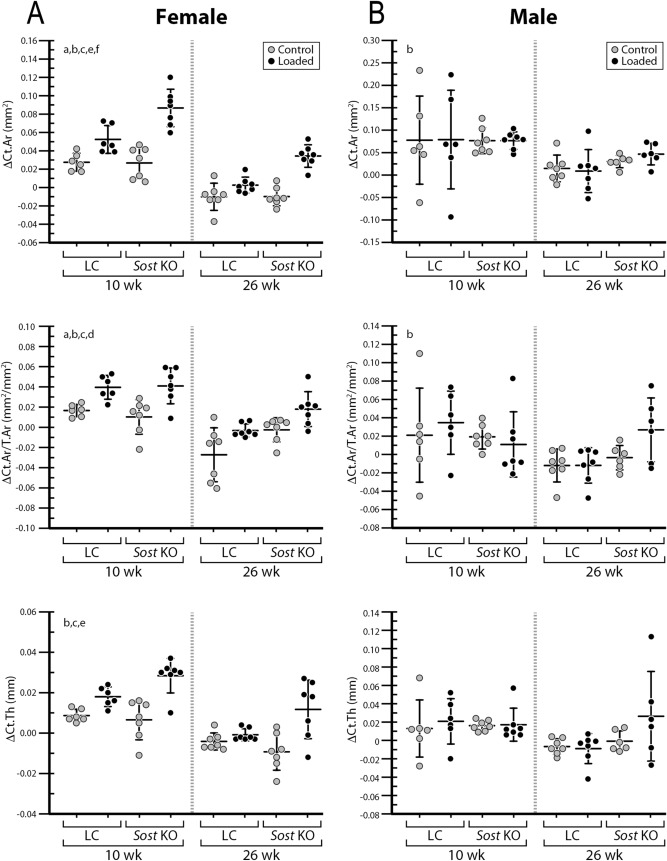
Loss-of-function mutations in the Sost gene lead to high bone mass phenotypes. Pharmacological inhibition of Sost/sclerostin provides a new drug strategy for treating osteoporosis. Questions remain as to how physical activity may affect bone mass under sclerostin inhibition and if that effect differs between males and females. We previously observed in female Sost knockout (KO) mice an enhanced cortical bone formation response to a moderate level of applied loading (900 με at the tibial midshaft). The purpose of the present study was to examine cortical bone adaptation to the same strain level applied to male Sost KO mice. Strain-matched in vivo compressive loading was applied to the tibiae of 10-, 26- and 52-week-old male Sost KO and littermate control (LC) mice. The effect of tibial loading on bone (re)modeling was measured by microCT, 3D time-lapse in vivo morphometry, 2D histomorphometry and gene expression analyses. As expected, Sost deficiency led to high cortical bone mass in 10- and 26-week-old male mice as a result of increased bone formation. However, the enhanced bone formation associated with Sost deficiency did not appear to diminish with skeletal maturation. An increase in bone resorption was observed with skeletal maturation in male LC and Sost KO mice. Two weeks of in vivo loading (900 με at the tibial midshaft) induced only a mild anabolic response in 10- and 26-week-old male mice, independent of Sost deficiency. A decrease in the Wnt inhibitor Dkk1 expression was observed 3 h after loading in 52-week-old Sost KO and LC mice, and an increase in Lef1 expression was observed 8 h after loading in 10-week-old Sost KO mice. The current results suggest that long-term inhibition of sclerostin in male mice does not influence the adaptive response of cortical bone to moderate levels of loading. In contrast with our previous strain-matched study in females showing enhanced bone responses with Sost ablation, these results in males indicate that the influence of Sost deficiency on the cortical bone formation response to a moderate level of loading differs between males and females. Clinical studies examining antibodies to inhibit sclerostin may need to consider that the efficacy of additional physical activity regimens may be sex dependent.


Conflict of interest statement

The authors declare no competing interests.

Figures

Figure 1
Figure 1
Schematic illustration of the experimental in vivo loading setup, including timeline for in vivo microCT imaging (day 0, 5, 10, 15), fluorochrome labeling for histomorphometry and procedure for 3D time-lapse in vivo morphometry. The region of interest for microCT analysis, 3D time-lapse in vivo morphometry and conventional histomorphometry was centered at the tibial midshaft.
Figure 2
Figure 2
In vivo load-induced strain distribution in the midshaft cortical bone of the tibiae of young (10-week-old) and adult (26-week-old) littermate control (LC) and Sost knockout (KO) male mice. Red and blue indicate tension and compression, respectively.
Figure 3
Figure 3
(A) Visualization of newly formed (blue), resorbed (red), and quiescent (yellow) bone tissues over 15 days at the midshaft of control and loaded tibiae from young (10-week-old) and adult (26-week-old) LC and Sost KO male mice measured with 3D dynamic time-lapse in vivo morphometry. (B) MV/BVday0–15 or MS/BSday0–15 indicate the amounts of newly formed bone volume or surface area between day 0 and 15 (the loading period) relative to the total bone volume or surface at day 0. EV/BVday0–15 or ES/BSday0–15 indicate the amounts of resorbed bone volume or surface area between day 0 and 15 relative to the total bone volume or surface at day 0. ANOVA: indicates an effect of (a) genotype, (b) age, (c) loading, (d) genotype and age, (e) genotype and loading, (f) age & loading. *p < 0.05 by paired t-test. Sample size: 10-week-old LC (n = 5), 10-week-old Sost KO (n = 7), 26-week-old LC (n = 6), 26-week-old Sost KO (n = 6).
Figure 4
Figure 4
Cortical histomorphometry: (A) cross-sectional images showing fluorochrome labeling of the midshaft cortical bone at day 3 and 12; (B) mineral apposition rate (MAR) and mineralizing surface normalized to bone surface (MS/BS) are shown for both the endocortical and periosteal surfaces. MAR is the distance between the labels divided by time between labels. MS/BS indicates the extent of bone surface actively mineralizing. ANOVA: indicates an effect of (a) genotype, (b) age, (c) loading, (d) genotype & age, (e) genotype & loading, (f) age & loading. Sample size: 10-week-old LC (n = 5–6), 10-week-old Sost KO (n = 5–7), 26-week-old LC (n = 6–7), 26-week-old Sost KO (n = 4–8).
Figure 5
Figure 5
Time-lapse in vivo morphometry measured newly formed bone between day 0 and day 15, including the total mineralizing volume (MV) and surface area (MS) normalized to the total bone volume (BV) or bone surface (BS) at day 0. Data is shown as interlimb difference (loaded-control limb) comparing male with previously published data for female mice. ANOVA: indicates an effect of (a) genotype, (b) age, (c) genotype & age, which was performed separately for each sex. Sample size: 10-week-old LC (male = 5, female = 6), 10-week-old Sost KO (male = 7, female = 7), 26-week-old LC (male = 6, female = 7), 26-week-old Sost KO (male = 6, female = 7).
Figure 6
Figure 6
Gene expression of Lef1, Axin2, Dkk1 and Sost was measured at 3, 8, and 24 h after a single loading session in the left loaded and right control tibiae of 10- and 52-week-old male Sost KO and LC mice. Gene expressions relative to reference genes are shown. *Indicates a significant difference between Sost KO compared to LC for each condition (t-test; p < 0.05). # Indicates a significant difference between loaded and control bones for each condition (paired t-test; p < 0.05). Sample size: n = 3–6.
Figure 7
Figure 7
Gene expression of Ctsk, Tnfrsf11b (= Opg) and Tnfsf11 (= RANKL) was measured at 3, 8, and 24 h after a single loading session in the left loaded and right control tibiae of 10- and 52-week-old male Sost KO and LC mice. Gene expressions relative to reference genes are shown. *Indicates a significant difference between Sost KO compared to LC for each condition (t-test; p < 0.05). # Indicates a significant difference between loaded and control bones for each condition (paired t-test; p < 0.05). Sample size: n = 3–6.
Figure 8
Figure 8
MicroCT results of cortical area (ΔCt.Ar), cortical area divided by total area (ΔCt.Ar/T.Ar) and cortical thickness (ΔCt.Th) by in vivo microCT expressed as (ΔX = Xday15 − Xday0 within the same limb). Previously published data in female 10- and 26-week-old LC and Sost KO mice are shown here for comparison with male mice. ANOVA: indicates an effect of (a) genotype, (b) age, (c) loading, (d) genotype and age, (e) genotype and loading, (f) age & loading, p < 0.05. Sample size: 10-week-old LC (male = 6, female = 6), 10-week-old Sost KO (male = 7, female = 7), 26-week-old LC (male = 7, female = 7), 26-week-old Sost KO (male = 6, female = 7).

Similar articles

Cited by

References

    1. Balemans W, et al. Identification of a 52 kb deletion downstream of the SOST gene in patients with van Buchem disease. J. Med. Genet. 2002;39:91–97. doi: 10.1136/jmg.39.2.91. - DOI - PMC - PubMed
    1. Staehling-Hampton K, et al. A 52-kb deletion in the SOST-MEOX1 intergenic region on 17q12-q21 is associated with van Buchem disease in the Dutch population. Am. J. Med. Genet. 2002;110:144–152. doi: 10.1002/ajmg.10401. - DOI - PubMed
    1. Li X, et al. Targeted deletion of the sclerostin gene in mice results in increased bone formation and bone strength. J. Bone Miner. Res. 2008;23:860–869. doi: 10.1359/jbmr.080216. - DOI - PubMed
    1. Balemans W, et al. Increased bone density in sclerosteosis is due to the deficiency of a novel secreted protein (SOST) Hum. Mol. Genet. 2001;10:537–543. doi: 10.1093/hmg/10.5.537. - DOI - PubMed
    1. Loots GG, et al. Genomic deletion of a long-range bone enhancer misregulates sclerostin in Van Buchem disease. Genome Res. 2005;15:928–935. doi: 10.1101/gr.3437105. - DOI - PMC - PubMed

Publication types

Substances

Supplementary concepts