. 2020 Dec 18;10(1):22325.
doi: 10.1038/s41598-020-79266-2.

In-situ monitoring for liquid metal jetting using a millimeter-wave impedance diagnostic

Affiliations

In-situ monitoring for liquid metal jetting using a millimeter-wave impedance diagnostic

Tammy Chang et al. Sci Rep. .

Abstract

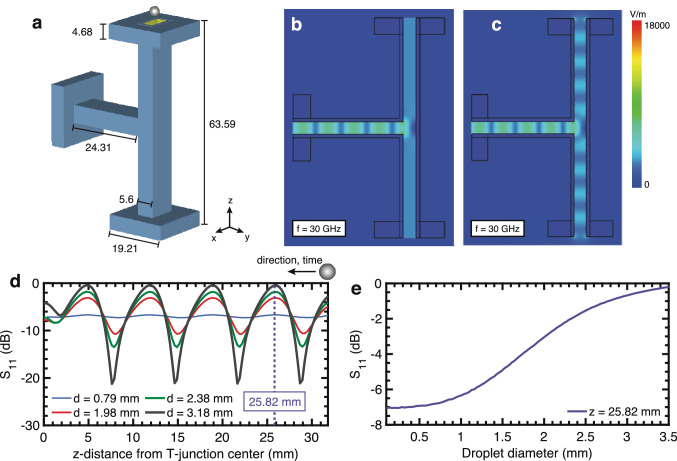
This article presents a millimeter-wave diagnostic for the in-situ monitoring of liquid metal jetting additive manufacturing systems. The diagnostic leverages a T-junction waveguide device to monitor impedance changes due to jetted metal droplets in real time. An analytical formulation for the time-domain T-junction operation is presented and supported with a quasi-static full-wave electromagnetic simulation model. The approach is evaluated experimentally with metallic spheres of known diameters ranging from 0.79 to 3.18 mm. It is then demonstrated in a custom drop-on-demand liquid metal jetting system where effective droplet diameters ranging from 0.8 to 1.6 mm are detected. Experimental results demonstrate that this approach can provide information about droplet size, timing, and motion by monitoring a single parameter, the reflection coefficient amplitude at the input port. These results show the promise of the impedance diagnostic as a reliable in-situ characterization method for metal droplets in an advanced manufacturing system.


Conflict of interest statement

The authors declare no competing interests.

Figures

Figure 1
Figure 1
Open-ended T-junction as an impedance diagnostic for droplets in motion. (a) Implementation of an open-ended T-junction as an impedance diagnostic for liquid metal jetting. (b) The T-junction as a power divider, where port 1 is the input port and ports 2 and 3 are the output ports and are impedance matched. (c) Transmission line model of a lossless T-junction. The stored energy associated with the discontinuity of the junction is accounted for with susceptance B. (d) Analytical results for the return loss S11 when ports are terminated with a matched impedance and open air. (e) Analytical variation in S11 at f = 30 GHz [marked in (d)] for different droplet impedances. Note that symmetry is inherent in the T-junction and therefore only half of the T-junction length is shown.
Figure 2
Figure 2
Open-ended T-junction simulation. (a) WR-28 waveguide T-junction model in simulation. Dimensions are in mm. (b) Time-averaged electric fields when port 2 and 3 are terminated with matched impedances (c) Time-averaged electric fields for open air terminations at port 2 and 3. (d) Return loss S11 at port 1 for droplets of four diameters (0.79, 1.98, 2.38, 3.18 mm) as the droplet moves from the edge of the T-junction arm to the center. Note that symmetry is inherent in the T-junction and therefore only half of the T-junction length is shown. (e) S11 when an aluminum sphere is positioned at z = 25.82 mm [marked in (d)]. The diameter is varied in 30 μm steps from 0.1 to 3.5 mm.
Figure 3
Figure 3
Solid metal sphere experiments. Time-domain S11 measurement for aluminum spheres with diameters: (a) 0.79 mm, (b) 1.98 mm, (c) 2.38 mm, (d) 3.18 mm. The center lobe that marks the center of the T-junction is denoted by a green arrow. (e) Peak S11 value (averaged over 8 peaks) for each sphere drop, as a function of sphere diameter. (f) Measured waveform for sphere with 3.18 mm diameter. Extrema are marked in red and can be associated with known positions in the T-junction. (g) The time stamps of extrema in (f) are plotted with position. A second-order polynomial curve fit is applied.
Figure 4
Figure 4
Liquid metal experiments. (a) Experimental setup in liquid metal jetting drop-on-demand system. (b) Time-domain S11 measurement on tin droplets for a 200 um nozzle with 10 Hz pressure pulses. Peak values are denoted with colored markers. Images of jetted droplets are shown above the corresponding S11 signal perturbation. (c) Peak S11 value (averaged over 8 peaks) for each droplet plotted as a function of effective droplet diameter. (d) Droplet position (height, z-axis) over time for each droplet. Colored markers correspond to known peak locations and curves (blue) correspond to a second-order polynomial curve fit. The constants yielded by the curve fit are provided in Table 1.

References

    1. Maiti A, et al. 3D printed cellular solid outperforms traditional stochastic foam in long-term mechanical response. Sci. Rep. 2016;6:24871. doi: 10.1038/srep24871. - DOI - PMC - PubMed
    1. Yao B, et al. 3D-printed structure boosts the kinetics and intrinsic capacitance of pseudocapacitive graphene aerogels. Adv. Mater. 2020;32:1906652. doi: 10.1002/adma.201906652. - DOI - PubMed
    1. Destino JF, et al. 3D printed optical quality silica and silica-titania glasses from sol-gel feedstocks. Adv. Mater. Technol. 2018;3:1700323. doi: 10.1002/admt.201700323. - DOI
    1. Jackson JA, et al. Field responsive mechanical metamaterials. Sci. Adv. 2018;4:eaau6419. doi: 10.1126/sciadv.aau6419. - DOI - PMC - PubMed
    1. Murr LE. a metallographic review of 3D printing/additive manufacturing of metal and alloy products and components. Metall. Microstruct. Anal. 2018;7:103–132. doi: 10.1007/s13632-018-0433-6. - DOI