Review
. 2021 May;18(5):349-367.
doi: 10.1038/s41569-020-00478-0. Epub 2020 Dec 18.

Cardiac optogenetics: a decade of enlightenment

Affiliations
Review

Cardiac optogenetics: a decade of enlightenment

Emilia Entcheva et al. Nat Rev Cardiol. 2021 May.

Abstract

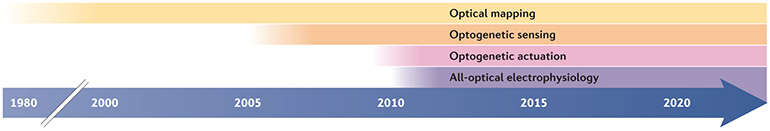
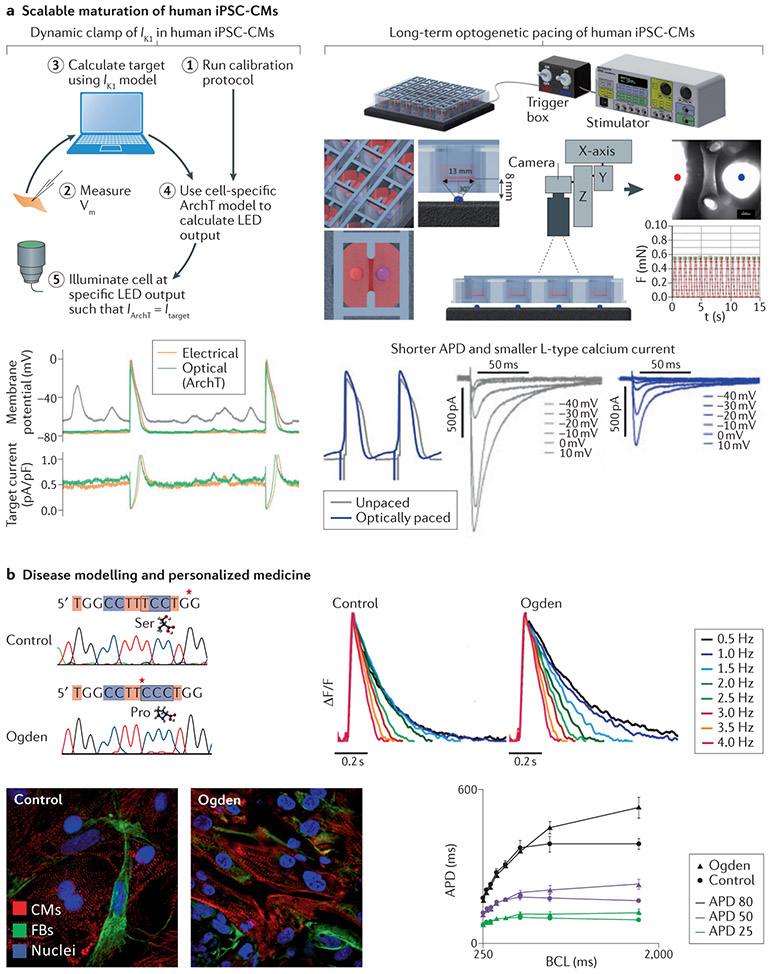
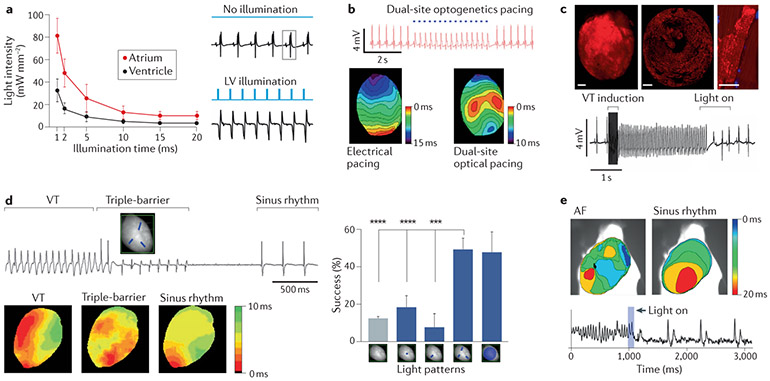
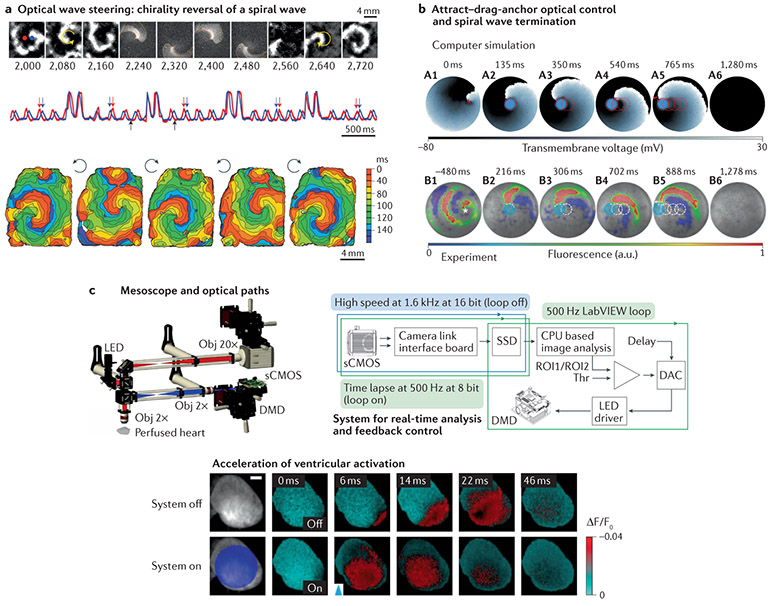
The electromechanical function of the heart involves complex, coordinated activity over time and space. Life-threatening cardiac arrhythmias arise from asynchrony in these space-time events; therefore, therapies for prevention and treatment require fundamental understanding and the ability to visualize, perturb and control cardiac activity. Optogenetics combines optical and molecular biology (genetic) approaches for light-enabled sensing and actuation of electrical activity with unprecedented spatiotemporal resolution and parallelism. The year 2020 marks a decade of developments in cardiac optogenetics since this technology was adopted from neuroscience and applied to the heart. In this Review, we appraise a decade of advances that define near-term (immediate) translation based on all-optical electrophysiology, including high-throughput screening, cardiotoxicity testing and personalized medicine assays, and long-term (aspirational) prospects for clinical translation of cardiac optogenetics, including new optical therapies for rhythm control. The main translational opportunities and challenges for optogenetics to be fully embraced in cardiology are also discussed.


Figures

Fig. 1 ∣
Fig. 1 ∣. Timeline of optical tools applied to the heart.
Beginning with optical mapping over 40 years ago, optical tools have been used extensively for cardiac research. In the past decade, optogenetics enabled the combination of optical sensing and optical actuation for the development of all-optical cardiac electrophysiology systems. See Table 1 for specific applications of cardiac optogenetics, including translational aspects, with the relevant publications since 2010, including Review articles.
Fig. 2 ∣
Fig. 2 ∣. Advantages of all-optical electrophysiology and the optogenetic toolkit.
a ∣ Advantages of optogenetics and all-optical electrophysiology in enabling cardiac applications through spectral compatibility of optogenetic actuators and optogenetic sensors. Unique features include inherent parallelism, scalability, capacity for long-term monitoring of function, bidirectional multimodal imaging and perturbation of cardiac function, and closed-loop feedback control of electrical events and wave parameters, as well as cell-specific and organelle-specific targeting with high spatiotemporal resolution. Taken together, optogenetic technology is superior to electrical and chemical methods for actuation and sensing. b ∣ All-optical electrophysiology draws upon an extensive toolkit of optogenetic actuators of voltage, including depolarizing (excitatory) opsins (such as channelrhodopsin 2 (ChR2), CheRiff, Crimson and ReaChR) and hyperpolarizing (inhibitory) opsins (such as BLINK-1, PAC-K, GtACR1, archaerhodopsin T (ArchT), halorhodopsin (Halo) and Jaws) that are activatable across a wide band of wavelengths. Relevant optogenetic sensors include genetically encoded voltage indicators (GEVIs), such as VSFP2.3, ArcLight, ASAP, Voltron525, FlicR1, Quasars, Archon1 and near-infrared (NIR)-Butterfly, and genetically encoded calcium indicators (GECIs), such as GCaMPs, R-CaMPs, R-GECOs and NIR-GECO, with peak excitation wavelengths ranging from 450 nm to 660 nm. These spectral properties and biophysical performance have enabled various combinations of actuators and sensors to be deployed in cardiac research.
Fig. 3 ∣
Fig. 3 ∣. Near-term translation for high-throughput drug screening and cardiotoxicity testing.
a ∣ High-throughput drug screening. Optogenetic voltage sensors (QuasAr1) and bidirectional optogenetic actuation (depolarization via channelrhodopsin (ChR2) and hyperpolarization via archaerhodopsin T (ArchT)) can be used in an all-optical electrophysiology setup to reveal drug effects on voltage-gated ion channels in heterologous systems. Sodium channel hNav1.5 (hNav1.5) and responses to lidocaine are shown. Light-induced electrophysiology (LiEp) and classic voltage clamp (VC) both capture functional cellular responses to lidocaine for light-induced voltages within the range of operation (before rectification) of the optogenetic actuators, b ∣ High-throughput cardiotoxicity testing. CheRiff (an optogenetic actuator) and CaViar (an optogenetic construct for dual-voltage and calcium imaging) were expressed in human induced pluripotent stem cell-derived cardiomyocytes (iPSC-CMs), and cell populations (expressing the actuator or expressing the sensor) were intermixed in a connected network (top-left panels). This approach was applied to perform dose–response testing with several cardiotoxic drugs. The top-right panel shows the voltage responses to cisapride for spontaneous activity and in response to 1 Hz optical pacing; early afterdepolarizations are induced at 1 μmol/l. Cisapride is a gastrokinetic drug that was removed from the US market in 2000 because of cardiotoxicity. The bottom-left panel shows OptoDyCE,, an automated, high-throughput, all-optical electrophysiology setup for optogenetic actuation and optical–optogenetic sensing of voltage and calcium with the use of spectrally compatible proteins and/or small-molecule probes. The bottom-right panel shows the responses of human iPSC-CMs in 384-format plates to 0.1% dimethyl sulfoxide (DMSO) versus 10 μmol/l azimilide; the spontaneous and optically-paced activity is shown (the blue dots are the optical pulses). Azimilide prolongs the action potential duration and can induce small, localized, spontaneous calcium-release events, seen in the calcium records (marked by *). Although azimilide is a class III antiarrhythmic drug, azimilide can be cardiotoxic and cause torsade de pointes. aLED, light-emitting diode used for actuation; sLED, light-emitting diode used for excitation in sensing; DM, dichroic mirror; F, optical filter; L, lens, eGFP, enhanced green fluorescent protein. Part a modified with permission from REF.. Part b top panels modified with permission from REF.. Part b bottom panels modified with permission from REF..
Fig. 4 ∣
Fig. 4 ∣. Near-term translation to enhance stem-cell technology and personalized medicine.
a ∣ Scalable maturation of human induced pluripotent stem cell-derived cardiomyocytes (iPSC-CMs). Left: an ‘optical dynamic clamp’ for computer-controlled, real-time manipulation of live cardiomyocytes (CMs) was used to ‘inject’ the desired ion current by light-emitting diode (LED) light when an optogenetic inhibitor ArchT was expressed in human iPSC-CMs. The dynamically clamped current was the inward-rectifier potassium current (Ik1) and its ‘optical injection’ yielded more hyperpolarized resting potential, consistent with mature CMs. The bottom-left panels show records without the dynamic clamp (depolarized resting membrane potential (grey) and wandering baseline), electrical dynamic clamp (orange) and optical dynamic clamp (green). This more mature CM ‘phenotype’ was used for studying drug responses. Right: the figure shows a system for long-term optogenetic stimulation of engineered human tissue constructs and tracking the induced force responses. The system was applied over 3 weeks and the optically paced constructs (3-Hz, 30-ms pulses at 0.3 mW/mm2, 15 s on and 15 s off) showed electromechanical remodelling with faster contractions, shorter action potential durations (APDs) and lower L-type calcium current. In this study, the optically tachypaced engineered human tissues were more susceptible to arrhythmias than unpaced engineered human tissues, but the arrhythmias could be prevented by pharmacological means. b ∣ Disease modelling and personalized medicine. The example of disease modelling shown is of a rare X-linked genetic disorder, Ogden syndrome, with a point S37P mutation in NAA10 (left panel), which encodes the catalytic subunit of N-alpha-acetyltransferase 10 (involved in N-terminal acetylation of proteins). Cells from patients with Odgen syndrome and cells from age-matched and sex-matched healthy individuals (control) were transformed into human iPSCs and then differentiated into CMs (the bottom-left panels show immunofluorescence images with labelling for CMs, fibroblast (FBs) and nuclei). After 3 months, the iPSC-CMs were transduced with ChR2 adenovirus and their function was characterized with all-optical electrophysiology. The patient-derived cells showed APD prolongation selectively at lower pacing rates or longer basic cycle lengths (BCLs) compared with control cells, consistent with clinical findings that patients with Ogden syndrome have cardiac problems and arrhythmias, including bradycardia and torsades de pointes, and eventually die young. APD25, APD50 and APD80 are APDs at 25%, 50% and 80% repolarization. Part a left panels modified with permission from REF.. Part a right panels modified with permission from REF.. Panel b modified with permission from REF..
Fig. 5 ∣
Fig. 5 ∣. Long-term translation of cardiac optogenetics for rhythm control.
The figure shows proof-of-concept results from multiple studies. a ∣ Photostimulation intensity and duration required for in vivo pacing of transgenic channelrhodopsin 2 (ChR2) mice hearts. Electrocardiogram (ECG) signal before and after pulsed photostimulation indicating 1:1 capture during optical pacing of the left ventricle (LV). b ∣ ECG indicating dual-site, optical pacing of the ventricles in a perfused rat heart at locations of myocardial injections of adeno-associated virus (AAV)-CAG-ChR2-green fluorescence protein (GFP), and activation sequences generated by electrical pacing at the apex (left panel) and by dual-site optical pacing of the ventricles (right panel). c ∣ Optogenetic pacing and defibrillation in hearts after in vivo gene transfer. Stable expression of ChR2 within a mouse heart 16 months after systemic injection of AAV9-ChR2-mCherry; epicardial surface (top-left panel), left ventricular cross-section (top-middle panel) and ventricular cardiomyocyte (top-right panel). The bottom panel shows an ECG with termination of ventricular tachycardia (VT) by epicardial illumination of the ventricles. d ∣ ECG showing cardioversion after VT onset using a triple-barrier pattern (top-left panel). Activation sequences relative to the ECG; VT activation (bottom-left panel), photostimulation (bottom-middle panel) and restored sinus rhythm (bottom-right panel). The right panel shows the percentage of spontaneous cardioversion of VTs (grey bar) and VTs interrupted with each of the four light patterns shown on the x-axis (blue bars); P values (***P < 0.001, ****P < 0.0001) determined by one-way ANOVA. e ∣ The top panels show activation maps with re-entrant conduction during atrial fibrillation (AF) (left panel) and subsequent restoration of sinus rhythm after optical cardioversion (right panel). The bottom panel is the optical voltage signal showing chaotic AF that converts to sinus rhythm after exposing the right atrium to a 100-ms light pulse. Panel a modified with permission from REF.. Panel b modified with permission from REF.. Panel c modified with permission from REF.. Panel d modified with permission from REF.. Panel e modified with permission from REF..
Fig. 6 ∣
Fig. 6 ∣. Long-term translation of cardiac optogenetics for wave control and feedback control.
The figure shows proof-of-concept results from multiple studies. a ∣ The top images show an anticlockwise spiral wave, an optically applied, computer-generated clockwise spiral wave and the persisting spiral wave after chirality reversal. The activity signals from the red and blue pixels indicated in the top panel show four light-controlled chirality reversals. Computer-generated, blue-light spirals were imposed at random phases for just over a cycle, as seen in the four higher-intensity transients (middle panel). Black arrows indicate the time period shown in the top panel. Red and blue arrows indicate the switch in order of excitation at the chosen locations due to chirality reversal. The bottom panel shows activation maps for the initial spiral wave and the four resultant spirals after each of the chirality reversals. b ∣ Attract–drag–anchor control of a spiral wave core towards termination. The top panel shows the successful termination of a spiral wave in silico by capturing the core by using circular depolarizing light pulses and ‘dragging’ the core to the left boundary in a stepwise fashion. The bottom panel shows the successful termination of a spiral wave in vitro in a manner similar to that shown above. For each light spot, the current location of the applied light is indicated with a filled blue circle. The movement of the tip of the spiral wave, as it is anchored to the location of the light spot at previous time points, is indicated in each frame as a dashed red (in silico) or white (in vitro) line, c ∣ The top-left panel shows a fluorescence mesoscope used for optical mapping and photostimulation. Voltage-sensitive dye fluorescence was imaged using a scientific complementary metal oxide semiconductor (sCMOS) camera, and a digital micromirror device provided patterned light for photostimulation. The top-right panel shows the hardware used for real-time analysis of fluorescence and feedback control. The bottom panel shows optical membrane potential images acquired before and after photostimulation (blue arrowhead), revealing acceleration of ventricular activation after large-field illumination of the epicardium of a perfused mouse heart. CPU, central processing unit; DAC, digital-to-analogue conversion; DMD, digital micromirror device; LED, light-emitting diode; Obj, objective; ROI, region of interest; SSD, solid state drive; Thr, threshold. Panel a modified with permission from REF.. Panel b modified with permission from REF.. Panel c modified with permission from REF..
Fig. 7 ∣
Fig. 7 ∣. Long-term translation of cardiac optogenetics for cell-specific control.
The figure shows proof-of-concept results from multiple studies, a ∣ The top-left panel shows an atrioventricular node section from a CX3CR1+ channelrhodopsin 2(ChR2) mouse, showing endogenous ChR2–yellow fluorescent protein (YFP) signal (green) expressed in macrophages and additional staining for HCN4+ cardiomyocytes (red) and nuclei (blue). Bar graphs of control and CX3CR1+ChR2 hearts showing the number of conducted atrial stimuli between two non-conducted impulses of a Wenckebach period during light-off and light-on cycles (top-right panel). The bottom panel is an electrocardiogram (ECG) from a CX3CR1+ChR2 mouse heart, illustrating an increased number of conducted atrial stimuli during a light-on cycle. Arrows indicate failure of conduction leading to a missing QRS complex. Numbers indicate AV delay [ms]. b ∣ Evidence of selective expression of ChR2 in the conduction system of a mouse heart by the presence of ChR2-expressing bundles in the interventricular septum (IVS), as well as in the right ventricle (RV) subendocardium (top panel). ECG signal showing ectopic beats originated by epicardial photostimulation of the IVS, where light penetration through the myocardium activated Purkinje fibres (bottom panel). c ∣ Energy requirements of optogenetic pacing measured using a computer model of human ventricles. The left panel shows the response to illumination of ChR2 gene delivery sites (blue circles) in regions of dense Purkinje system arborization. The middle panel shows the response to the same illumination pattern as in the left panel, but with gene delivery specific to the Purkinje system only. The right panel shows the response to His bundle illumination for the Purkinje system-specific gene delivery with light delivered at a single strategic site, requiring approximately four times lower energy (threshold for excitation, Ee,thr) for ventricular pacing than the approach shown in the left panel. d ∣ Cell-specific expression of ChR2 within the cardiac autonomic nervous system. Choline acetyltransferase (ChAT) is an opsin expression promoter for parasympathetic neurons whereas tyrosine hydroxylase (TH) is a promoter for sympathetic neurons (top-left panel). The top-middle panel shows expression of enhanced yellow fluorescent protein (EYFP)–ChR2 (blue) in TH-expressing sympathetic neurons (red) of the left ventricle (LV) of a mouse heart. The middle-bottom panel shows the heart rate response during photostimulation of intrinsic cardiac TH-expressing neurons. The top-right panel shows the co-localization of ChAT (green) with EYFP–ChR2 (red) within the nerve bundles of the right atrium. The bottom-right panel shows the heart rate response during photostimulation of intrinsic cardiac ChAT-expressing neurons. e ∣ The top panel shows an image of the right paravertebral chain of a mouse stained with TH (red) and green fluorescent protein (GFP; green), with expression of ChR2 in the sympathetic neurons of the stellate ganglion (SG). The insets show single-plane images of the SG. Blue dashed boxes indicate the location of higher magnification images shown in the blue boxes. The bottom panel is a representative heart rate response during photostimulation of the craniomedial right SG. T2G, second thoracic ganglion. Panel a modified with permission from REF.. Panel b modified with permission from REF.. Panel c modified with permission from REF.. Part d top-middle panel modified with permission from REF.. Part d bottom panels modified with permission from REF.. Part d top-right panel modified with permission from REF.. Part e top panel modified with permission from REF..

Similar articles

Cited by

References

    1. Arrenberg AB, Stainier DY, Baier H & Huisken J Optogenetic control of cardiac function. Science 330, 971–974 (2010). - PubMed
    1. Bruegmann T et al. Optogenetic control of heart muscle in vitro and in vivo. Nat. Methods 7, 897–900 (2010). - PubMed
    1. Hofmann B et al. Light induced stimulation and delay of cardiac activity. Lab Chip 10, 2588–2596 (2010). - PubMed
    1. Jia Z et al. Stimulating cardiac muscle by light: Cardiac optogenetics by cell delivery. Circ. Arrhythm. Electrophysiol 4, 753–760 (2011). - PMC - PubMed
    1. Salama G & Morad M Merocyanine 540 as an optical probe of transmembrane electrical activity in the heart. Science 48, 485–487 (1976). - PubMed

Publication types

MeSH terms