. 2021 Jan;6(1):73-86.
doi: 10.1038/s41564-020-00841-4. Epub 2020 Dec 18.

Responses to acute infection with SARS-CoV-2 in the lungs of rhesus macaques, baboons and marmosets

Dhiraj Kumar Singh  1   2 Bindu Singh  1   2 Shashank R Ganatra  1   2 Michal Gazi  2 Journey Cole  1   2 Rajesh Thippeshappa  1   2 Kendra J Alfson  2 Elizabeth Clemmons  1   2 Olga Gonzalez  1   2 Ruby Escobedo  1   2 Tae-Hyung Lee  1   2 Ayan Chatterjee  1   2 Yenny Goez-Gazi  2 Riti Sharan  1   2 Maya Gough  1   2 Cynthia Alvarez  1   2 Alyssa Blakley  1   2 Justin Ferdin  1   2 Carmen Bartley  1   2 Hilary Staples  1   2 Laura Parodi  1   2 Jessica Callery  1   2 Amanda Mannino  1   2 Benjamin Klaffke  2 Priscilla Escareno  2 Roy N Platt 2nd  2 Vida Hodara  1   2 Julia Scordo  2 Shalini Gautam  2 Andreu G Vilanova  2 Angelica Olmo-Fontanez  2 Alyssa Schami  2 Adelekan Oyejide  3 Dharani K Ajithdoss  3 Richard Copin  3 Alina Baum  3 Christos Kyratsous  3 Xavier Alvarez  1   2 Mushtaq Ahmed  4 Bruce Rosa  4 Anna Goodroe  1   2 John Dutton  1   2 Shannan Hall-Ursone  1   2 Patrice A Frost  1   2 Andra K Voges  1   2   5 Corinna N Ross  1   2 Ken Sayers  1   2 Christopher Chen  1   2 Cory Hallam  2 Shabaana A Khader  4 Makedonka Mitreva  4 Timothy J C Anderson  2 Luis Martinez-Sobrido  2 Jean L Patterson  2 Joanne Turner  2 Jordi B Torrelles  2 Edward J Dick Jr  1   2 Kathleen Brasky  1   2 Larry S Schlesinger  1   2 Luis D Giavedoni  6   7 Ricardo Carrion Jr  8   9 Deepak Kaushal  10   11
Affiliations

Responses to acute infection with SARS-CoV-2 in the lungs of rhesus macaques, baboons and marmosets

Dhiraj Kumar Singh et al. Nat Microbiol. 2021 Jan.

Erratum in

  • Author Correction: Responses to acute infection with SARS-CoV-2 in the lungs of rhesus macaques, baboons and marmosets.
    Singh DK, Singh B, Ganatra SR, Gazi M, Cole J, Thippeshappa R, Alfson KJ, Clemmons E, Gonzalez O, Escobedo R, Lee TH, Chatterjee A, Goez-Gazi Y, Sharan R, Gough M, Alvarez C, Blakley A, Ferdin J, Bartley C, Staples H, Parodi L, Callery J, Mannino A, Klaffke B, Escareno P, Platt RN 2nd, Hodara V, Scordo J, Gautam S, Vilanova AG, Olmo-Fontanez A, Schami A, Oyejide A, Ajithdoss DK, Copin R, Baum A, Kyratsous C, Alvarez X, Ahmed M, Rosa B, Goodroe A, Dutton J, Hall-Ursone S, Frost PA, Voges AK, Ross CN, Sayers K, Chen C, Hallam C, Khader SA, Mitreva M, Anderson TJC, Martinez-Sobrido L, Patterson JL, Turner J, Torrelles JB, Dick EJ Jr, Brasky K, Schlesinger LS, Giavedoni LD, Carrion R Jr, Kaushal D. Singh DK, et al. Nat Microbiol. 2021 Mar;6(3):413. doi: 10.1038/s41564-021-00867-2. Nat Microbiol. 2021. PMID: 33462437 Free PMC article. No abstract available.

Abstract

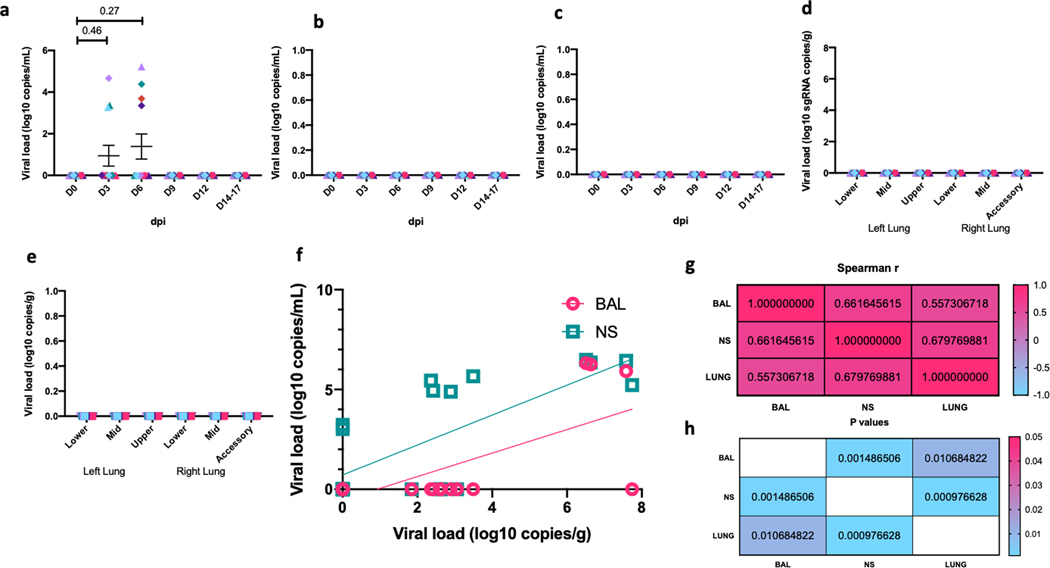
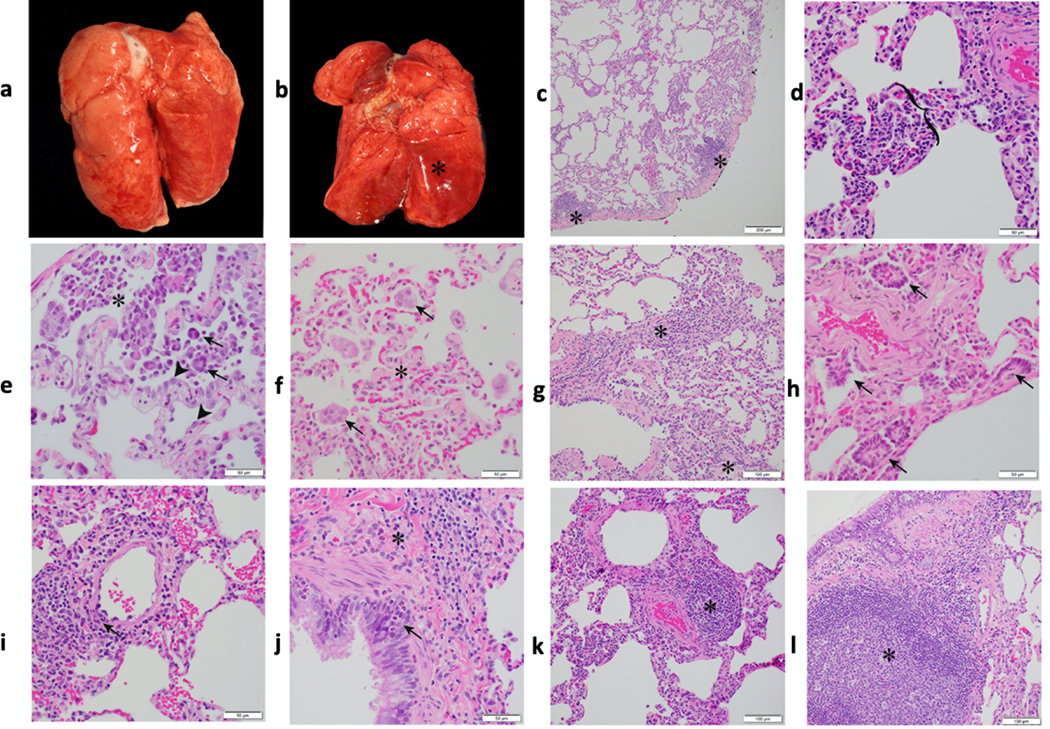
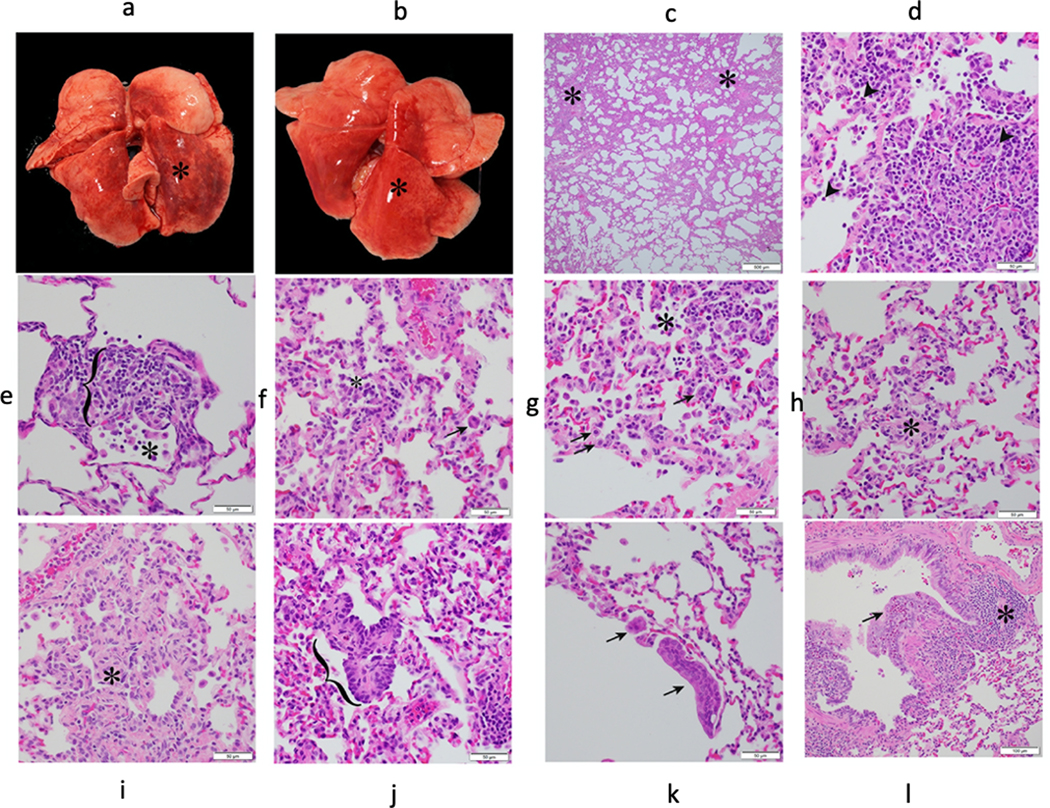
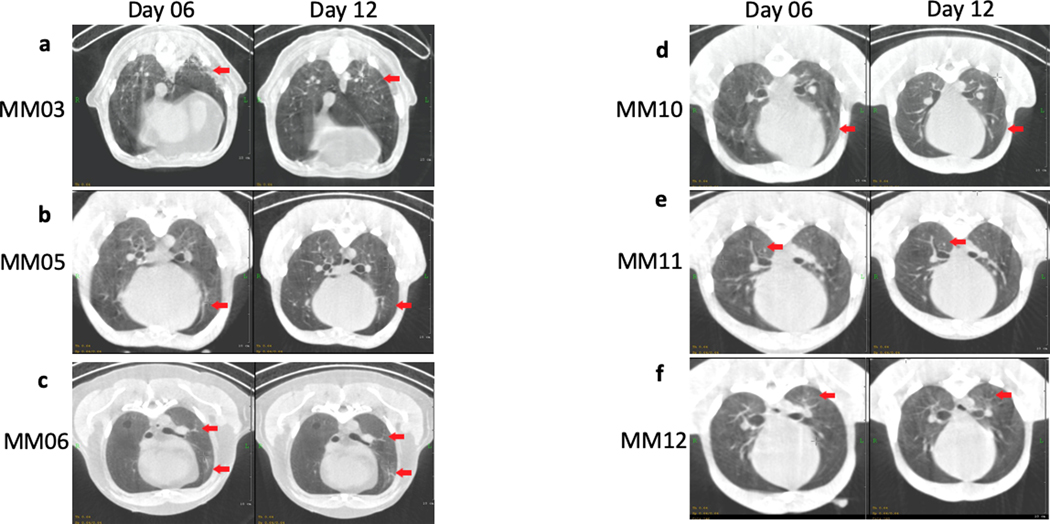
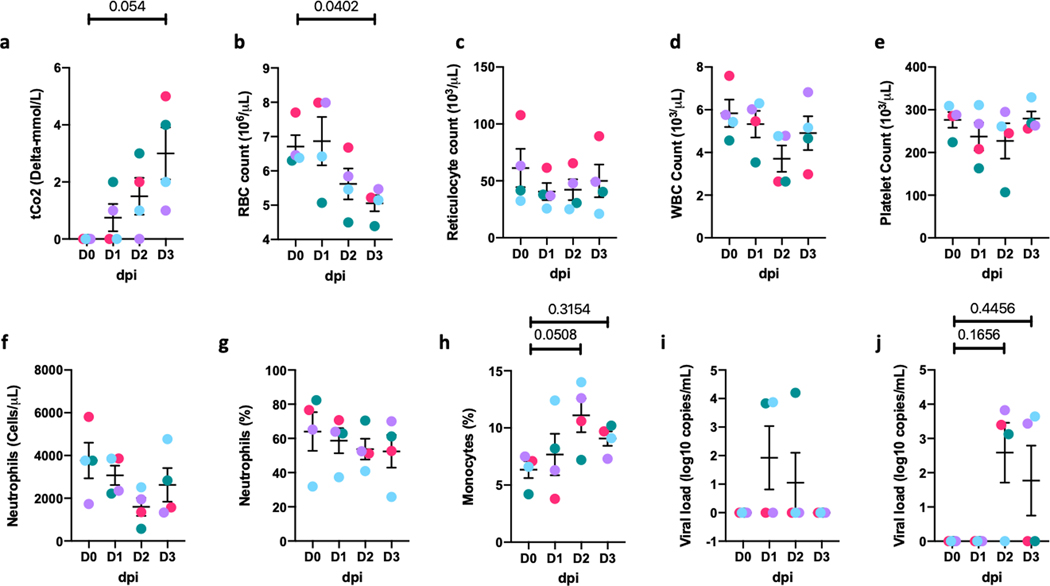
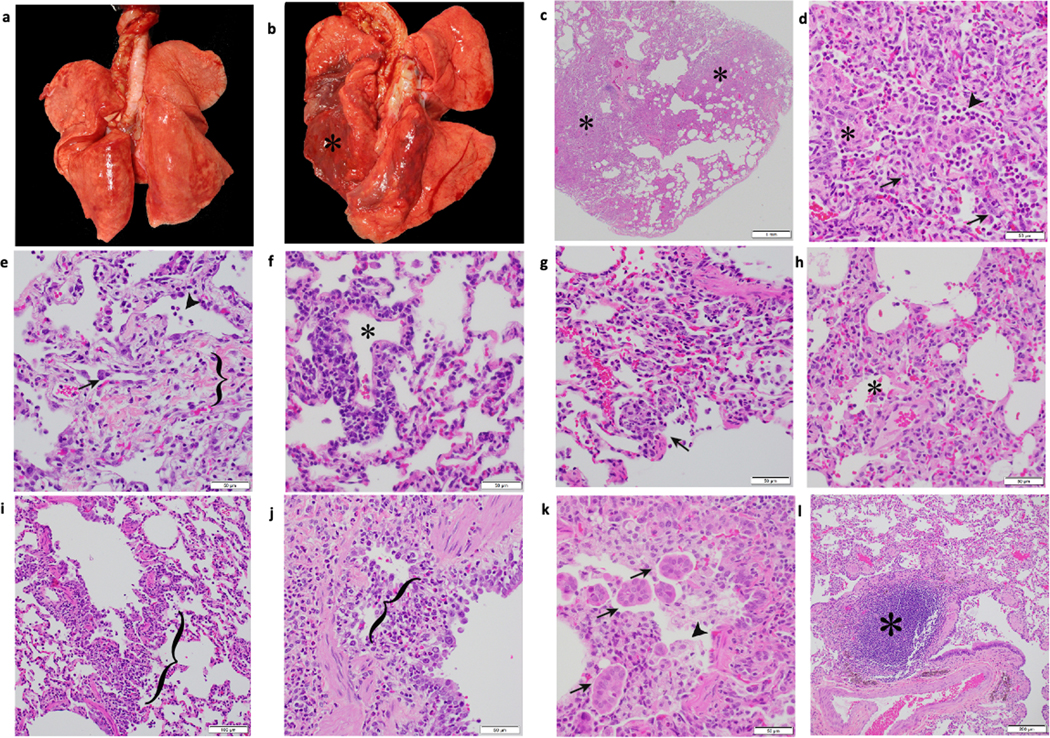
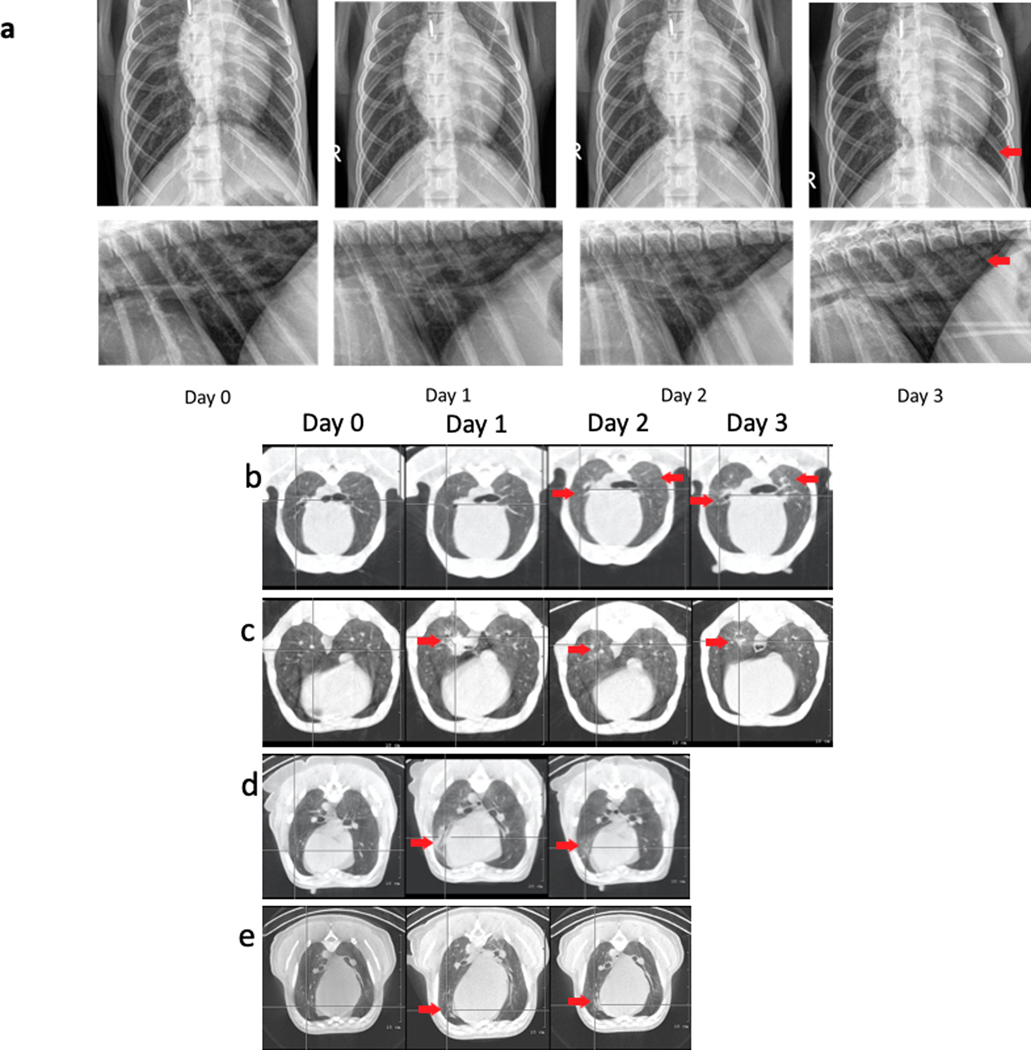
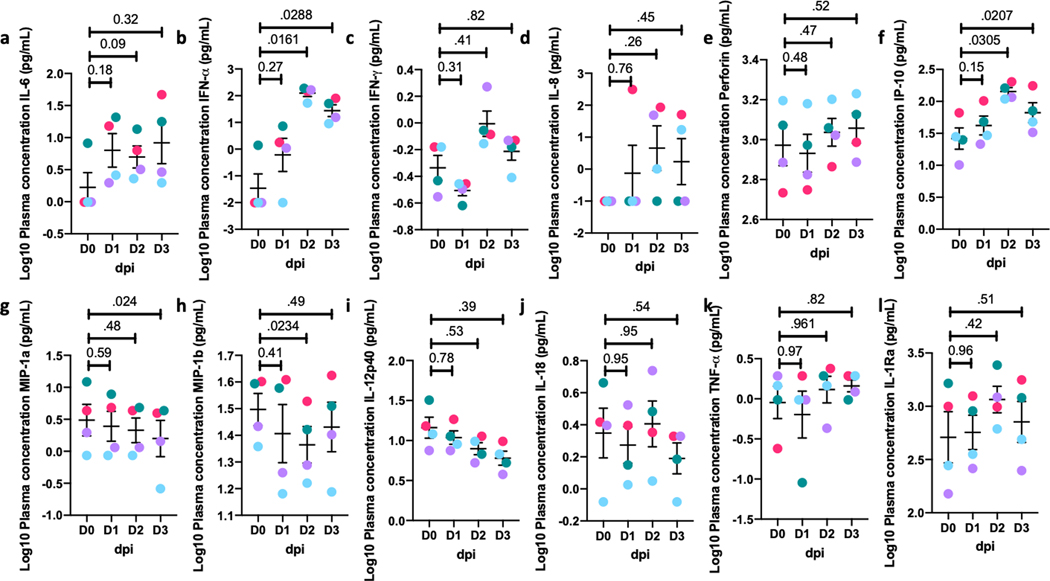
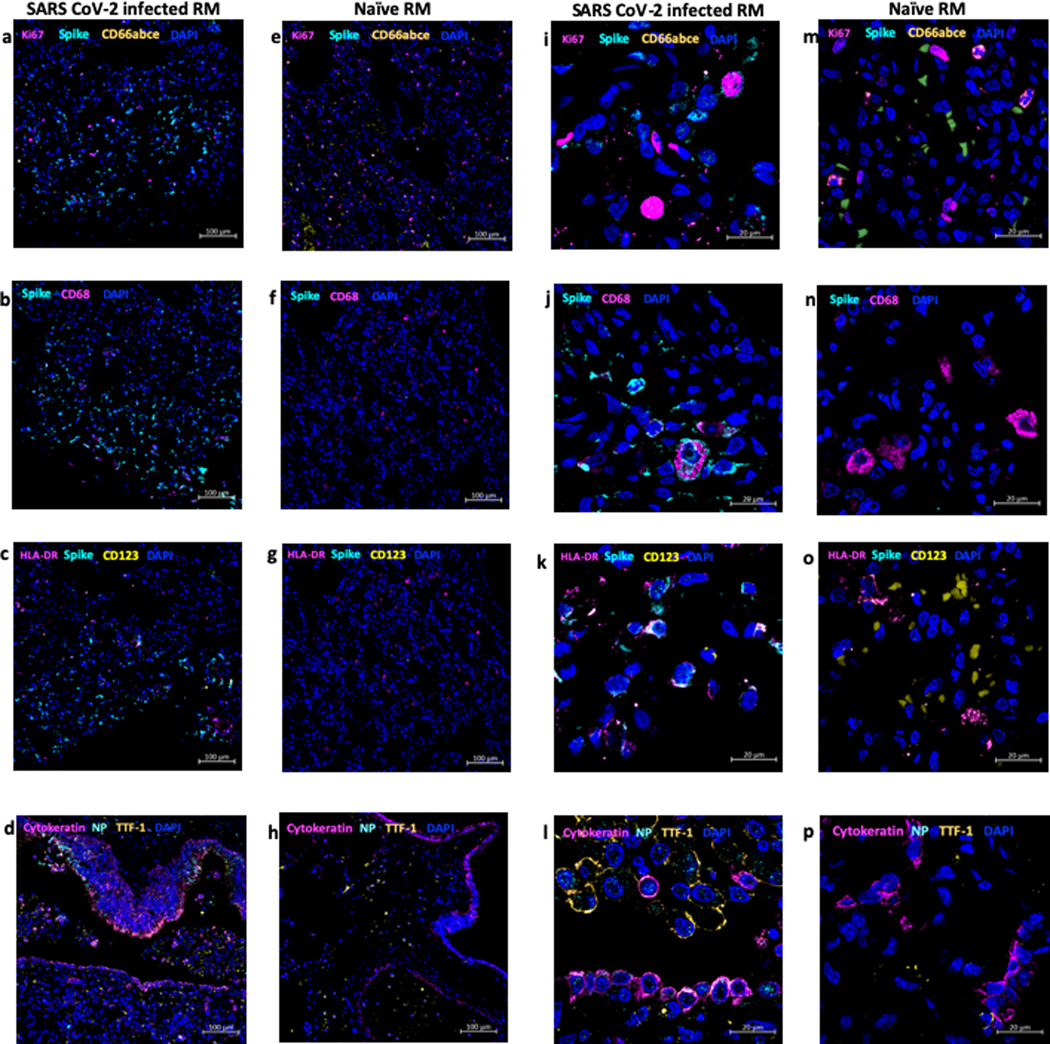
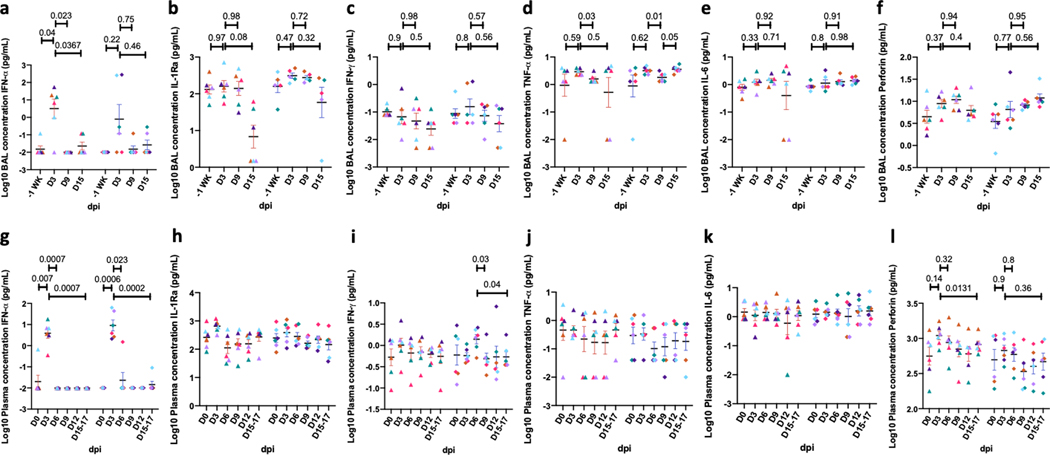
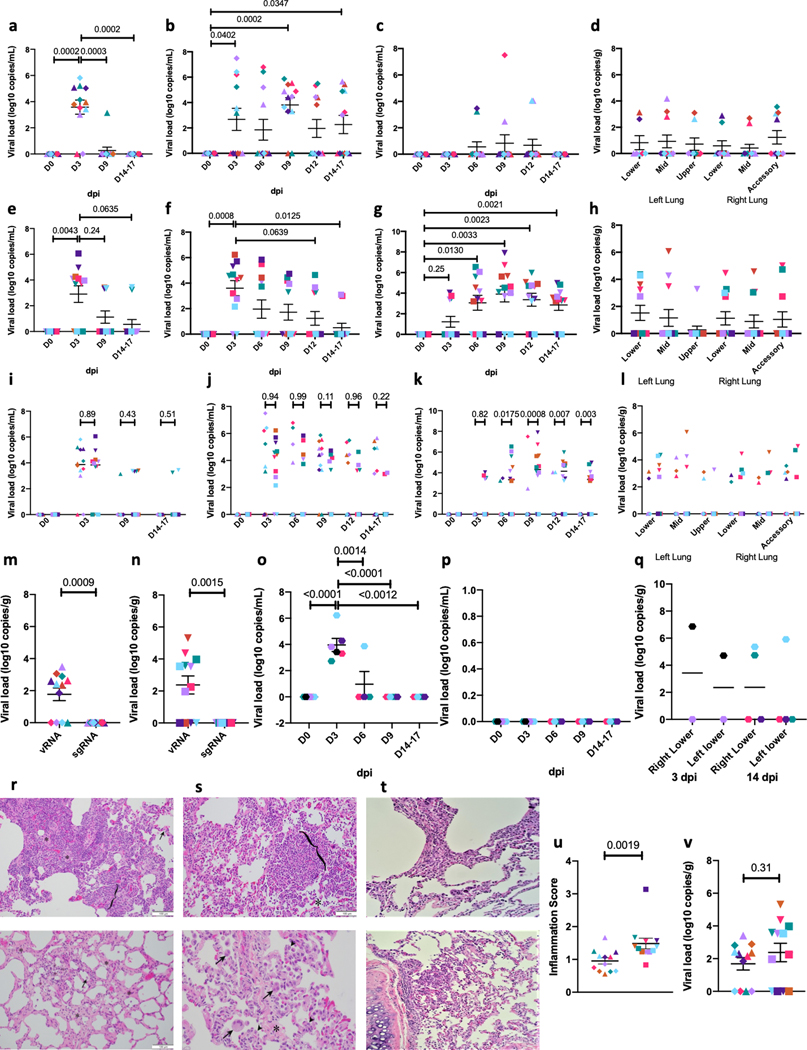
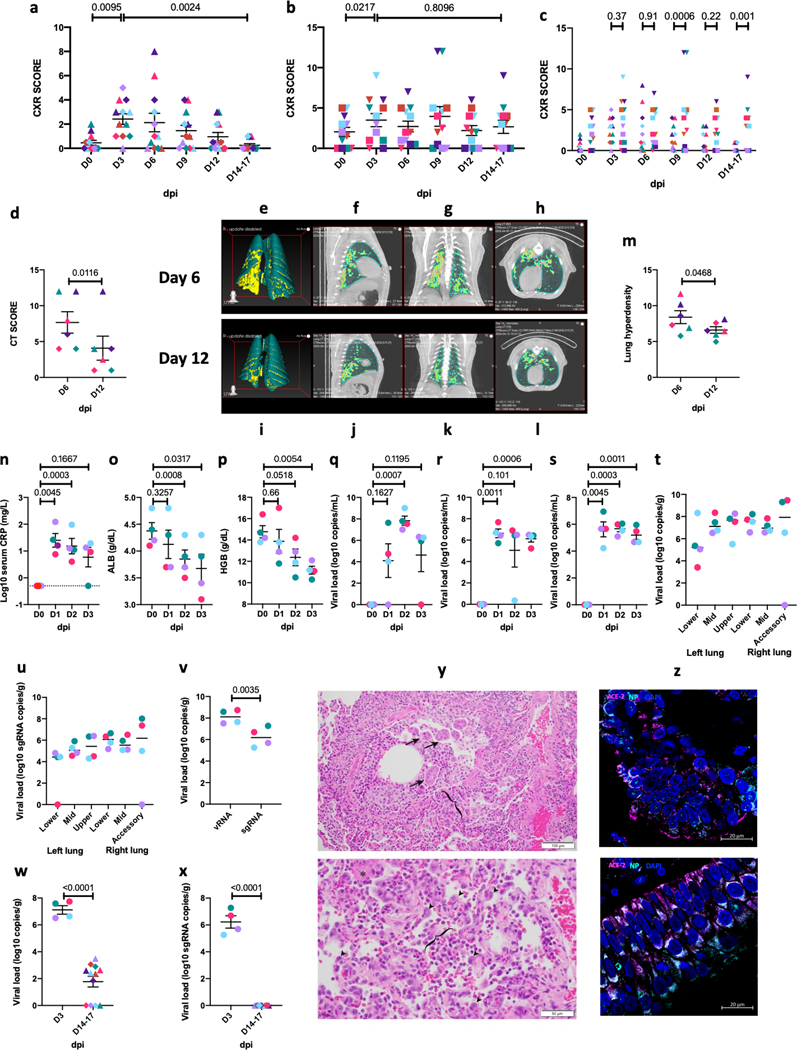
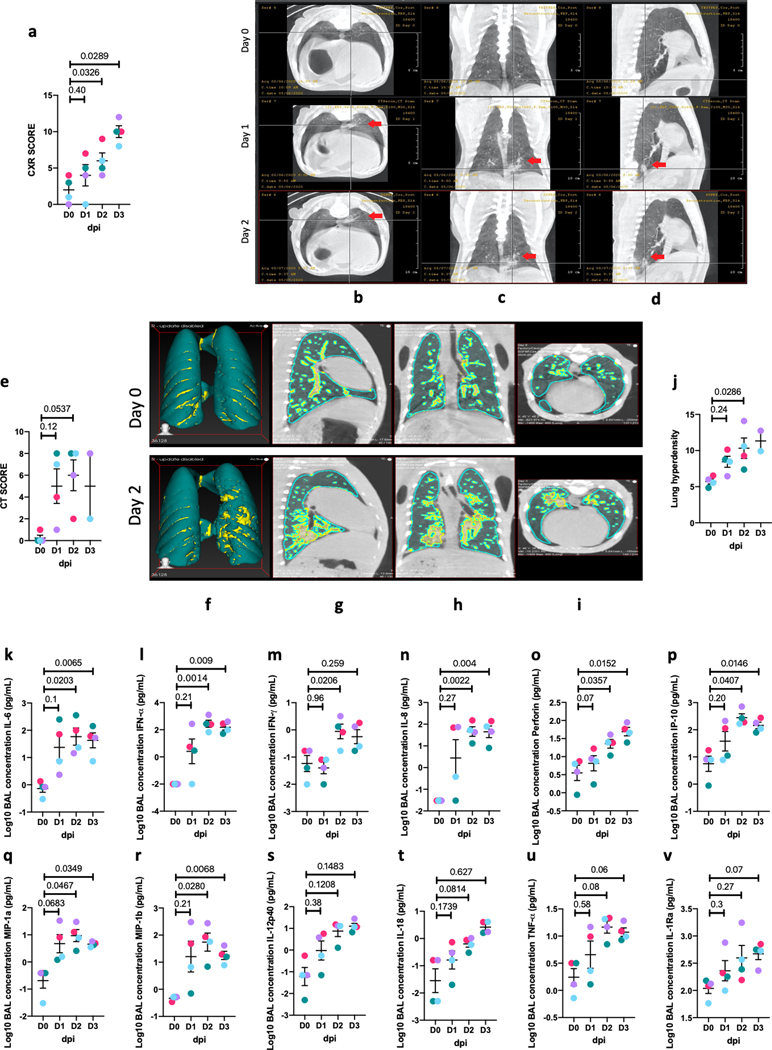
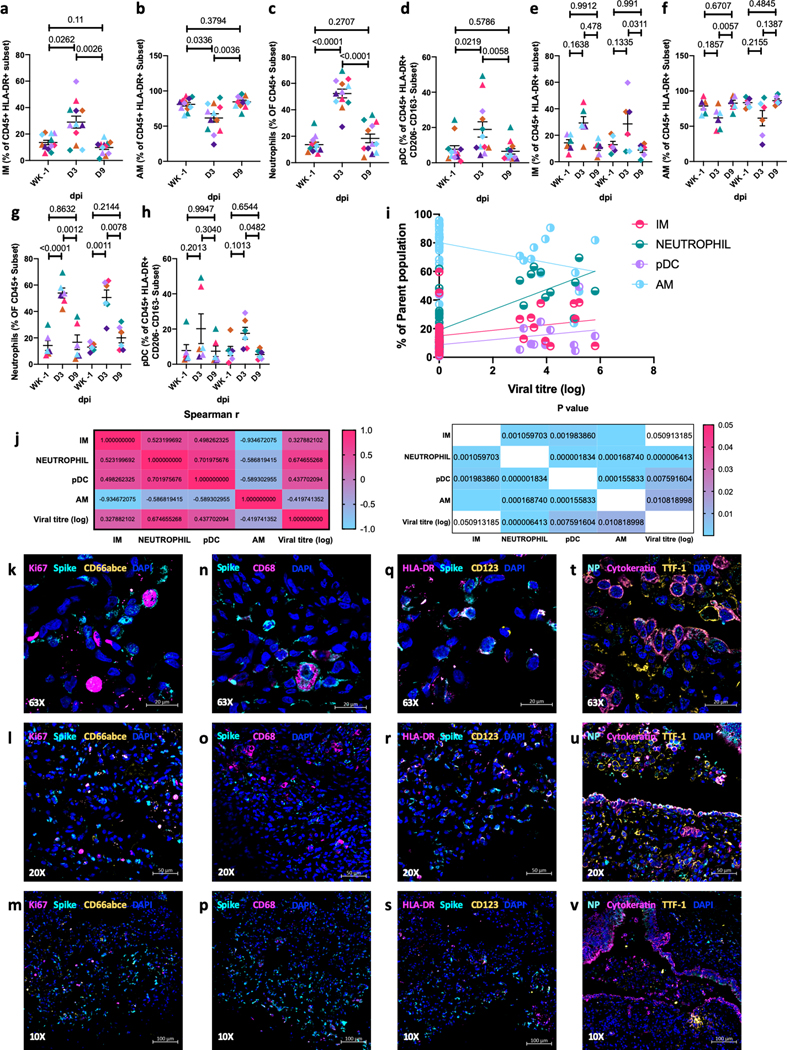
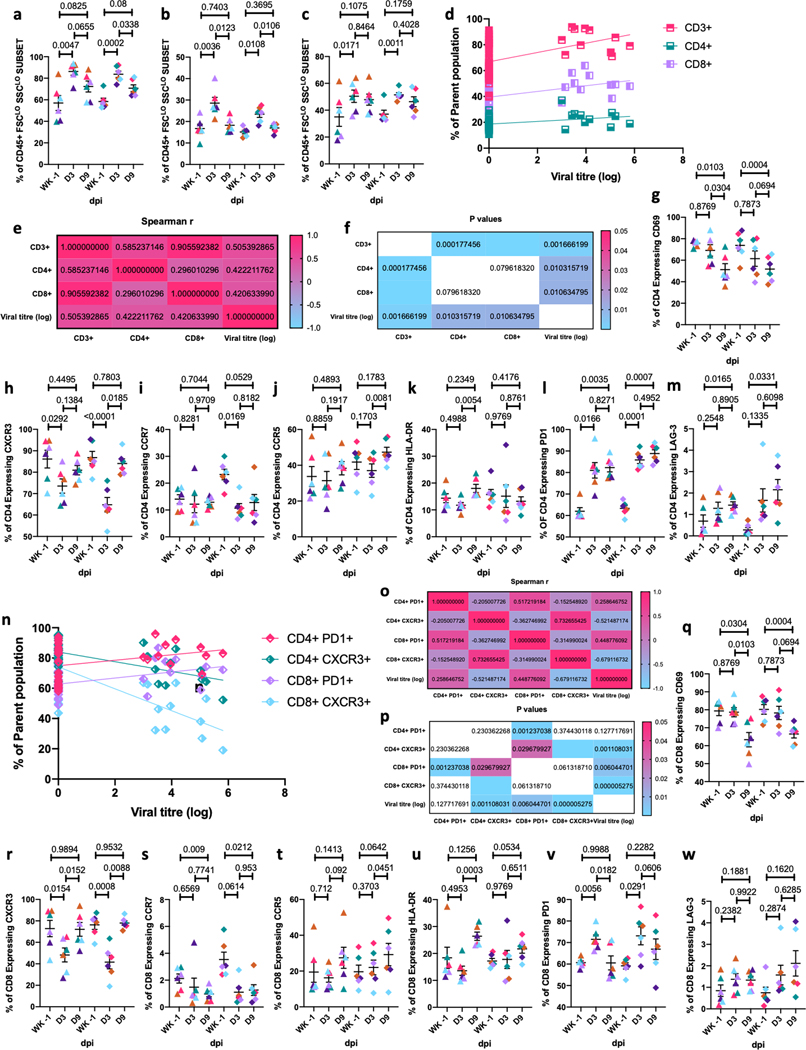
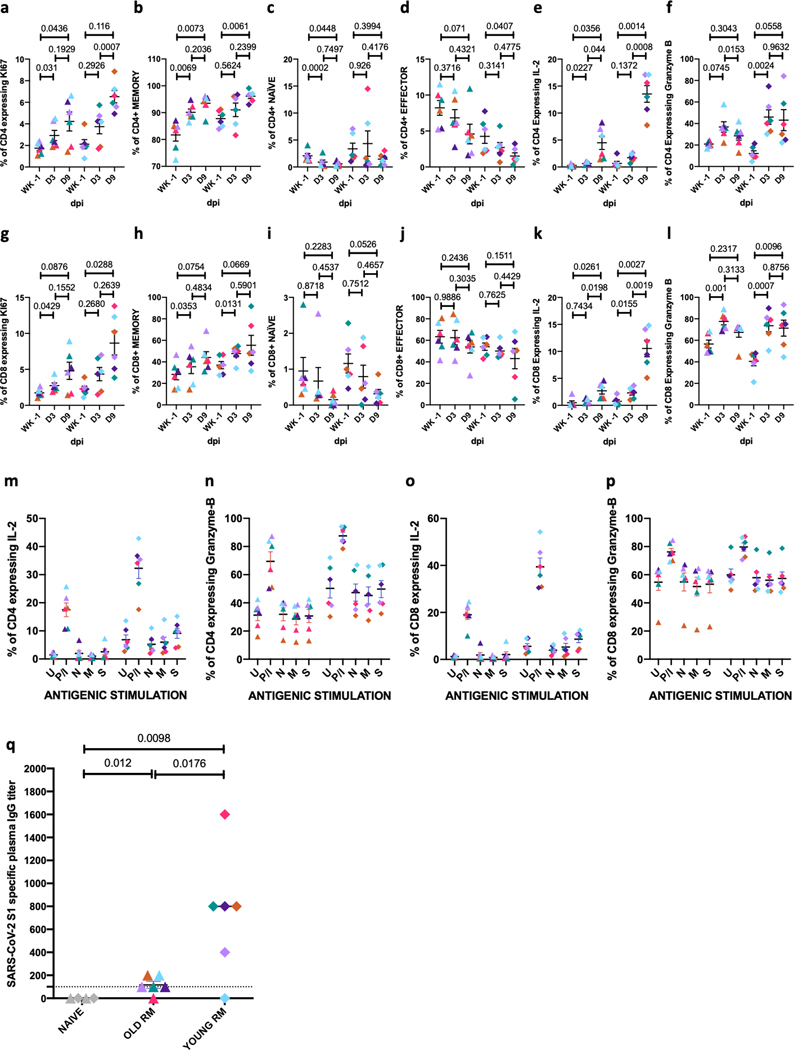
Non-human primate models will expedite therapeutics and vaccines for coronavirus disease 2019 (COVID-19) to clinical trials. Here, we compare acute severe acute respiratory syndrome coronavirus 2 (SARS-CoV-2) infection in young and old rhesus macaques, baboons and old marmosets. Macaques had clinical signs of viral infection, mild to moderate pneumonitis and extra-pulmonary pathologies, and both age groups recovered in two weeks. Baboons had prolonged viral RNA shedding and substantially more lung inflammation compared with macaques. Inflammation in bronchoalveolar lavage was increased in old versus young baboons. Using techniques including computed tomography imaging, immunophenotyping, and alveolar/peripheral cytokine response and immunohistochemical analyses, we delineated cellular immune responses to SARS-CoV-2 infection in macaque and baboon lungs, including innate and adaptive immune cells and a prominent type-I interferon response. Macaques developed T-cell memory phenotypes/responses and bystander cytokine production. Old macaques had lower titres of SARS-CoV-2-specific IgG antibody levels compared with young macaques. Acute respiratory distress in macaques and baboons recapitulates the progression of COVID-19 in humans, making them suitable as models to test vaccines and therapies.


Figures

Extended Data Fig. 1
Extended Data Fig. 1. Longitudinal viral RNA determination following SARS-CoV-2 infection in rhesus macaques.
Viral RNA (log10 copies/mL measured by RT-PCR in buccopharyngeal (a) swab, plasma (b) and urine (c) of rhesus macaques longitudinally 39. Subgenomic viral RNA (log10 copies/gram of lung tissue was measured at endpoint in rhesus macaques and (d) and Baboons (e). (Rhesus: Old-Triangle, Young-Diamonds; Baboon: Old-Inverted triangle, Young-Square, Colors represent individual animals, Supplementary Table 1). (n=12). Data are represented as mean± SEM. Two way Repeated-measures ANOVA with Geisser-Greenhouse correction for sphericity and Tukey’s post hoc correction for multiple-testing (GraphPad Prism 8) was applied. Correlations with Spearman’s rank test between Log10 viral RNA copy number in Lung with BAL and NS (f) and corresponding values for Spearman’s rank correlation coefficient (g) and P values (h). Coloring scheme for f – BAL (magenta circle), NS (teal square).
Extended Data Fig. 2
Extended Data Fig. 2. Gross and histopathologic findings of young and aged male and female Rhesus macaques experimentally exposed to SARS-CoV-2 – 14-17 dpi
Young male Rhesus macaque. Lung was grossly unremarkable (a). Aged male Rhesus macaque. The dorsal aspect of the lungs was mottled red (b). Young male Rhesus macaque. Lung. Subgross image showing multifocal areas of minimal interstitial pneumonia (*) (c). Young female Rhesus macaque. Lung. Mild lymphocytic interstitial pneumonia with alveolar septa (bracket) expanded by mononuclear cells (lymphocytes and macrophages) (d). Aged female Rhesus macaque. Lung. Mild lymphocytic interstitial pneumonia with increased alveolar macrophages and few syncytial cells (arrow) within the alveolar lumen (*; a neutrophil is just to the left of the *) and type II pneumocytes lining alveoli (arrowhead) (e). Aged female Rhesus macaque. Lung. Minimal interstitial pneumonia with alveolar septa expanded by fibrosis (*) and few syncytial cells (arrow) within alveoli (f). Young male Rhesus macaque. Lung. Alveolar septa expanded by fibrosis (*) and lymphocyte infiltrates (g). Aged male Rhesus macaque. Lung. Areas of bronchiolization (arrows) (h). Young female Rhesus macaque. Lung. Vasculitis. Vascular wall disrupted by infiltrates of mononuclear cells and lesser neutrophils (arrow) (i). Young female Rhesus macaque. Lung. Bronchitis. Bronchial epithelium infiltrated by eosinophils (arrow). Fibrosis adjacent to bronchus (*) (j). Young female Rhesus macaque. Lung. Area of perivascular lymphocyte infiltrates (*) (k). Young female Rhesus macaque. Lung. Area of bronchiolar associated lymphoid tissue (BALT) (*) (l). All slides were stained with H&E. Multiple random fields across all sections from all macaques (n=12, Supplementary Table 2) were analyzed.
Extended Data Fig. 3
Extended Data Fig. 3. Gross and histopathologic findings of young and aged male and female baboons experimentally exposed to SARS-CoV-2 – 14-17 dpi.
Young male baboon. The dorsal aspect of the lungs was mottled red (*) (a). Young female baboon. The dorsal aspect of the lungs was mottled red (*) (b). Young male baboon. Lung. Subgross image showing areas of consolidation (*) (c). Young female baboon. Moderate lymphocytic interstitial pneumonia with scattered neutrophils (arrowhead) (d). Young female baboon. Moderate lymphocytic interstitial pneumonia with alveolar septa (bracket) markedly expanded by mononuclear cells (lymphocytes and macrophages) and increased alveolar macrophages within the alveolar lumen (*) (e). Young male baboon. Lung. Mild lymphocytic interstitial pneumonia with increased alveolar macrophages and few syncytial cells (arrow) within the alveolar lumen (*) (f). Young female baboon. Mild lymphocytic interstitial pneumonia with scattered type II pneumocytes (arrows) and increased alveolar macrophages and neutrophils within the alveolar lumen (*) (g). Young male baboon. Lung. Alveolar septa expanded by fibrosis (*) (h). Young male baboon. Lung. Alveolar septa expanded by fibrosis (*) (i). Young female baboon. Area of bronchiolization (bracket) (j). Young male baboon. Lung. Syncytial cells within airways (arrows) (k). Young male baboon. Lung. Bronchitis. Bronchial wall expanded by infiltrates of eosinophils that expand and disrupt the epithelium (arrow). Area of bronchiolar associated lymphoid tissue (BALT) (*) (l). All slides were stained with H&E. Multiple random fields across all sections from all baboons (n=12, Supplementary Table 3) were analysed.
Extended Data Fig. 4
Extended Data Fig. 4. Representative CT scan images for rhesus macaques infected with SARS-CoV-2 over two weeks.
Representative CT scan in axial view showing lesion characteristics in rhesus macaques infected with SARS-CoV-2 from Day 6–12 dpi. As seen in panel a, b, d, e and f patchy alveolar patterns, nodular and/or multifocal ground glass opacities (red arrow) seen on Day 6 dpi show dramatic resolution by Day 12 dpi, whereas panel c shows persistent patchy ground glass opacity on Day 6 dpi and Day 12 dpi.
Extended Data Fig. 5
Extended Data Fig. 5. Clinical correlates in short-term (0–3 dpi) rhesus macaques.
Serum levels of tCO2 (D-mmol/L) (a), and whole blood levels of Red Blood Cells (RBCs) (million/mL) (b), reticulocytes (K/mL) (c), White Blood Cells (WBCs) (K/mL) (d), platelets (K/uL) (e), Neutrophils (K/mL) (f), percentage of Neutrophils (g), percentage of monocytes (h). Viral RNA (log10 copies/mL were measured by RT-PCR in saliva (i), and rectal swab (j) of rhesus macaques over 0–3 dpi (Circles, Colors represent individual animals, Supplementary Table 1) Data are represented as mean± SEM (n=4). One way Repeated-measures ANOVA with Geisser-Greenhouse correction for sphericity and Tukey’s post hoc correction for multiple-testing (GraphPad Prism 8) was applied.
Extended Data Fig. 6
Extended Data Fig. 6. Gross and histopathologic findings of young and aged male and female Rhesus macaques experimentally exposed to COVID19 – 3 dpi.
Young male Rhesus macaque. Lung was grossly unremarkable (a). Aged male Rhesus macaque. Lung. The dorsal aspect of the lungs was mottled red (*) (b). Aged male Rhesus macaque. Lung. Sub gross image showing extensive areas of consolidation (*) (c). Aged male Rhesus macaque. Lung. Moderate interstitial pneumonia with scattered type II pneumocytes (arrow), neutrophils (arrowhead), and intra-alveolar fibrin deposition (*) (d). Aged female Rhesus macaque. Lung. Mild interstitial pneumonia with scattered syncytial cells (arrow), neutrophils (arrowhead), and expansion of alveolar walls by fibrosis (bracket) (e). Young female Rhesus macaque. Lung. Vasculitis. Vascular wall disrupted by infiltrates of mononuclear cells and lesser neutrophils. Vessel lumen marked by (*) (f). Young female Rhesus macaque. Lung. Mild interstitial pneumonia. Alveolar spaces contain neutrophils and cellular debris (necrosis, arrow) (g). Young female Rhesus macaque. Lung. Mild interstitial pneumonia. Alveolar spaces (*) contain neutrophils and eosinophilic fluid (edema) (h). Young female Rhesus macaque. Lung. Bronchiolitis. Bronchiolar wall expanded by infiltrates of lymphocytes and macrophages (bracket) (i). Young male Rhesus macaque. Lung. Bronchitis. Bronchial wall expanded by infiltrates of eosinophils that expand and disrupt the epithelium and smooth muscle (bracket) (j). Young female Rhesus macaque. Lung. Bronchitis. Bronchial lumen contains macrophages (arrowhead), cellular debris, and syncytial cells (arrow) (k). Aged female Rhesus macaque. Lung. Area of bronchiolar associated lymphoid tissue (BALT) (*) (l). All slides were stained with H&E. Multiple random fields across all sections from all macaques (n=4, Supplementary Table 7) were analyzed.
Extended Data Fig. 7
Extended Data Fig. 7. Radiology of Rhesus macaques experimentally exposed to COVID19 – 3 dpi.
CXR Radiographs showing ventro-dorsal and right lateral views(a). Day 0: Normal, Day 1: Mild left caudal interstitial opacity with minimal diffuse right interstitial opacity, Day 2: Mild multifocal interstitial pattern (red arrow), Day 3: Mild multifocal interstitial pattern with patchy region in left caudal lobe (red arrow). CT scan axial view showing lesion characteristics in rhesus macaques infected with SARS-CoV-2 (b) at baseline and Day 1–3 dpi. As seen in (b) ground glass opacity seen on Day 2 dpi intensified on Day 3 dpi. (c) and (d) show lesions that appear on Day 1 show gradual resolution on Day 2–3 dpi whereas lesion in panel (e) observed on Day 1 dpi showed only minimal changes on Day 2. Red arrow point towards lung lesions with high attenuation.
Extended Data Fig. 8
Extended Data Fig. 8. SARS-CoV-2 induced cytokines in plasma.
Simultaneous analysis of multiple cytokines by Luminex technology in the plasma of rhesus macaques over 0–3 dpi. Levels of IL-6 (a), IFN-a (b), IFN-g (c), IL-8 (d), perforin (e), IP-10 (f), MIP1a (g), MIP1b (h), IL-12p40 (i), IL-18 (j), TNF-a (k) and IL-1Ra (l)are expressed in Log10 concentration in picogram per mL of plasma for rhesus macaques over 0–3 dpi (Circles, Colors represent individual animals, Supplementary Table 1). (n=4) Data are represented as mean± SEM. One way repeated-measures ANOVA with Geisser-Greenhouse correction for sphericity and Tukey’s post hoc correction for multiple-testing (GraphPad Prism 8) was applied.
Extended Data Fig. 9
Extended Data Fig. 9. Detection of SARS-CoV-2 signal in host lung cells by confocal microscopy.
Multilabel confocal immunofluorescence microscopy of a high viral titer lung lobe from SARS CoV-2 infected Rhesus macaque at 3 dpi with SARS CoV-2 Spike specific antibody (turquoise), Ki67 (magenta), neutrophil marker CD66abce (yellow) and DAPI (blue)- (10X-a, 63X-i) vs the naïve control lungs (10X-e, 63X-m). SARS CoV-2 Spike (turquoise), pan-macrophage marker CD68 (magenta) and DAPI (blue) in infected lungs (10X-b and 63X-j) vs the naïve control lungs (10X-f, 63X-n). SARS CoV-2 Spike (turquoise), HLA-DR (magenta), pDC marker CD123 (yellow) and DAPI (blue) specific staining in infected lungs (10X-c, 63X-k) vs naïve control lungs (10X-g, 63X-o). SARS CoV-2 Nucleocapsid (turquoise), Type-1 pneumocytes and epithelial marker pan-cytokeratin (magenta), Type-2 pneumocyte marker TTF-1 (yellow) and DAPI (blue) in infected lungs (10X-d, 63X-l) vs naïve control lungs (10X-h, 63X-p). Micrographs are representative of 6 random fields across 3 animals.
Extended Data Fig. 10
Extended Data Fig. 10. Longitudinal changes in SARS-CoV-2 induced cytokines in BAL fluid and plasma following SARS-CoV-2 infection in rhesus macaques over two weeks.
Simultaneous analysis of multiple cytokines by Luminex technology in the BAL fluid and plasma of rhesus macaques over 0–15 dpi. Levels of IFN-a (a), IL-1Ra (b), IFN-g (c), TNF-a (d), IL-6 (e), Perforin (f) are expressed in Log10 concentration in picogram per mL of BAL fluid. Levels of IFN-a (g), IL-1Ra (h), IFN-g (i), TNF-a (j), IL-6 (k), Perforin (l) are expressed in Log10 concentration in picogram per mL of BAL fluid. Coloring scheme – young (blue), old (red). Data are represented as mean± SEM. (n=12) Two way Repeated-measures ANOVA with Geisser-Greenhouse correction for sphericity and Tukey’s post hoc correction for multiple-testing (GraphPad Prism 8) was applied. (Rhesus macaques: Old-Triangle, Young Diamonds, Colors represent individual animals, Supplementary Table 1).
Figure 1.
Figure 1.. SARS-CoV-2 RNA and histopathology in rhesus macaques, baboons and marmosets.
Viral RNA in BAL fluid (a) and nasopharyngeal (b), rectal (c) swabs collected longitudinally and lung tissue homogenates (d) collected at endpoint (14–17 dpi) from SARS-CoV-2 infected rhesus macaques. Viral RNA in BAL fluid (e) and nasopharyngeal (f) and rectal (g) swabs collected longitudinally and lung tissue homogenates (h) at endpoint (14–17 dpi) from SARS-CoV-2 infected baboons. (n=12). Comparison of viral RNA in BAL fluid (i) and nasopharyngeal (j), rectal (k) swabs and lung (l) of SARS-CoV-2 infected rhesus macaques and baboons. To estimate the persistence of replicative virus we performed the subgenomic RNA estimation on endpoint lung samples of rhesus macaques (m) and baboons (n). (n=12). Viral RNA in nasal wash (o) and oral (p) swabs longitudinally. (n=6 for 0–3 dpi and n=4 for 6–14 dpi). Viral RNA was also measured in lung homogenates marmosets (q) at endpoint (3 dpi, n=2 & 14 dpi, n=4). One way (a-c, e-g, m-n) and Two way (i-l) Repeated-measures ANOVA with Geisser-Greenhouse correction for sphericity and Tukey’s post hoc correction for multiple-testing (GraphPad Prism 8). Data are represented as mean± SEM. Histopathologic analysis in infected rhesus macaques revealed regionally extensive interstitial lymphocytes, plasma cells, lesser macrophages and eosinophils expanding the alveolar septa (bracket) and alveolar spaces filled with macrophages (*). Normal alveolar wall is highlighted (arrow) for comparison (r, upper panel). Alveolar spaces with extensive interstitial alveolar wall thickening by deposits of collagen (*) and scattered alveolar macrophages (arrow) (r, lower panel). Histopathologic analysis in infected baboons also revealed regionally extensive interstitial lymphocytes, plasma cells, lesser macrophages and eosinophils expanding the alveolar septa (bracket) and alveolar spaces filled with macrophages (*) (s, upper panel). Alveolar wall thickening by interstitial deposits of collagen (*), alveoli lined by occasional type II pneumocytes (arrowhead) and alveolar spaces containing syncytial cells (arrow) and alveolar macrophages (s, lower panel). Histopathologic analysis in marmosets revealed milder form of interstitial lymphocytes, and macrophages recruited to the alveolar space (t). Comparison of endpoint viral titer (u) and lung inflammation score (v) of infected rhesus macaques and baboons. (n=12). One tailed Mann-Whitney U test was applied. (Rhesus macaques: Old-Triangle, Young Diamonds; Baboons: Old-Inverted triangle, Young-Square; Old marmosets: Hexagon; Colors represent individual animals, Supplementary Table 1).
Figure 2.
Figure 2.. Radiological correlates of SARS-CoV-2 infection in rhesus macaques and baboons.
CXR (a) scores in macaques (n=12), (b) baboons (n=12) and comparative CXR (c) scores of infected rhesus macaques and baboons. CT scores in macaques (d) (n=6). 3D reconstruction (e, i) of ROI volume representing the location of lesion. (f-h, j-l) represent image for quantification of lung lesion with teal area representing normal and yellow areas represent hyperdense voxels. Percent change in lung hyperdensity in SARS-CoV2 infected animals over 6 dpi compared to 12 dpi (m) (n=6). Clinical correlates of early SARS-CoV-2 infection in rhesus macaques over 0–3 dpi (Circles, Colors represent individual animals, Supplementary Table 1) showing Changes in serum CRP (n), albumin (o), hemoglobin content (p) in peripheral blood. Viral RNA BAL fluid (q), nasopharyngeal (r), and buccopharyngeal (s) swabs longitudinally. Viral RNA (t) and subgenomic RNA (u) was measured in lung tissue homogenates at endpoint (3 dpi). Side by side comparison of viral RNA and subgenomic RNA (v). Comparison of viral titer (w) and lung subgenomic RNA (x) of infected rhesus macaques between 3 day short and 14–17 day long study. (n=12). Mann-Whitney U test was applied.Hematoxylin and eosin (H&E) staining was performed on formalin-fixed paraffin-embedded (FFPE) lung sections from infected animals for pathological analysis Histopathologic analysis revealed bronchitis characterized by infiltrates of macrophages, lymphocytes, neutrophils, and eosinophils that expanded the wall (bracket), and along with syncytial cells (arrows) filled the bronchiole lumen and adjacent alveolar spaces. (y, upper panel); Suppurative interstitial pneumonia with Type II pneumocyte hyperplasia (arrowheads) and alveolar space filled with neutrophils, macrophages and fibrin (*). Bracket denotes alveolar space. (y, lower panel). Multilabel confocal immunofluorescence microscopy of lungs (z, upper panel) and nasal epithelium (z, lower panel) at 63x with Nucleocapsid (N) specific antibody (green) DAPI (blue), and ACE2 (red). (a-f) Data are represented as mean± SEM (n=4).). Undetectable viral titers are represented as 1 copy. One way (a-b, n-s) and Two way (c) Repeated-measures ANOVA with Geisser-Greenhouse correction for sphericity and Tukey’s post hoc correction for multiple-testing (GraphPad Prism 8) and (d, m, v-x) One tailed Mann-Whitney U test was applied. Data are represented as mean± SEM.
Figure 3
Figure 3. Alveolar compartment from 0–3 dpi for infected rhesus macaques.
CXR (a) and CT (e) scores of rhesus macaques over 0–3 dpi (Circles, Colors represent individual animals, Supplementary Table 1). Representative CT scan images performed on Day 0–2 dpi show (b) transverse, (c) vertical, (d) longitudinal view of left caudal lobe ground glass opacity on 1 dpi (middle), 2 dpi and baseline at 0 dpi (upper inset). CT scans (b-d) revealed evidence of pneumonia and lung abnormalities in the infected animals relative to controls which resolved between 1 to 2 dpi (red arrow). 3D reconstruction (f) of ROI volume representing the location of lesion. (Fig 2g–i) represent image for quantification of lung lesion with teal area representing normal intensity lung voxels, while yellow areas represent hyperdense voxels. Percent change in lung hyperdensity in SARS-CoV2 infected animals over Day 1–3 dpi compared to the baseline (j). Simultaneous analysis of multiple cytokines by Luminex technology in the BAL fluid of rhesus macaques over 0–3 dpi revealed SARS-CoV-2 induced alveolar inflammation showing increased Levels of IL-6 (k), IFN-a (l), IFN-g (m), IL-8 (n), perforin (o), IP-10 (p), MIP1a (q), MIP1b (r), IL-12p40 (s), IL-18 (t), TNF (u) and IL-1Ra (v) are expressed in Log10 concentration in picogram per mL of BAL fluid. Data are represented as mean± SEM (n=4). One way Repeated-measures ANOVA (a, k-v) with Geisser-Greenhouse correction for sphericity and Tukey’s post hoc correction for multiple-testing (GraphPad Prism 8) was applied. (e, j) n=4 for 0–2 dpi, n=2 for 3dpi. Ordinary one-way ANOVA with Dunnett’s post hoc test was applied. Data represented as (mean ± SEM).
Figure 4.
Figure 4.. Accumulation of myeloid cells in BAL of infected rhesus macaques.
Flow cytometric analysis of BAL IMs (a, e), AMs (b, f), neutrophils (c,g), and pDCs (d, h). Data shown combined for age (a-d) (n=12); data split by age (g-h) (n=6). Data is represented as mean± SEM. (a-d) One way and two way Repeated-measures ANOVA with Geisser-Greenhouse correction for sphericity and Tukey’s post hoc correction for multiple-testing (GraphPad Prism 8) was applied. (Old-Triangle, Young Diamonds, Colors represent individual animals, Supplementary Table 1). (n=12). Correlations with Spearman’s rank test between cellular fraction and Log10 viral RNA copy number in BAL (i) and corresponding values for Spearman’s rank correlation coefficient (j, left panel) and P values (j, right panel). Coloring scheme for i – Neutrophil (teal), IM (magenta), AM (turquoise, pDC (light purple). Multilabel confocal immunofluorescence microscopy of FFPE lung sections from SARS CoV-2 infected Rhesus macaques having a high viral titer at 3 dpi with DAPI (blue) (k-v) and SARS CoV-2 Spike (k-s) specific antibody (turquoise), k-m: KI-67 (magenta) , neutrophil marker CD66abce (yellow); n-p: SARS CoV-2 Spike (turquoise), pan-macrophage marker CD68 (magenta) and DAPI (blue); q-s: SARS CoV-2 Spike (turquoise), HLA-DR (magenta), pDC marker CD123 (yellow) and DAPI (blue); t-v: SARS CoV-2 Nucleocapsid protein specific antibody (turquoise), Pan-cytokeratin (magenta), Thyroid transcription factor-1 (yellow) at 63X (k,n,q,t), 20X (l,o,r,u) and 10X (m,p,s,v).
Figure 5.
Figure 5.. T cells in BAL of infected rhesus macaques.
BAL Frequencies of CD3+ T cells (a), CD4+ T cells (b), CD8+ T cells (c) and their correlations with Spearman’s rank test between cellular fraction and Log10 viral RNA copy number in BAL (d) and corresponding values for Spearman’s rank correlation coefficient (e) and P values (f). Coloring scheme for d – CD3+ (magenta), CD4+ (tuquoise) & CD8+ (light purple) T Cells. CD4+ T cell subsets expressing early activation marker CD69 (g), CXCR3 (h), PD-1 (i) and memory marker CCR7 (j), CCR5 (k), HLA-DR (l) and LAG-3 (m). Correlations with Spearman’s rank test between PD1 and CXCR3 expression on CD4+ and CD8+ T cells and Log10 viral RNA copy number in BAL (n) and corresponding values for Spearman’s rank correlation coefficient (o) and P values (p). Coloring scheme for n –CD4+ PD1+ (magenta), CD4+ CXCR3+ (teal), CD8+ PD1+ (light purple), CD8+ CXCR3+ (turquoise). CD8+ T cell subsets expressing early activation marker CD69 (q), CXCR3 (r), PD-1 (s) and memory marker CCR7 (t), CCR5 (u), HLA-DR (v) and LAG-3 (w). (Old-Triangle, Young Diamonds, Colors represent individual animals, Supplementary Table 1). (n=12). Fig 5a-c, g-m, q-w: Data is represented as mean± SEM. (n=12) Two way Repeated-measures ANOVA with Geisser-Greenhouse correction for sphericity and Tukey’s post hoc correction for multiple-testing (GraphPad Prism 8) was applied.
Figure 6.
Figure 6.
Memory T cells in BAL of infected rhesus macaques. BAL Frequencies of CD4+ T cell subsets expressing Ki67 (a), Memory (b), Naïve (c), Effector (d), IL-2 (e) and Granzyme B (f). Frequencies of CD8+ T cell subsets expressing KI67 (g), Memory (h), Naïve (i), Effector (j), IL-2 (k) and Granzyme B (l). BAL cells were stimulated overnight (12–14 hours) with either Mock control (U); PMA-Ionomycin (P/I) or SARS-CoV-2 -specific peptide pools of the nucleocapsid (N), membrane (M) and spike (S) proteins. Antigen specific cytokine secretion in T cells was estimated by flow cytometry. Fraction of CD4+ T cells secreting IL-2 (m), Granzyme B (n); CD8+ T cells secreting IL-2 (o) and Granzyme B (p). Coloring scheme – (Old-Triangle, Young Diamonds, Colors represent individual animals, Supplementary Table 1). (n=12). Data is represented as mean+ SEM. Two way Repeated-measures ANOVA with Geisser-Greenhouse correction for sphericity and Tukey’s post hoc correction for multiple-testing (GraphPad Prism 8) was applied. SARS-CoV-2 spike (S) protein specific antibody titer in plasma of rhesus macaques at endpoint (q). Coloring scheme – Naïve control , (Old-Triangle, Young Diamonds, Colors represent individual animals, Supplementary Table 1). Data is represented as mean± SEM. (n=4,6,6) Ordinary one-way ANOVA with Dunnett’s post hoc test (GraphPad Prism 8) was applied.

Comment in

Similar articles

Cited by

References

    1. Rockx B et al. Comparative pathogenesis of COVID-19, MERS, and SARS in a nonhuman primate model. Science, doi:10.1126/science.abb7314 (2020). - DOI - PMC - PubMed
    1. Munster VJ et al. Respiratory disease in rhesus macaques inoculated with SARS-CoV-2. Nature, doi:10.1038/s41586-020-2324-7 (2020). - DOI - PMC - PubMed
    1. Yu J et al. DNA vaccine protection against SARS-CoV-2 in rhesus macaques. Science, doi:10.1126/science.abc6284 (2020). - DOI - PMC - PubMed
    1. Chandrashekar A et al. SARS-CoV-2 infection protects against rechallenge in rhesus macaques. Science, doi:10.1126/science.abc4776 (2020). - DOI - PMC - PubMed
    1. Lu S et al. Comparison of nonhuman primates identified the suitable model for COVID-19. Signal Transduct Target Ther 5, 157, doi:10.1038/s41392-020-00269-6 (2020). - DOI - PMC - PubMed

Publication types

MeSH terms