Evaluation of [18F]F-DPA as a target for TSPO in head and neck cancer under normal conditions and after radiotherapy
- PMID: 33340054
- PMCID: PMC8113193
- DOI: 10.1007/s00259-020-05115-z
Evaluation of [18F]F-DPA as a target for TSPO in head and neck cancer under normal conditions and after radiotherapy
Abstract
Background: Many malignant tumours have increased TSPO expression, which has been related to a poor prognosis. TSPO-PET tracers have not comprehensively been evaluated in peripherally located tumours. This study aimed to evaluate whether N,N-diethyl-2-(2-(4-([18F]fluoro)phenyl)-5,7-dimethylpyrazolo[1,5-a]pyrimidin-3-yl)acetamide ([18F]F-DPA) can reflect radiotherapy (RT)-induced changes in TSPO activity in head and neck squamous cell carcinoma (HNSCC).
Methods: RT was used to induce inflammatory responses in HNSCC xenografts and cells. [18F]F-DPA uptake was measured in vivo in non-irradiated and irradiated tumours, followed by ex vivo biodistribution, autoradiography, and radiometabolite analysis. In vitro studies were performed in parental and TSPO-silenced (TSPO siRNA) cells. TSPO protein and mRNA expression, as well as tumour-associated macrophages (TAMs), were also assessed.
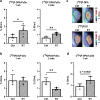
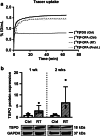
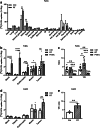
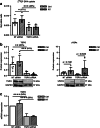
Results: In vivo imaging and ex vivo measurement revealed significantly higher [18F]F-DPA uptake in irradiated, compared to non-irradiated tumours. In vitro labelling studies with cells confirmed this finding, whereas no effect of RT on [18F]F-DPA uptake was detected in TSPO siRNA cells. Radiometabolite analysis showed that the amount of unchanged [18F]F-DPA in tumours was 95%, also after irradiation. PK11195 pre-treatment reduced the tumour-to-blood ratio of [18F]F-DPA by 73% in xenografts and by 88% in cells. TSPO protein and mRNA levels increased after RT, but were highly variable. The proportion of M1/M2 TAMs decreased after RT, whereas the proportion of monocytes and migratory monocytes/macrophages increased.
Conclusions: [18F]F-DPA can detect changes in TSPO expression levels after RT in HNSCC, which does not seem to reflect inflammation. Further studies are however needed to clarify the physiological mechanisms regulated by TSPO after RT.
Keywords: Head and neck cancer; PET; Radiotherapy; TSPO; [18F]F-DPA.
Conflict of interest statement
The authors declare that they have no conflict of interest.
Figures


Similar articles
-
Evaluation of [18F]F-DPA PET for Detecting Microglial Activation in the Spinal Cord of a Rat Model of Neuropathic Pain.Mol Imaging Biol. 2022 Aug;24(4):641-650. doi: 10.1007/s11307-022-01713-5. Epub 2022 Mar 18. Mol Imaging Biol. 2022. PMID: 35303205 Free PMC article.
-
Quantitative preclinical imaging of TSPO expression in glioma using N,N-diethyl-2-(2-(4-(2-18F-fluoroethoxy)phenyl)-5,7-dimethylpyrazolo[1,5-a]pyrimidin-3-yl)acetamide.J Nucl Med. 2012 Feb;53(2):287-94. doi: 10.2967/jnumed.111.095653. Epub 2012 Jan 17. J Nucl Med. 2012. PMID: 22251555 Free PMC article.
-
Promising potential of new generation translocator protein tracers providing enhanced contrast of arthritis imaging by positron emission tomography in a rat model of arthritis.Arthritis Res Ther. 2014 Mar 14;16(2):R70. doi: 10.1186/ar4509. Arthritis Res Ther. 2014. PMID: 24625077 Free PMC article.
-
The potential of carbon-11 and fluorine-18 chemistry: illustration through the development of positron emission tomography radioligands targeting the translocator protein 18 kDa.J Labelled Comp Radiopharm. 2013 Mar-Apr;56(3-4):96-104. doi: 10.1002/jlcr.2992. J Labelled Comp Radiopharm. 2013. PMID: 24285315 Review.
-
A mini-review: Application of the radiopharmaceutical [18F]DPA-714 in neuroinflammation research in post-SARS-CoV-2 patients.J Neurol Sci. 2025 Jun 15;473:123518. doi: 10.1016/j.jns.2025.123518. Epub 2025 Apr 28. J Neurol Sci. 2025. PMID: 40315803 Review.
Cited by
-
Imaging translocator protein expression with positron emission tomography.Eur J Nucl Med Mol Imaging. 2021 Dec;49(1):74-76. doi: 10.1007/s00259-021-05601-y. Eur J Nucl Med Mol Imaging. 2021. PMID: 34729627 No abstract available.
-
TSPO is a potential independent prognostic factor associated with cellular respiration and p16 in head and neck squamous cell carcinoma.Front Oncol. 2023 Dec 14;13:1298333. doi: 10.3389/fonc.2023.1298333. eCollection 2023. Front Oncol. 2023. PMID: 38162485 Free PMC article.
-
Prognostic Value of TSPO PET Before Radiotherapy in Newly Diagnosed IDH-Wild-Type Glioblastoma.J Nucl Med. 2023 Oct;64(10):1519-1525. doi: 10.2967/jnumed.122.265247. Epub 2023 Aug 3. J Nucl Med. 2023. PMID: 37536737 Free PMC article.
-
Evaluation of [18F]F-DPA PET for Detecting Microglial Activation in the Spinal Cord of a Rat Model of Neuropathic Pain.Mol Imaging Biol. 2022 Aug;24(4):641-650. doi: 10.1007/s11307-022-01713-5. Epub 2022 Mar 18. Mol Imaging Biol. 2022. PMID: 35303205 Free PMC article.
-
Positron Emission Tomography Imaging of Macrophages in Cancer.Cancers (Basel). 2021 Apr 16;13(8):1921. doi: 10.3390/cancers13081921. Cancers (Basel). 2021. PMID: 33923410 Free PMC article. Review.
References
-
- Best L, Ghadery C, Pavese N, Tai YF, Strafella AP. New and old TSPO PET radioligands for imaging brain microglial activation in neurodegenerative disease. Curr Neurol Neurosci Rep. 2019;19. 10.1007/s11910-019-0934-y. - PubMed
-
- Vasdev N, Green DE, Vines DC, McLarty K, McCormick PN, Moran MD, et al. Positron-emission tomography imaging of the TSPO with [18F]FEPPA in a preclinical breast cancer model. Cancer Biother Radiopharm. 2013;28:254–9. 10.1089/cbr.2012.1196. - PubMed
Publication types
MeSH terms
Substances
Grants and funding
LinkOut - more resources
Full Text Sources
Medical

