. 2021 Feb 10;29(2):165-178.e8.
doi: 10.1016/j.chom.2020.11.013. Epub 2020 Dec 18.

The immune landscape in tuberculosis reveals populations linked to disease and latency

Affiliations

The immune landscape in tuberculosis reveals populations linked to disease and latency

Ekaterina Esaulova et al. Cell Host Microbe. .

Abstract

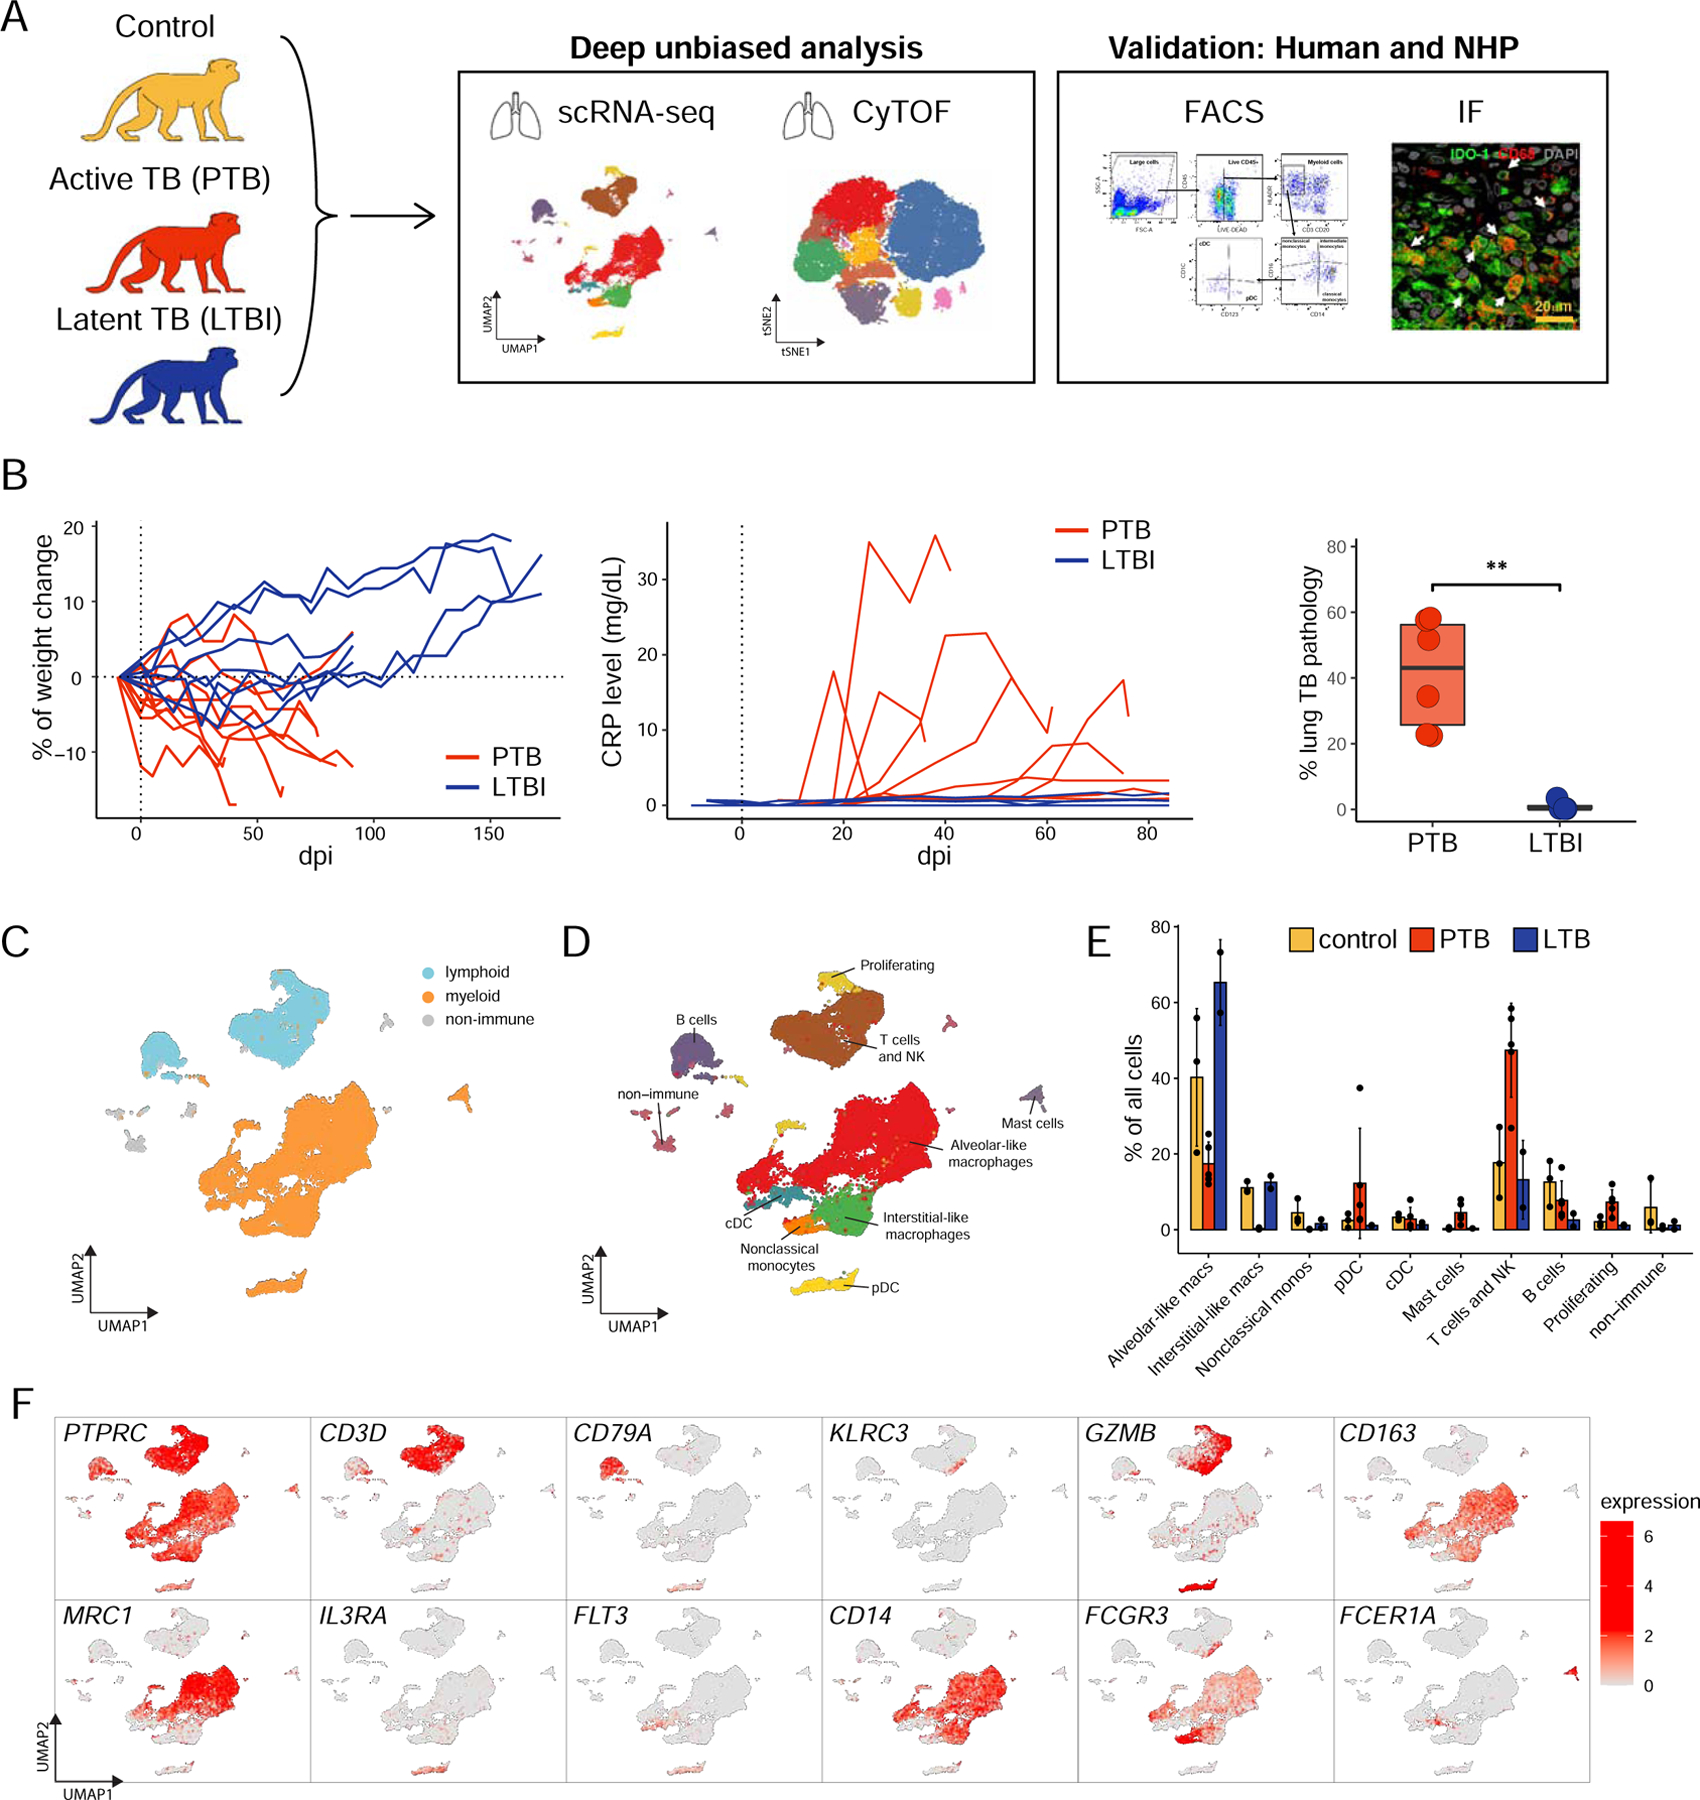
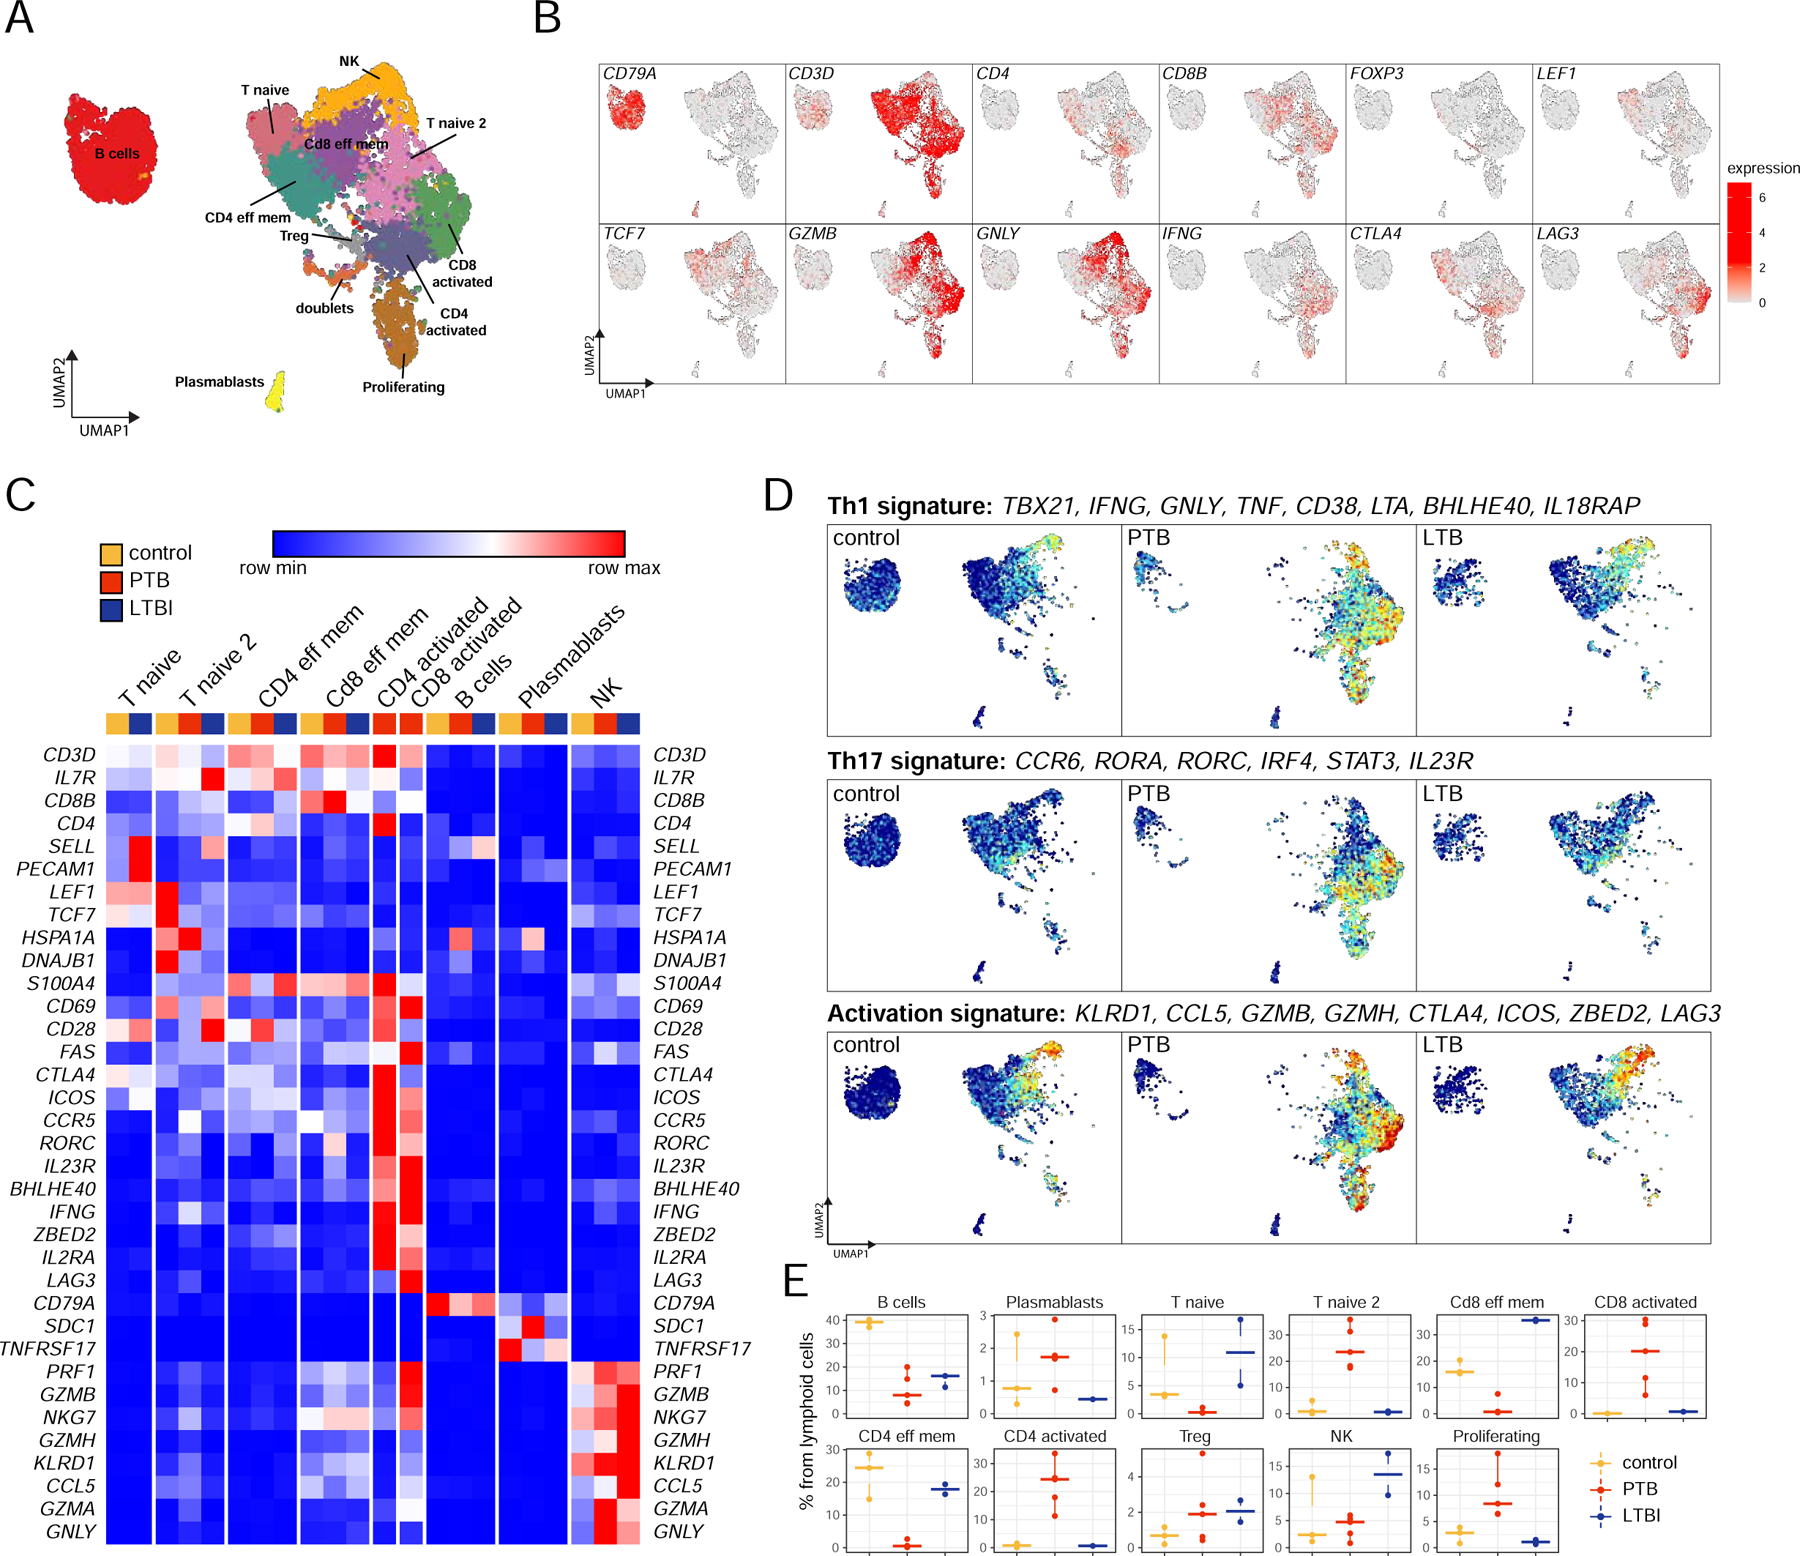
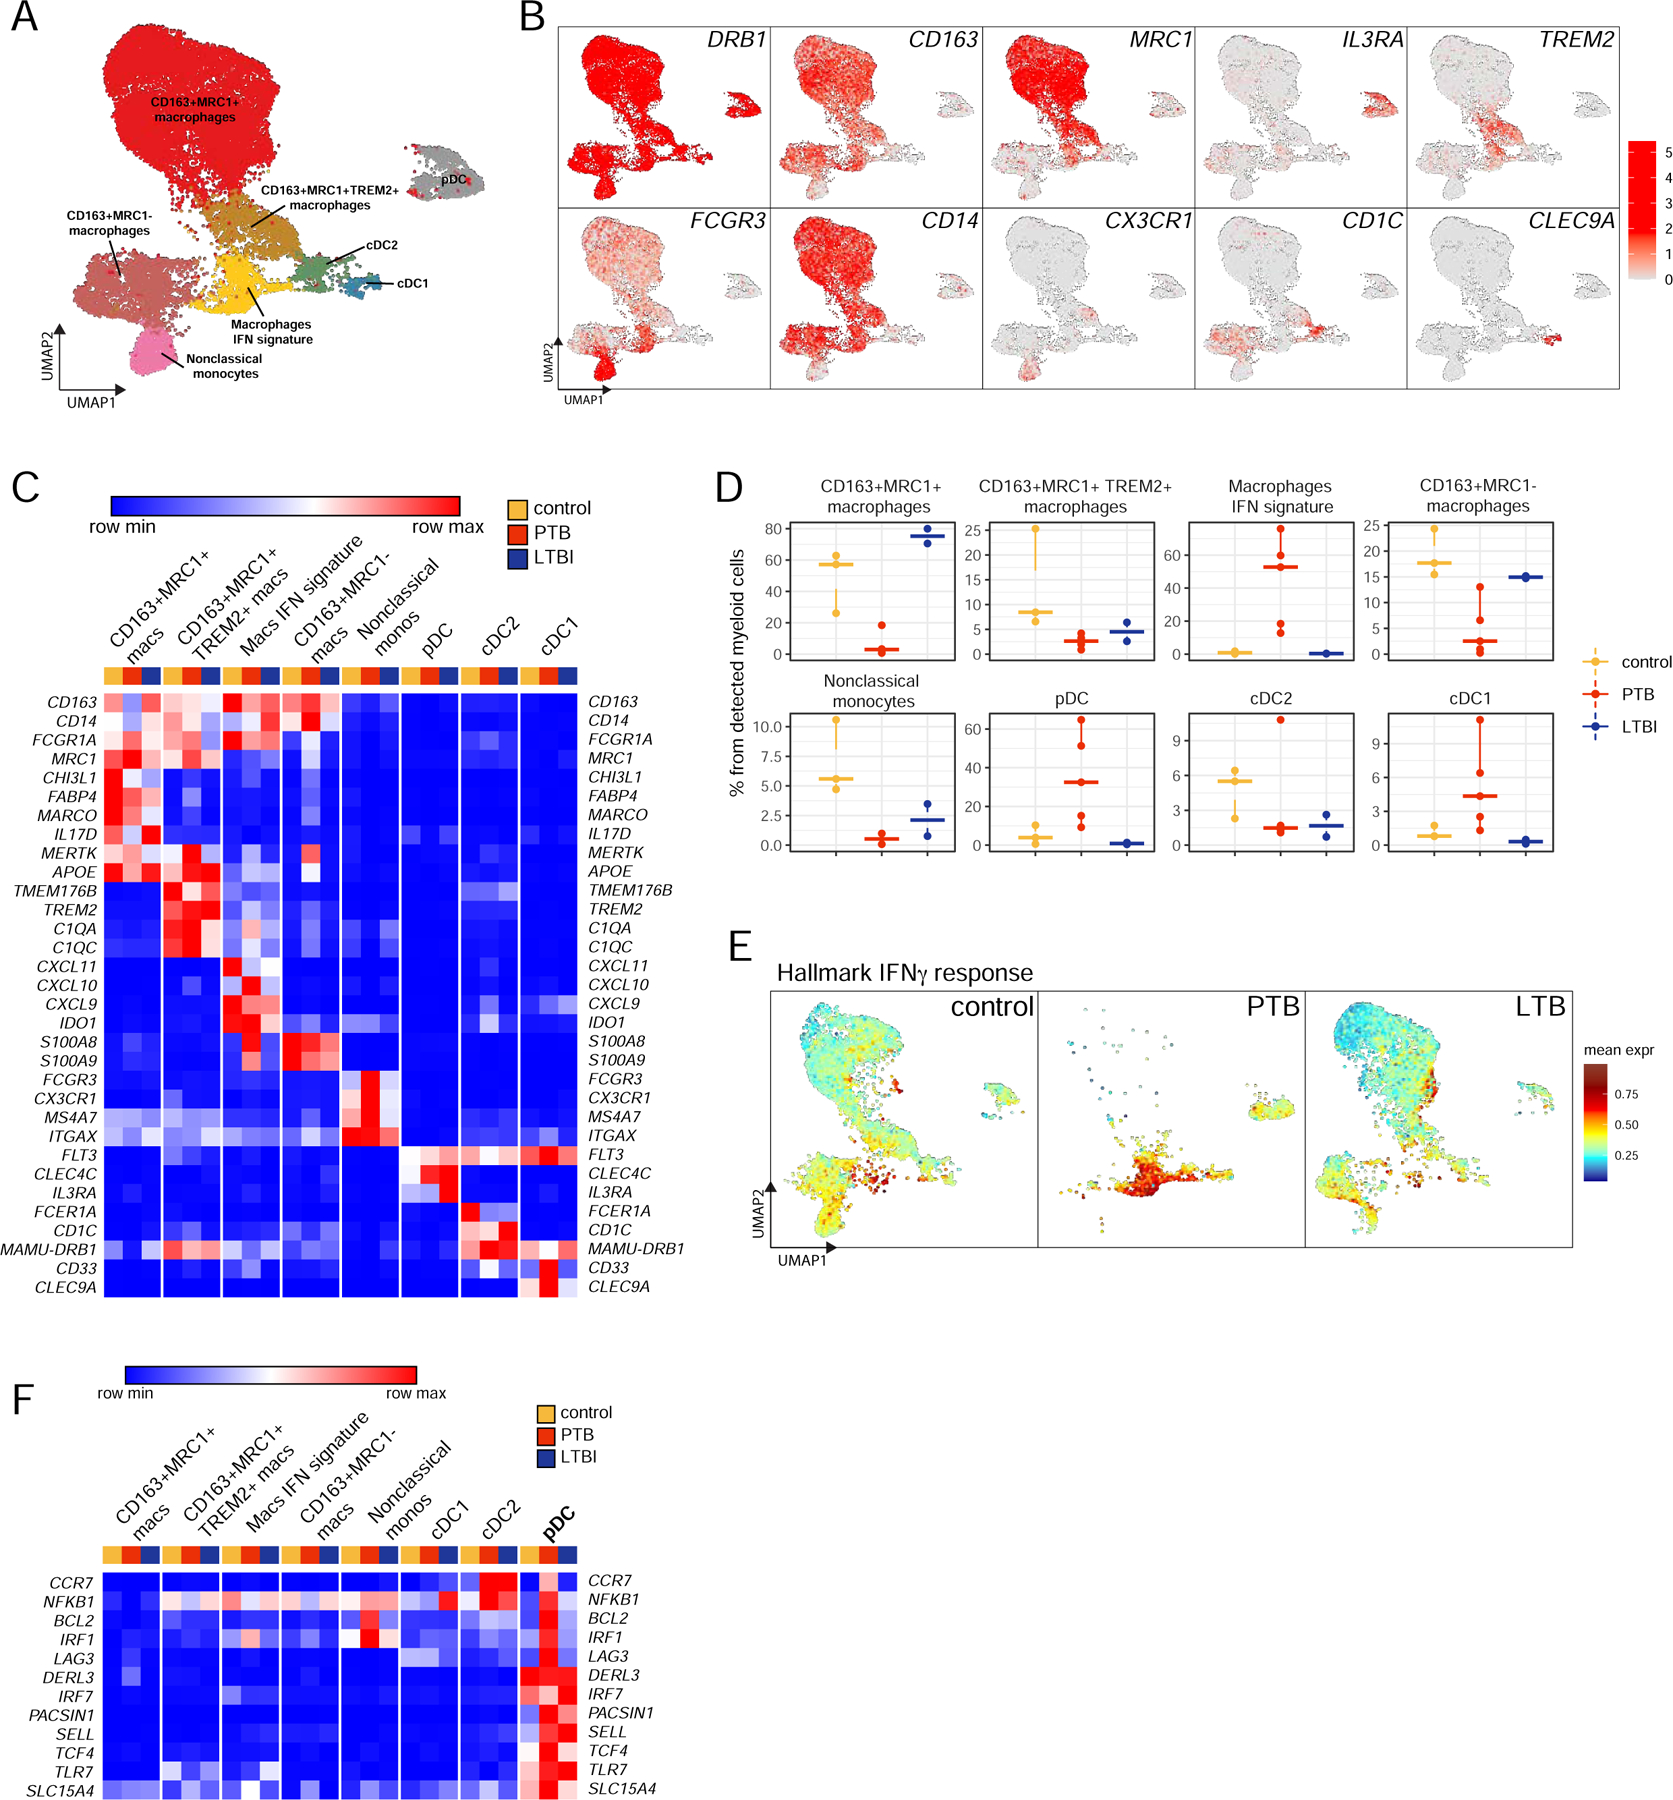
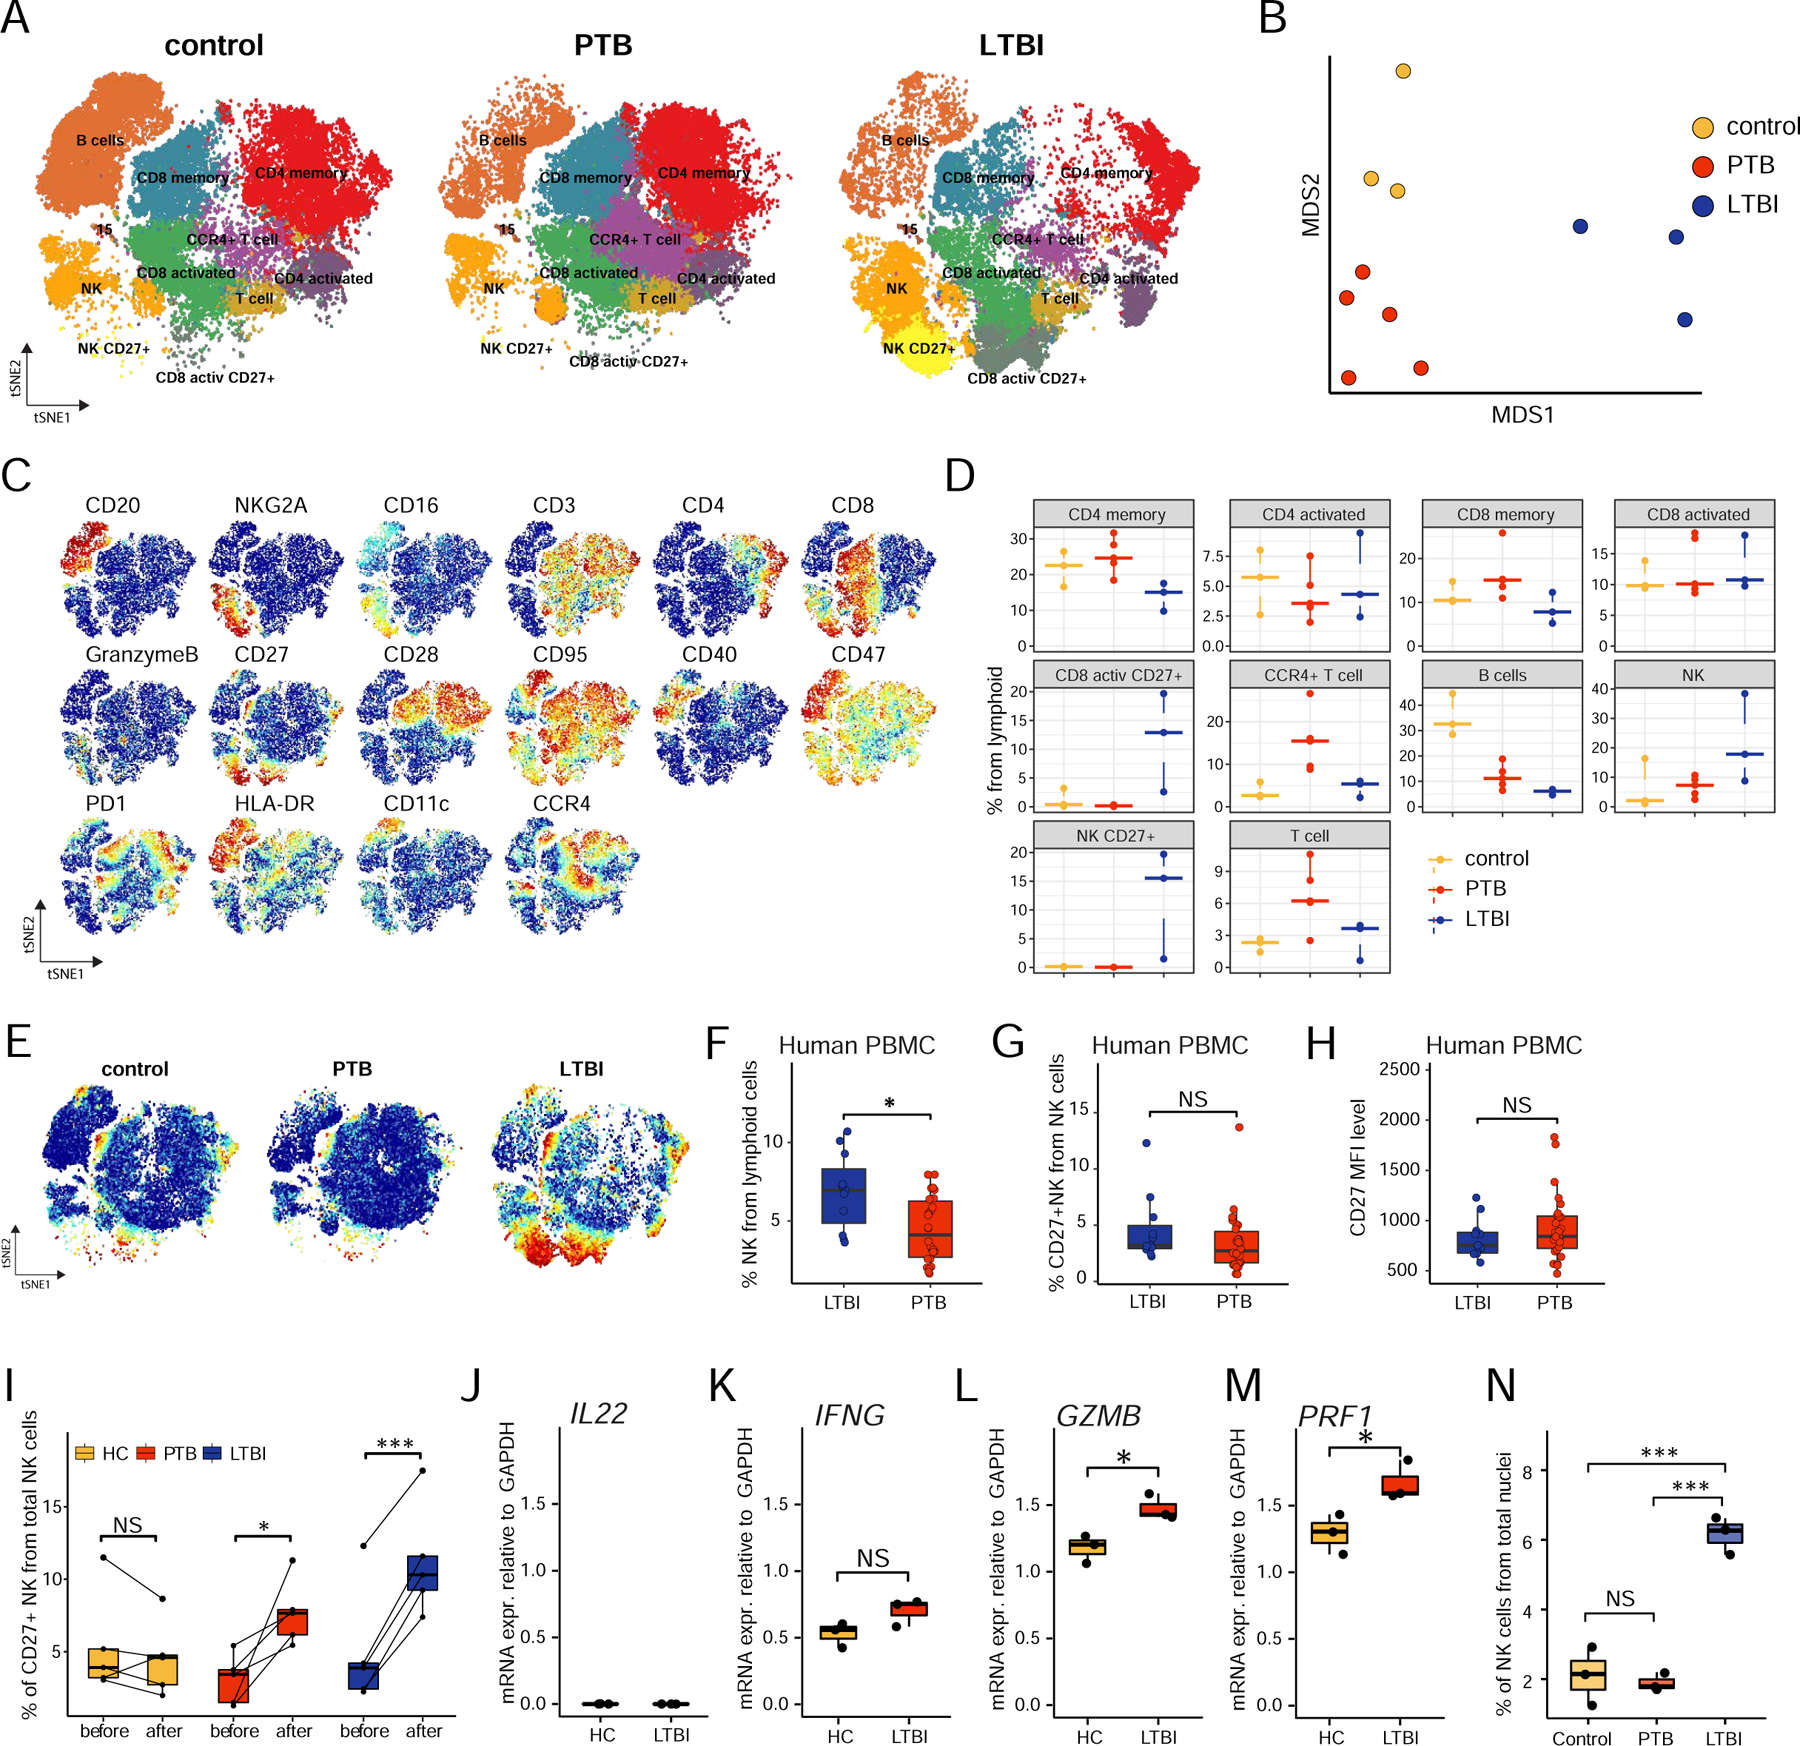
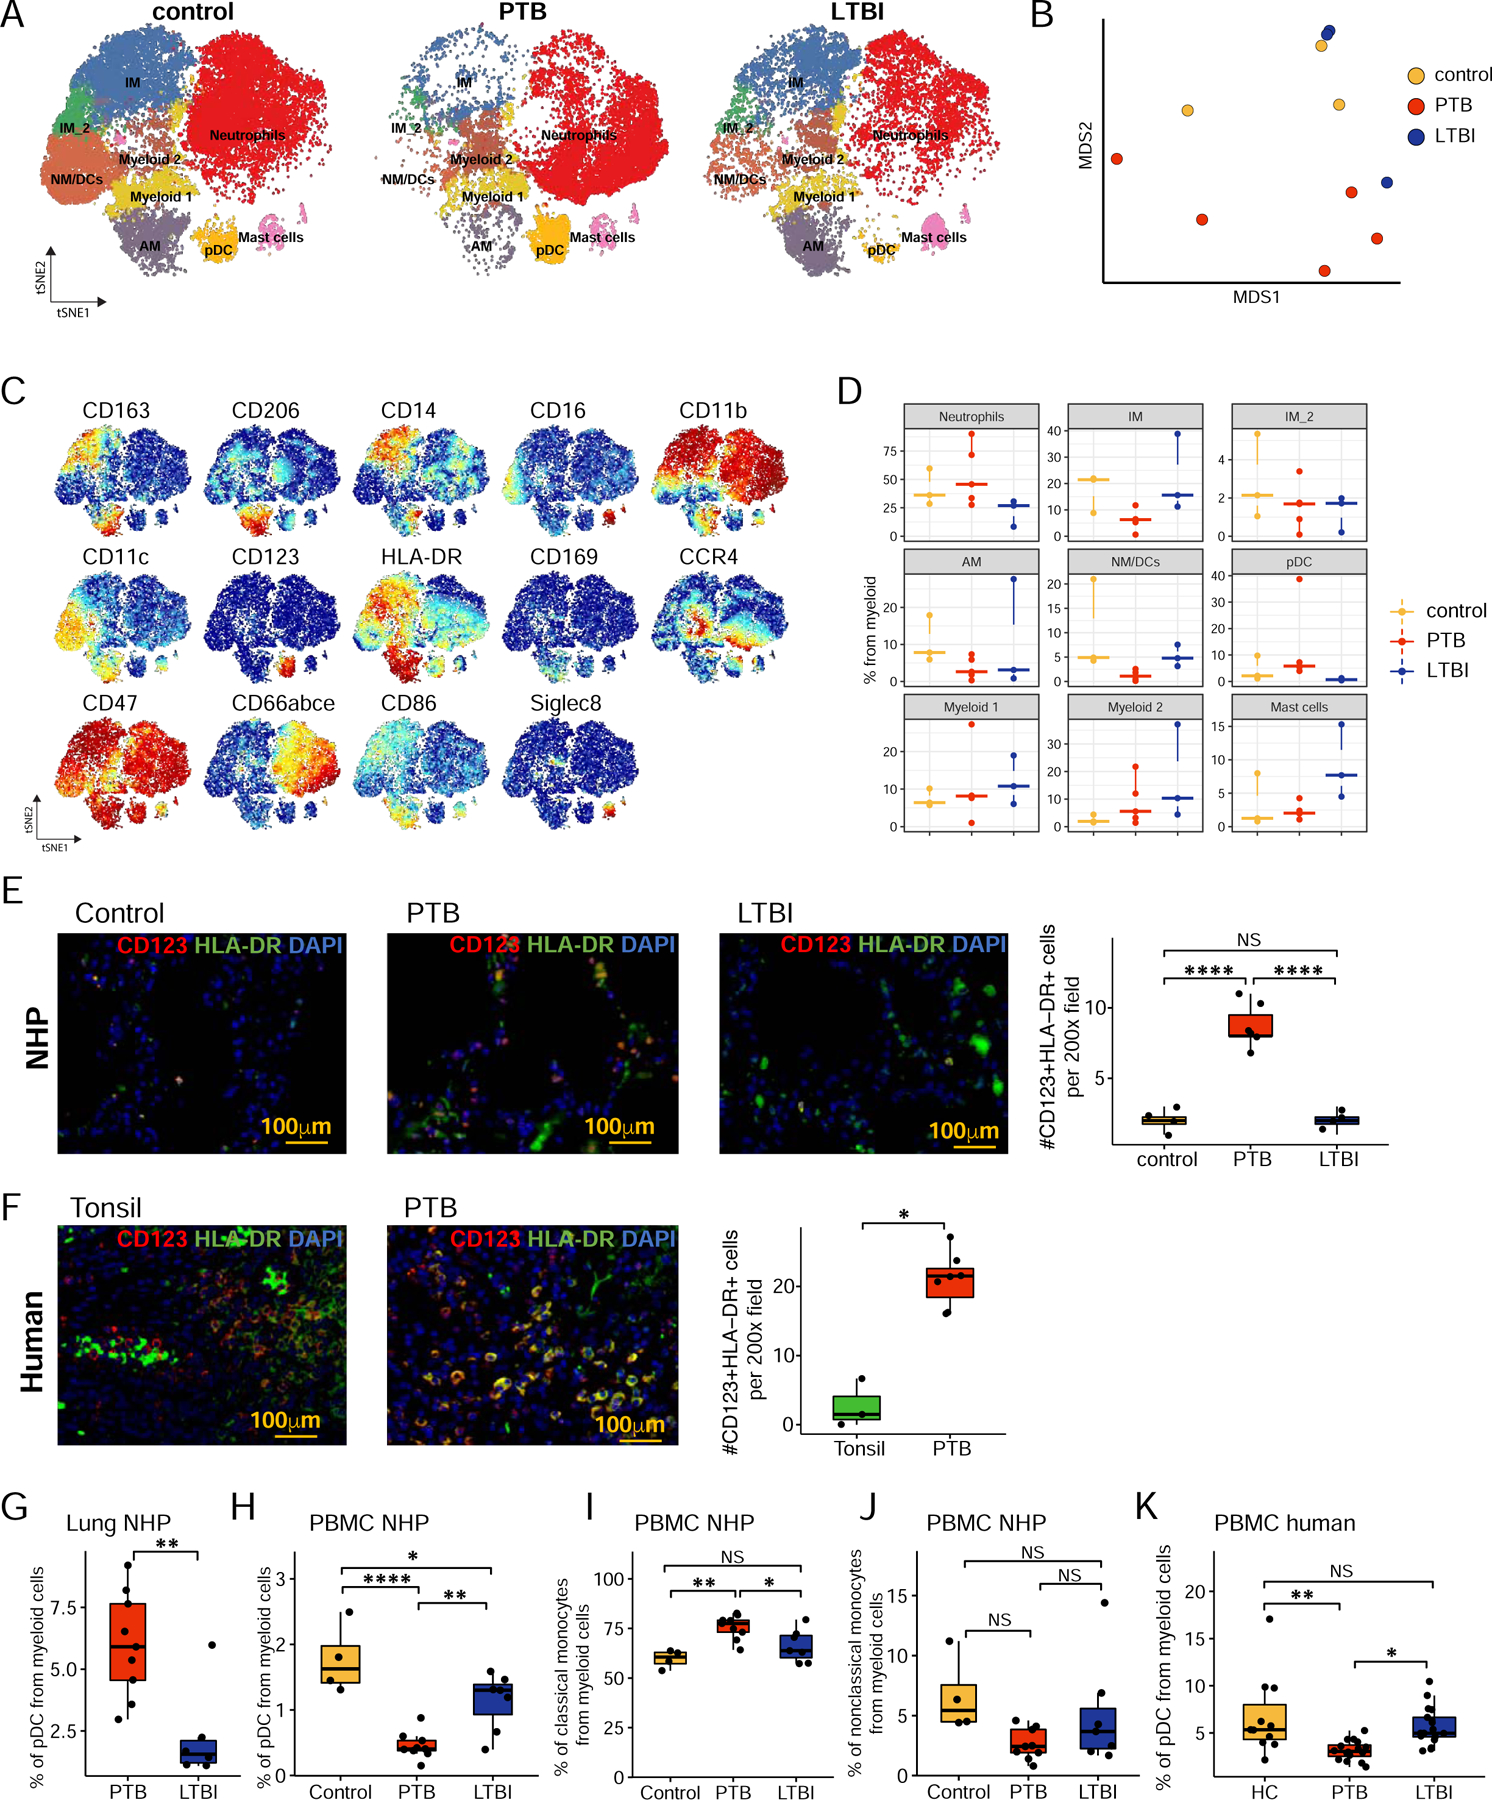
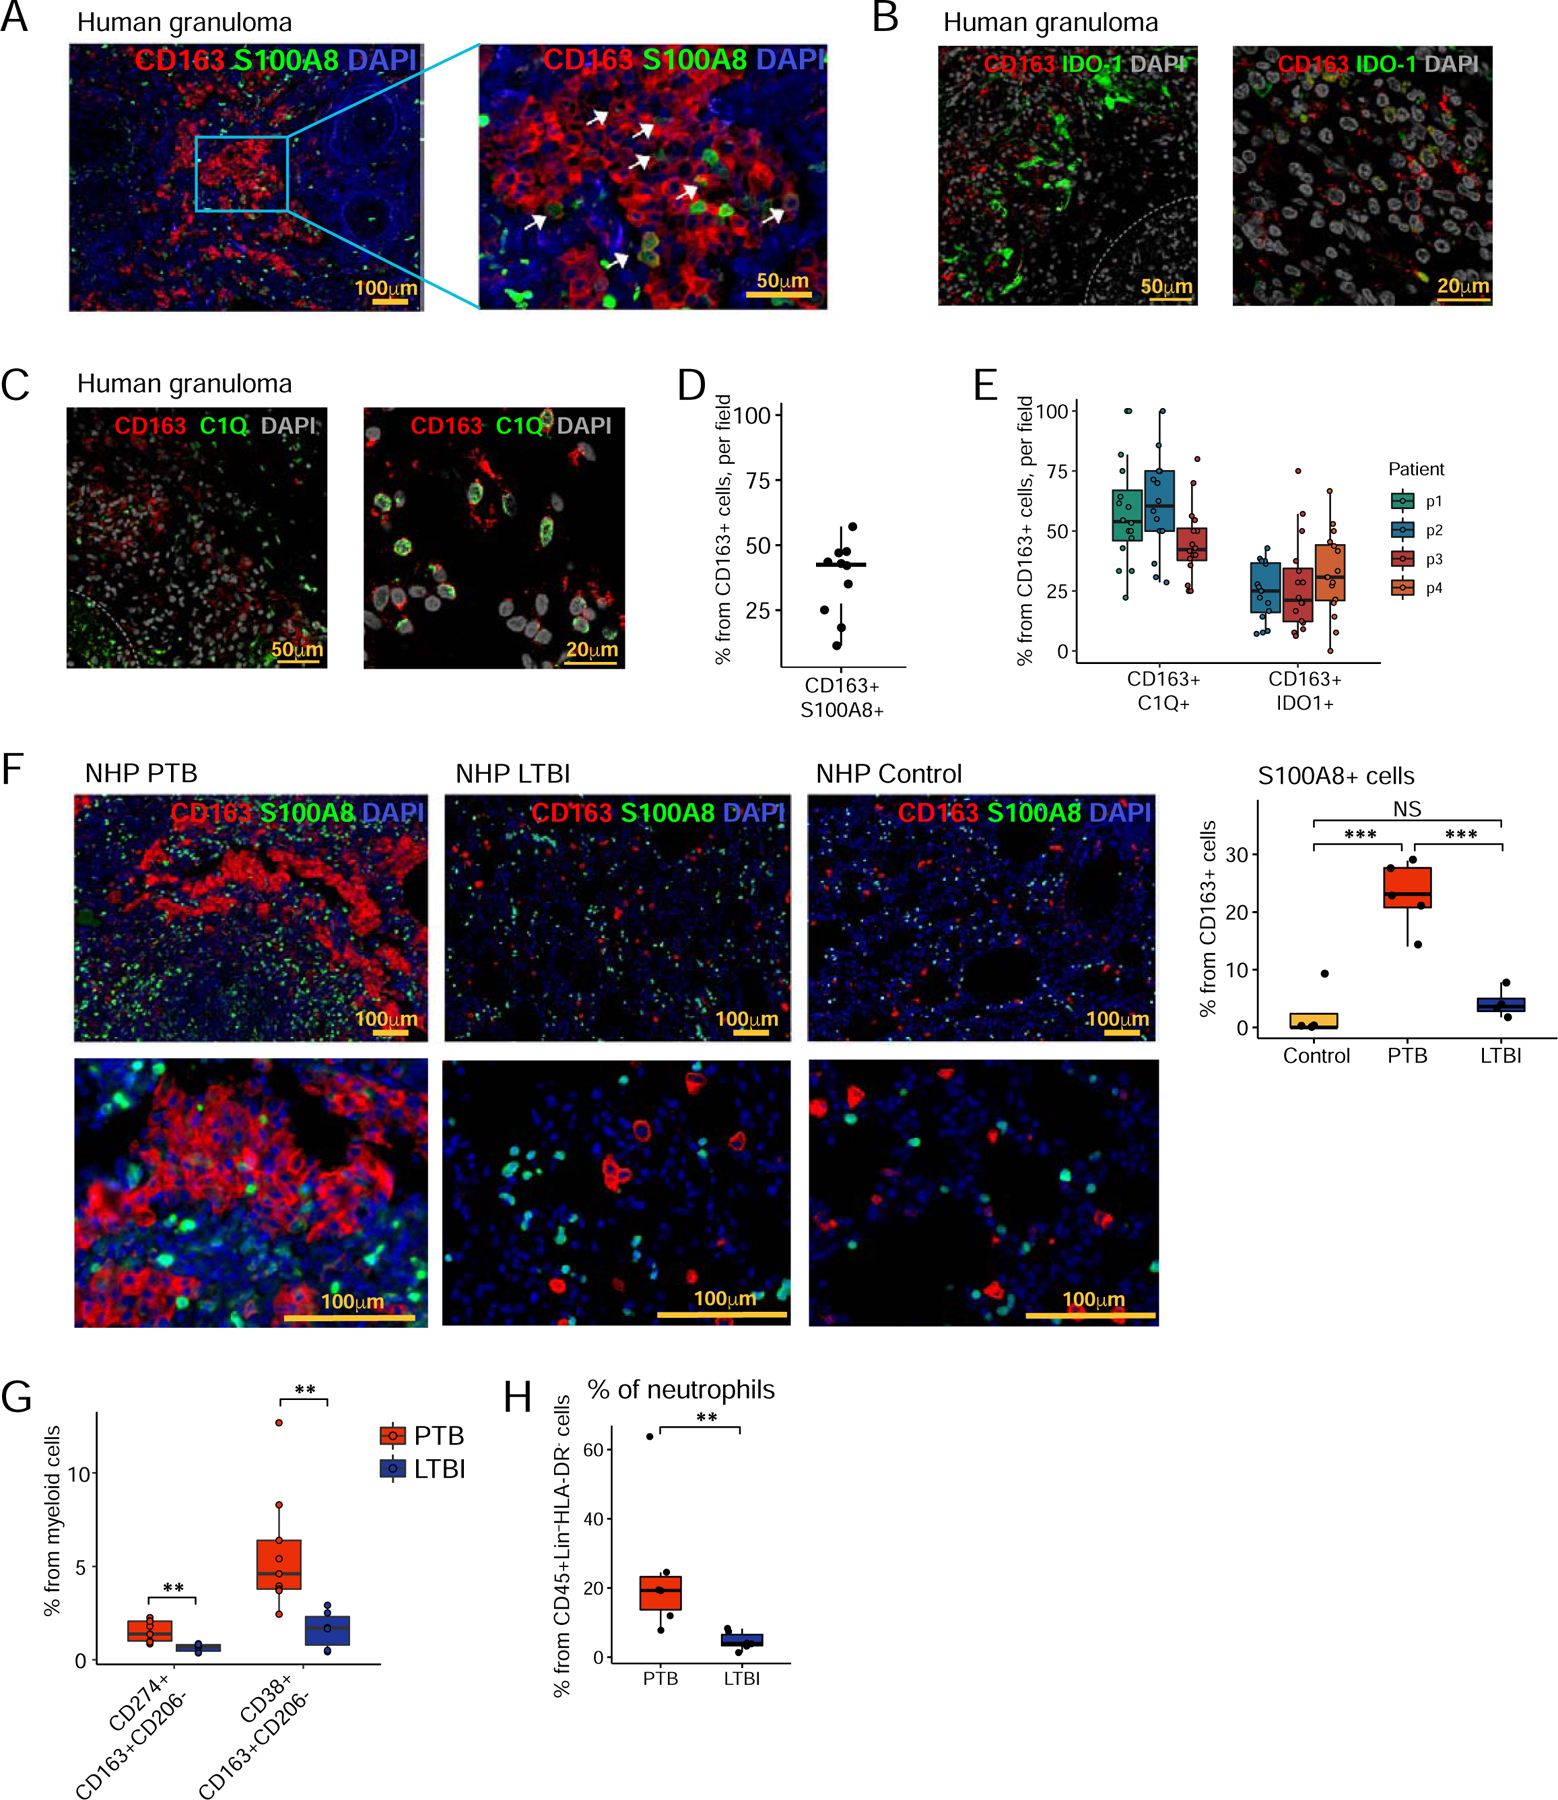
Tuberculosis (TB), caused by Mycobacterium tuberculosis (Mtb) latently infects approximately one-fourth of the world's population. The immune mechanisms that govern progression from latent (LTBI) to active pulmonary TB (PTB) remain poorly defined. Experimentally Mtb-infected non-human primates (NHP) mirror the disease observed in humans and recapitulate both PTB and LTBI. We characterized the lung immune landscape in NHPs with LTBI and PTB using high-throughput technologies. Three defining features of PTB in macaque lungs include the influx of plasmacytoid dendritic cells (pDCs), an Interferon (IFN)-responsive macrophage population, and activated T cell responses. In contrast, a CD27+ Natural killer (NK) cell subset accumulated in the lungs of LTBI macaques. This NK cell population was also detected in the circulation of LTBI individuals. This comprehensive analysis of the lung immune landscape will improve the understanding of TB immunopathogenesis, providing potential targets for therapies and vaccines for TB control.

Keywords: NK cells; granulomas; immune protection; lung; pDCs; single cell technologies; tuberculosis; type I IFNs.


Conflict of interest statement

Declaration of interests The authors declare no competing interests.

Figures

Figure 1.
Figure 1.. Study outline of rhesus macaques with LTBI and PTB.
A. Single cell suspensions of lung biopsy from uninfected rhesus macaques (control), macaques with PTB at terminal end-point, or LTBI at 6 months were subjected to scRNA-seq or CyTOF analysis as described in STAR methods. B. Clinical correlates of infection including changes in the percentage of body weight, changes in serum CRP (mg/dL) levels, and post-necropsy percent of lung pathology in Mtb-infected LTBI and PTB macaques. Data represented as mean ± SD, **p < 0.01, unpaired Student’s T-test. C-D. UMAP plots of cells from all scRNA-seq samples together, colored according to (C) lymphoid/myeloid classification or (D) cell types. Control, n=3; PTB, n=5; LTBI, n=2. E. Proportion of each cell type across samples. F. UMAP plots with the expression of markers, characterizing main immune populations. See also Fig S1, Table S1 and Table S2.
Figure 2.
Figure 2.. Lung lymphoid cell dynamics in macaques with LTBI and PTB by scRNA-seq describe the presence of activated T cells in PTB.
Control, n=3; PTB, n=5; LTBI, n=2. A. UMAP plot of lymphoid cells across all samples, colored according to identified clusters. B. UMAP plots with the expression of markers, characterizing main lymphoid populations. C. Heatmap of normalized expression of selected genes in each lymphoid cluster per condition. Only sample-cluster combinations that contain more than 2% of cells from the corresponding sample are included. D. UMAP plots of mean gene expression from Th1, Th17, and activation signatures, split by condition. E. Cell proportion of each cluster per condition per sample. See also Fig S2.
Figure 3.
Figure 3.. Lung myeloid cell dynamics in macaques with LTBI and PTB by scRNA-seq describe the presence of pDCs and IFN-responsive macrophage population.
Control, n=3; PTB, n=5; LTBI, n=2. A. UMAP plot of myeloid cells across all samples, colored according to identified clusters. B. UMAP plots with the expression of markers, characterizing main myeloid populations in macaques. C. Heatmap of normalized expression of selected genes in each myeloid cluster per condition. D. Cell proportion of each cluster per condition. E. UMAP plots of mean expression for the genes from the “Hallmark Interferon Gamma Response” pathway split by the condition. F. Heatmap of normalized expression of genes, enriched in pDC population, per sample per condition. See also Fig S3.
Figure 4.
Figure 4.. CyTOF and flow profiling of lymphoid cells validates the presence of lung NK cells in LTBI macaques and circulating NK cells in individuals with LTBI.
A. tSNE plots of lymphoid cells across all samples, colored according to identified clusters. Control, n=3; PTB, n=5; LTBI, n=3. B. MDS projection for all CyTOF samples, colored by the condition. For each sample / mean marker expression was used to perform MDS. C. tSNE plots with the expression of all markers used to perform tSNE and identify clusters for lymphoid cells. D. Cell proportion of each cluster per sample per condition. E. tSNE plots with the expression of CD27 marker by the condition. F. Percentage of NK cells as determined by flow cytometry in PBMCs from LTBI (n=11) and PTB (n=25) patients. G. Percentage of CD27+ NK cells as determined by flow cytometry in PBMCs from LTBI (n=11) and PTB (n=25) patients. H. Relative expression of CD27+ in NK cells in terms of mean fluorescence intensity (MFI) in PBMCs from LTBI (n=11) and PTB (n=25) patients by flow cytometry. I. Percentage of CD27+ NK cells from healthy controls (HC, n=5), LTBI (n=5), and PTB patients (n=5) before and after in vitro stimulation with Mtb cell wall protein. J-M. mRNA expression of IL22 (J), IFNG (K), GZMB (L), and PRF1 (M) relative to GADPH in the purified CD27+ NK cells from HC (n=3) and LTBI (n=3) were quantified by RT–PCR. N. Formalin-fixed paraffin embedded sections from macaque lung (control; n=3, PTB: n=3 and LTBI; n=3) were stained with NKG2a, CD3, CD20, CD14, CD66abce and DAPI and the morphometrical quantification of NKG2a+ CD3, CD20, CD14 cells across samples. Data represented as mean ± SD, *p < 0.05, **p < 0.01, ***p < 0.001, NS = not significant, either by unpaired Student’s T-test (F-H, K-M), by Student’s T-test with Holm correction (I) or by one-way ANOVA with Tukey post-hoc test (N). See also Fig S4 and Table S3.
Figure 5.
Figure 5.. CyTOF and flow cytometry profiling of myeloid cells validates the accumulation of pDCs in macaque lungs with PTB.
A. tSNE plots of myeloid cells across all samples, colored according to identified clusters. Control, n=3; PTB, n=5; LTBI, n=3. B. MDS projection of CyTOF samples, colored by the condition. For each sample, mean marker expression was used to perform MDS. C. tSNE plots with the expression of all markers used to perform tSNE and identify clusters for myeloid cells. D. Cell proportion of each cluster per condition. E and F. Immunohistochemistry staining of CD123, HLA-DR, and DAPI on formalin-fixed paraffin-embedded sections from macaque lung (control; n=4, PTB: n=6 and LTBI; n=4) and human tissues (tonsils, n=3 and lung tissue from individuals with PTB, n=6). The right panel displays the morphometrical quantification of CD123+HLA-DR+ cell numbers across subjects. G. Percentage of pDC in lung single cell suspension from PTB (n=9) and LTBI (n=6) macaques by flow cytometry. H-J. Percentage of pDC (H), classical (I) and non-classical (J) monocytes in PBMCs from control (n=4), PTB (n=9) and LTBI (n=6) macaques by flow cytometry. K. Percentage of pDC was determined in PBMCs from HC (n=11), LTBI (n=17) and PTB (n=16) patients by flow cytometry. Data represented as mean ± SD, *p < 0.05, **p < 0.01, ***p < 0.001, NS = not significant, either by unpaired Student’s T-test (F, G) or by one-way ANOVA with Tukey post-hoc test (E, H-K). See also Fig S4 and S5.
Figure 6.
Figure 6.. IFN-responsive macrophages are present within granuloma structures in humans and macaques during PTB.
A - C. Immunohistochemistry staining of CD163 and S100A8 (A), CD163 and IDO-1 (B), CD163 and C1Q (C), and DAPI on formalin-fixed paraffin-embedded sections from human lung tissue with PTB, (n=3–4). D. Morphometrical quantification of CD163+S100A8+ cells from a human TB granuloma. N=10 granulomas/patient. Data represented as mean ± SD. E. Morphometrical quantification of CD163+IDO-1+ and CD163+C1Q+ cells from human TB granulomas. Data represented as mean ± SD. F. Immunohistochemistry staining of CD163, S1008, and DAPI on formalin-fixed paraffin-embedded sections from macaque lung (control; n=4, PTB: n=6 and LTBI; n=4). Right panel display morphometrical quantification of CD163+S100A8+ cells across subjects. Data represented as mean ± SD, NS = not significant. ***p < 0.001, by one-way ANOVA with Tukey post-hoc test. G and H. Percentage of CD163+CD206CD274+, CD163+CD206CD38+ cells and neutrophils (CD45+LinHLADR) were determined by flow cytometry in lung single cell suspension from PTB (n=6–9) and LTBI (n=6) macaque. Data represented as mean ± SD, **p < 0.01, by Student’s T-test with Holm correction (F) or by Student’s T test (G). See also Fig S5.

Comment in

References

    1. (WHO), W.H.O. (2018). Global tuberculosis report 2018. https://wwwwhoint/tb/publications/global_report/en/.
    1. Ahmed M, Thirunavukkarasu S, Rosa BA, Thomas KA, Das S, Rangel-Moreno J, Lu L, Mehra S, Mbandi SK, Thackray LB, et al. (2020). Immune correlates of tuberculosis disease and risk translate across species. Sci Transl Med 12, eaay0233. - PMC - PubMed
    1. Amir el AD, Davis KL, Tadmor MD, Simonds EF, Levine JH, Bendall SC, Shenfeld DK, Krishnaswamy S, Nolan GP, and Pe’er D (2013). viSNE enables visualization of high dimensional single-cell data and reveals phenotypic heterogeneity of leukemia. Nat Biotechnol 31, 545–552. - PMC - PubMed
    1. Antonelli LR, Gigliotti Rothfuchs A, Goncalves R, Roffe E, Cheever AW, Bafica A, Salazar AM, Feng CG, and Sher A (2010). Intranasal Poly-IC treatment exacerbates tuberculosis in mice through the pulmonary recruitment of a pathogen-permissive monocyte/macrophage population. J Clin Invest 120, 1674–1682. - PMC - PubMed
    1. Bafica A, Scanga C, Feng C, Leifer C, Cheever A, and Sher A (2005). TLR9 regulates Th1 responses and cooperates with TLR2 in mediating optimal resistance to Mycobacterium tuberculosis. J Exp Med 202, 1715–1724. - PMC - PubMed

Publication types