. 2021 Jan 21;81(2):386-397.e7.
doi: 10.1016/j.molcel.2020.11.027. Epub 2020 Dec 18.

In Vivo Evidence for Serine Biosynthesis-Defined Sensitivity of Lung Metastasis, but Not of Primary Breast Tumors, to mTORC1 Inhibition

Affiliations

In Vivo Evidence for Serine Biosynthesis-Defined Sensitivity of Lung Metastasis, but Not of Primary Breast Tumors, to mTORC1 Inhibition

Gianmarco Rinaldi et al. Mol Cell. .

Abstract

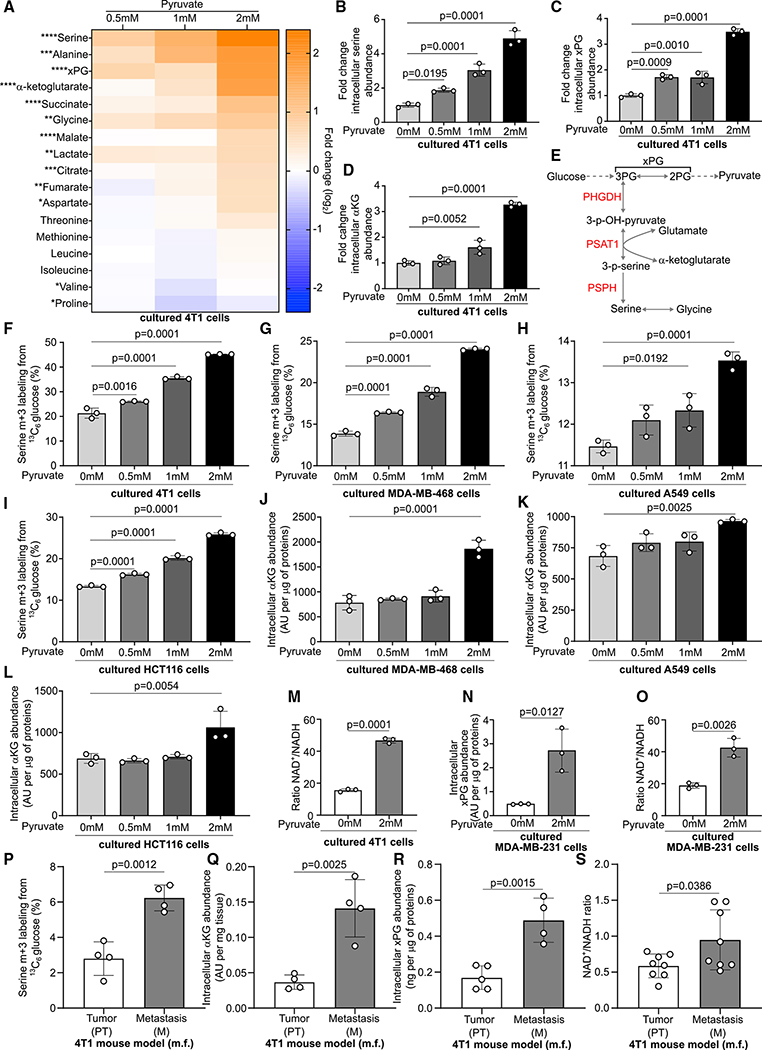
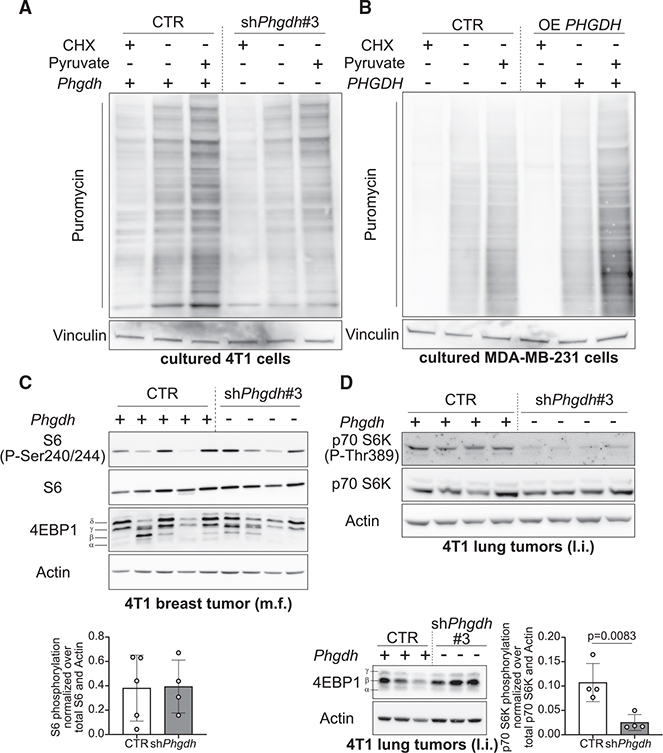
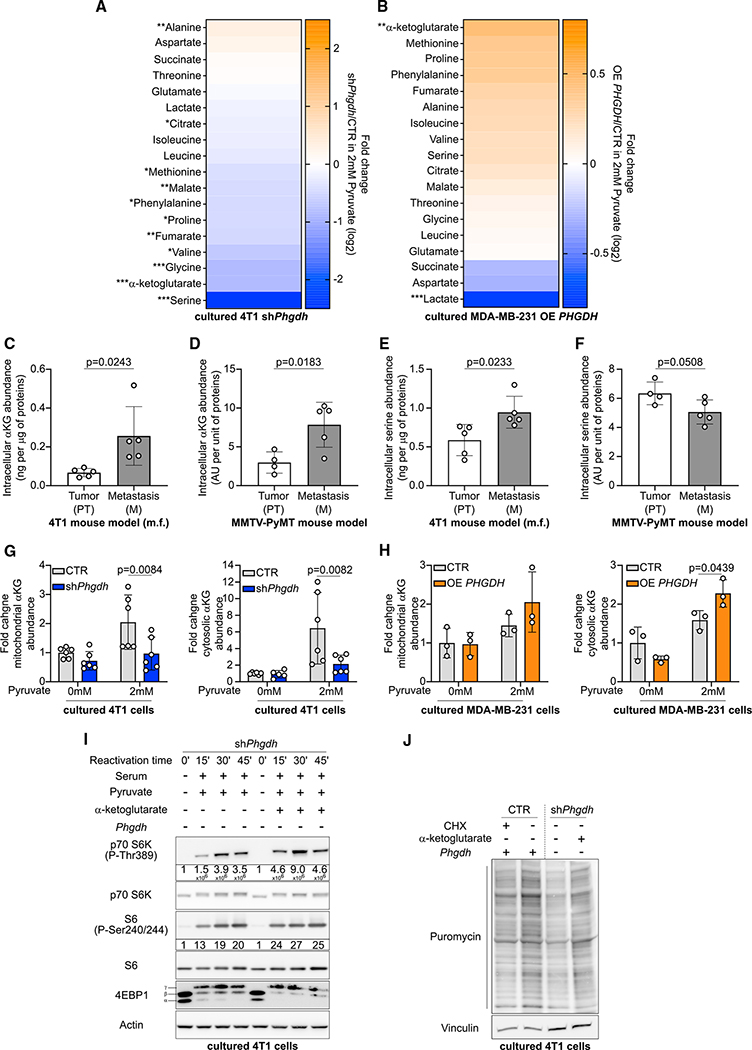
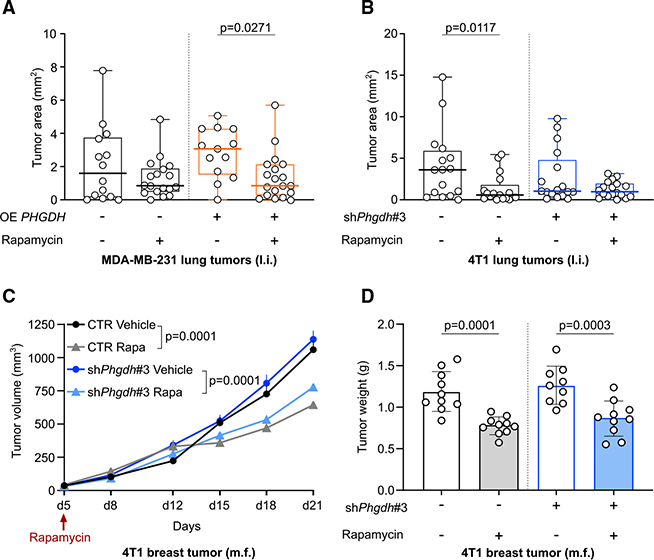
In tumors, nutrient availability and metabolism are known to be important modulators of growth signaling. However, it remains elusive whether cancer cells that are growing out in the metastatic niche rely on the same nutrients and metabolic pathways to activate growth signaling as cancer cells within the primary tumor. We discovered that breast-cancer-derived lung metastases, but not the corresponding primary breast tumors, use the serine biosynthesis pathway to support mTORC1 growth signaling. Mechanistically, pyruvate uptake through Mct2 supported mTORC1 signaling by fueling serine biosynthesis-derived α-ketoglutarate production in breast-cancer-derived lung metastases. Consequently, expression of the serine biosynthesis enzyme PHGDH was required for sensitivity to the mTORC1 inhibitor rapamycin in breast-cancer-derived lung tumors, but not in primary breast tumors. In summary, we provide in vivo evidence that the metabolic and nutrient requirements to activate growth signaling differ between the lung metastatic niche and the primary breast cancer site.

Keywords: MCT2; PHGDH; breast cancer; lung environment; mTORC1; metastasis formation; pyruvate; serine biosynthesis; α-ketoglutarate.


Conflict of interest statement

Declaration of Interests S.-M.F. has received funding from Bayer AG, Merck, and Black Belt Therapeutics; has consulted for Fund+; and serves on the advisory board of Molecular Cell. All other authors declare no competing interests.

Figures

Figure 1.
Figure 1.. Pyruvate Supports mTORC1 Signaling in Lung Metastases
(A) Phosphorylation of mTORC1 targets S6 and 4EBP1 in the lung (L), primary tumor (PT), and metastasis (M) of BALB/c mice injected with 4T1 cells in the mammary fat pad (m.f.). n = 4. (B) Protein quantification of S6 (P-Ser240/244) and 4EBP1 (P-Ser65) shown in (A). Data are presented as fold changes compared with PT levels. Data are normalized on actin and the respective band for total protein. Tissues from 4 additional mice were run on a second western blot (Figure S1A), and the quantification of S6 (P-Ser240/244) was included in the graph. Two-tailed unpaired Student’s t test. S6, n = 8; 4EBP1, n = 4. (C) mTORC1 activity based on a publicly available phosphoproteomics dataset in human M compared with matched PT from 5 patients. (D and E) Correlation of GLUT1, MCT2, ASCT2, SCL7A2, and SLC7A1 gene expression with mTOR activity as measured by a sum score of the phosphotargets by reverse phase protein assay (RPPA) protein level. Samples were divided in quartiles, with the 1st quartile comprising all samples with the lowest mTOR activity and the 4th quartile comprising all samples with the highest mTOR activity. Data are normalized to the average gene expression calculated for the 1st quartile. Two-sided Mann-Whitney test. n = 859. (F) Concentration of glucose in the interstitial fluid and in the blood plasma of BALB/c mice. Two-tailed unpaired Student’s t test. Lung interstitial fluid, n = 4; blood plasma, n = 10. (G) Total protein synthesis in the presence or absence of 2 mM pyruvate and puromycin (10 μg/mL) in 4T1 cells based on the incorporation of puromycin into newly synthesized proteins. 4T1 cells were starved from serum for 16 h, starved in Hank’s balanced salt solution (HBSS) for 1 h, and subsequently reactivated (30 min) in serum containing culture medium with or without 2 mM sodium pyruvate. The protein synthesis inhibitor cycloheximide (CHX, 100 nM) was used as negative control (CTR). One representative image is shown. n = 3. (H) Concentration of pyruvate in the interstitial fluid of lung samples collected from human patients and BALB/c mice. Two-tailed unpaired Student’s t test. Human, n = 7; mouse, n = 5. (I and J) Phosphorylation of the mTORC1 targets S6 and 4EBP1 in 4T1 PT and lung M upon acute inhibition of pyruvate uptake using the MCT2 inhibitor α-cyano-4-hydroxycinnamic acid (60 mg/kg i.p.). 4EBP1 phosphorylation increases from the α to the γ (δ) band. Quantification of phospho-S6 is shown in the graph. Data are normalized on total S6 and actin and are shown as fold changes compared with the group of mice treated with the vehicle. Two-tailed unpaired Student’s t test. n = 6. Error bars represent SD (B, F, and H–J) and SEM (D and E) from the mean of biologically independent samples.
Figure 2.
Figure 2.. Pyruvate Activates De Novo Serine Biosynthesis
(A) Heatmap representing metabolite abundance changes upon supplementation of different concentrations of sodium pyruvate to the culture medium of 4T1 cells after 24 h of incubation. Data represent the fold changes compared with the no-pyruvate condition. One-way ANOVA. n = 3. Asterisks represent statistical significance as follows: *p ≤ 0.05, **p ≤ 0.01, ***p ≤ 0.001, ****p ≤ 0.0001. (B–D) Fold changes of serine, α-ketoglutarate, and x-phosphoglycerate (xPG) (3-phosphoglycerate [3PG] and 2-phosphoglycerate [2PG]) extracted from the heatmap in (A). One-way ANOVA with Dunnett’s multiple comparison test (comparison between 0 mM conditions and all others). n = 3. (E) Schematic representation of the de novo serine biosynthesis pathway branching from glycolysis at the level of 3PG. Black, metabolites; red. enzymes of serine biosynthesis. (F–I) Activation of de novo serine biosynthesis assessed through measurement of serine m+3 labeling enrichment after incubation of 4T1, MDA-MB-468, A549, and HCT116 cells for 24 h in culture medium containing 13C6 glucose and increasing concentrations of sodium pyruvate. One-way ANOVA with Dunnett’s multiple comparison test (comparison between the 0 mM conditions and all others). n = 3. (J–L) Intracellular levels of α-ketoglutarate in MDA-MB-468, A549, and HCT116 cells incubated for 24 h in culture medium containing increasing concentrations of sodium pyruvate. One-way ANOVA with Dunnett’s multiple comparison test (comparison between 0 mM conditions and all others). n = 3. (M–O) Intracellular xPG abundance and NAD+/NADH ratio in 4T1 and MDA-MB-231 cells incubated for 24 h in medium without or with 2 mM sodium pyruvate. Two-tailed unpaired Student’s t test. n = 3. (P–S) Activation of de novo serine biosynthesis, α-ketoglutarate, and xPG abundance, NAD+/NADH ratio in 4T1 PT and lung M. De novo serine synthesis was assessed through measurement of serine m+3 labeling enrichment after a 6 h infusion of 13C6 glucose to tumor harboring BALB/c mice. Two-tailed unpaired Student’s t test. Serine synthesis and α-ketoglutarate (α KG) levels, n = 4; xPG PT, n = 5; xPG M, n = 4; NAD+/NADH, n = 8. All error bars represent SD from the mean of biologically independent samples or mice.
Figure 3.
Figure 3.. Serine Biosynthesis Potentiates mTORC1 Signaling in Lung M
(A and B) Total protein synthesis in the presence or absence of 2 mM pyruvate in 4T1 CTR or Phgdh-silenced (shPhgdh) or MDA-MB-231 CTR or OE PHGDH cells based on the incorporation of puromycin (10 μg/mL) into newly synthesized proteins. Cells were starved from serum for 16 h, starved in HBSS for 1 h, and subsequently reactivated (30 min) in serum containing culture medium with or without 2 mM sodium pyruvate. The protein synthesis inhibitor CHX (100 nM) was used as negative CTR. One representative image is shown. n = 3. (C) Phosphorylation of mTORC1 targets S6 and 4EBP1 in 4T1 PT. Quantification of phospho-S6 is shown in the graph. Data are normalized on total p70 S6K and actin and are shown as fold changes compared with the CTR group. Two-tailed unpaired Student’s t test. 4T1 CTR n = 5, 4T1 shPhgdh n= 4. (D) Phosphorylation of the mTORC1 targets p70 S6K and 4EBP1 in 4T1 CTR or shPhgdh breast-cancer-derived lung tumors. l.i. refers to lung injection into NMRI nu/nu mice. Quantification of phospho-p70 S6K is shown in the graph. Data are normalized on total p70 S6K and actin. Two-tailed unpaired Student’s t test. n = 4. Error bars represent SD from the mean of biologically independent mice.
Figure 4.
Figure 4.. α-Ketoglutarate Produced by the Serine Biosynthesis Pathway Supports mTORC1 Signaling
(A and B) Heatmap representing metabolite abundance changes in 4T1 shPhgdh cells or MDA-MB-231 OE PHGDH cells compared with the respective CTR cells in culture media containing 2 mM of sodium pyruvate. Two-tailed unpaired Student’s t test. n = 3. Asterisks represent statistical significance as follows: *p ≤ 0.05, **p ≤ 0.01, ***p ≤ 0.001, ****p ≤ 0.0001. (C–F) Intracellular α-ketoglutarate and serine abundance in 4T1 or PyMT PT and lung M. Two-tailed unpaired Student’s t test. n = 5 for the 4T1 model, n = 4 for the PT group of the PyMT model, n = 5 for the M group of the MMTV-PyMT model. (G and H) Mitochondrial and cytosolic α-ketoglutarate abundance in 4T1 CTR or shPhgdh cells, as well as MDA-MB-231 CTR or OE PHGDH cells after 24 h of incubation with culture medium with or without 2 mM sodium pyruvate. 40 μg/mL (4T1 cells) or 25 μg/mL (MDA-MB-231) digitonin treatment of 2 min was used to permeabilize the cells and separate the cytosolic fraction from the mitochondrial fraction. Two-way ANOVA with Sidak’s multiple comparison test (comparison between CTR and shPhgdh or OE PHGDH). 4T1, n = 6; MDA-MB-231, n = 3. (I) Phosphorylation of mTORC1 targets p70 S6K, S6, and 4EBP1 in the presence or absence of 1 mM α-ketoglutarate in 4T1 shPhgdh cells. 4T1 cells were starved for 16 h of serum, starved in HBSS for 1 h, and subsequently reactivated (from 15 to 45 min) in serum and 2 mM sodium pyruvate containing culture medium with and without 1 mM α-ketoglutarate. Protein quantification of phosho-p70 S6K and phospho-S6 is shown below the immunoblot. Data are normalized on total p70 S6K or S6 protein and actin and are shown as fold changes compared with time 0. One representative image is shown. n = 3. (J) Total protein synthesis in the presence or absence of 1 mM α-ketoglutarate and puromycin in 4T1 CTR or shPhgdh cells based on the incorporation of puromycin into newly synthesized proteins. 4T1 cells were starved from serum for 16 h, starved in HBSS for 1 h, and subsequently reactivated (30 min) in serum containing culture medium with or without 1 mM α-ketoglutarate. The protein synthesis inhibitor CHX (100 nM) was used as negative CTR. One representative image is shown. n = 3. Error bars represent SD from the mean of biologically independent samples.
Figure 5.
Figure 5.. Serine Biosynthesis Defines Rapamycin Sensitivity of Lung M
(A) MDA-MB-231 lung tumor area in NMRI nu/nu mice treated with rapamycin (1 mg/kg i.p. every 2 days, starting 9 days after tumor initiation) based on H&E staining. The thick black or orange line represents the median. The box extends from the 25th to 75th percentile, and the whisker extends from the minimum to the maximum value. Two-way ANOVA with Sidak’s multiple comparison test. MDA-MB-231 CTR vehicle, n = 14; MDA-MB-231 CTR rapamycin, n = 18;, MDA-MB-231 OE PHGDH vehicle, n = 13; MDA-MB-231 OE PHGDH rapamycin, n = 19. (B) 4T1 lung tumor area in NMRI nu/nu mice treated with rapamycin (1 mg/kg i.p. every two days, starting the day after tumor initiation) based on H&E staining. The thick black or blue line represents the median. The box extends from the 25th to 75th percentile, and the whisker extends from the minimum to the maximum value. Two-way ANOVA with Sidak’s multiple comparison test. 4T1 CTR vehicle, n = 16; 4T1 CTR rapamycin, n = 17; 4T1 shPHGDH vehicle, n = 17; 4T1 shPHGDH rapamycin, n = 18. (C) 4T1 PT volume in NMRI nu/nu mice treated with rapamycin (1 mg/kg i.p. every 2 days, starting 5 days after tumor initiation). Two-way ANOVA with Sidak’s multiple comparison test on the tumor volumes measured on the last day (day 21). n = 10. (D) 4T1 PT weight in NMRI nu/nu mice treated with rapamycin (1 mg/kg i.p. every 2 days, starting 5 days after tumor initiation). Two-way ANOVA with Sidak’s multiple comparison test. n = 9 for the shPhgdh group treated with vehicle, n = 10 for the other groups. Error bars represent SEM (C) and SD (D) from the mean of biologically independent samples.

Comment in

References

    1. Ben-Sahra I, and Manning BD (2017). mTORC1 signaling and the metabolic control of cell growth. Curr. Opin. Cell Biol. 45, 72–82. - PMC - PubMed
    1. Altea-Manzano P, Broekaert D, Duarte JAG, Ferná ndez-García J, Planque M, and Fendt S-M (2020). Analyzing the Metabolism of Metastases in Mice. Methods Mol. Biol. 2088, 93–118. - PubMed
    1. Ben-Sahra I, Hoxhaj G, Ricoult SJH, Asara JM, and Manning BD (2016). mTORC1 induces purine synthesis through control of the mitochondrial tetrahydrofolate cycle. Science 351, 728–733. - PMC - PubMed
    1. Bernfeld E, Menon D, Vaghela V, Zerin I, Faruque P, Frias MA, and Foster DA (2018). Phospholipase D-dependent mTOR complex 1 (mTORC1) activation by glutamine. J. Biol. Chem. 293, 16390–16401. - PMC - PubMed
    1. Bligh EG, and Dyer WJ (1959). A rapid method of total lipid extraction and purification. Can. J. Biochem. Physiol. 37, 911–917. - PubMed

Publication types

MeSH terms