. 2021;11(4):1139-1161.
doi: 10.1016/j.jcmgh.2020.12.007. Epub 2020 Dec 16.

Single-Cell Transcriptomics Reveals Zone-Specific Alterations of Liver Sinusoidal Endothelial Cells in Cirrhosis

Affiliations

Single-Cell Transcriptomics Reveals Zone-Specific Alterations of Liver Sinusoidal Endothelial Cells in Cirrhosis

Tingting Su et al. Cell Mol Gastroenterol Hepatol. 2021.

Abstract

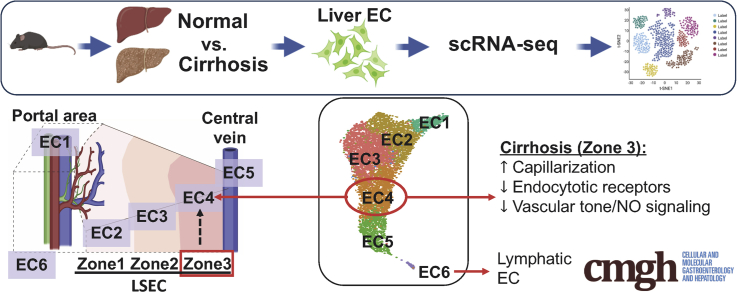
Background: Dysfunction of liver sinusoidal endothelial cells (LSECs) is permissive for the progression of liver fibrosis and cirrhosis and responsible for its clinical complications. Here, we have mapped the spatial distribution of heterogeneous liver ECs in normal vs cirrhotic mouse livers and identified zone-specific transcriptomic changes of LSECs associated with liver cirrhosis using scRNA-seq technology.

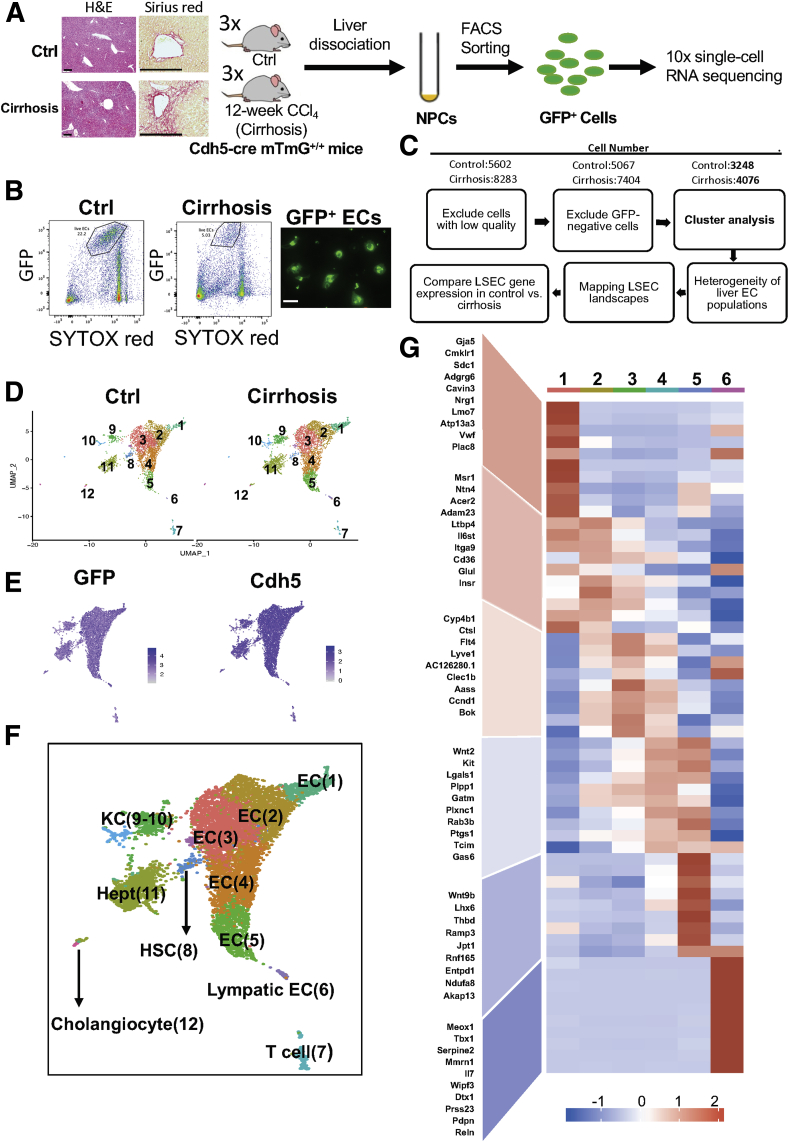
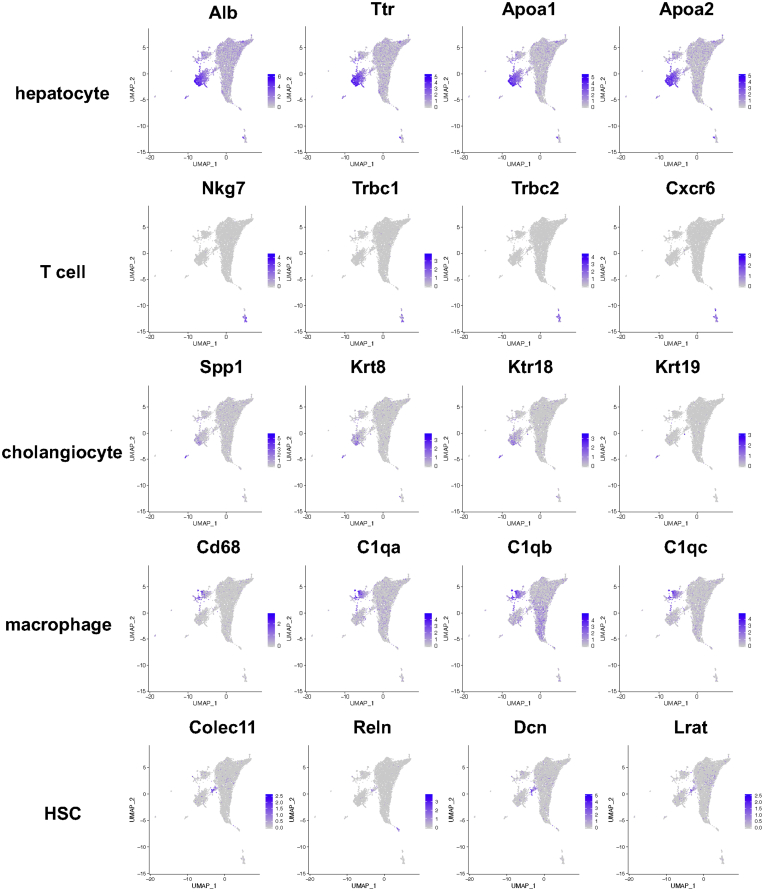
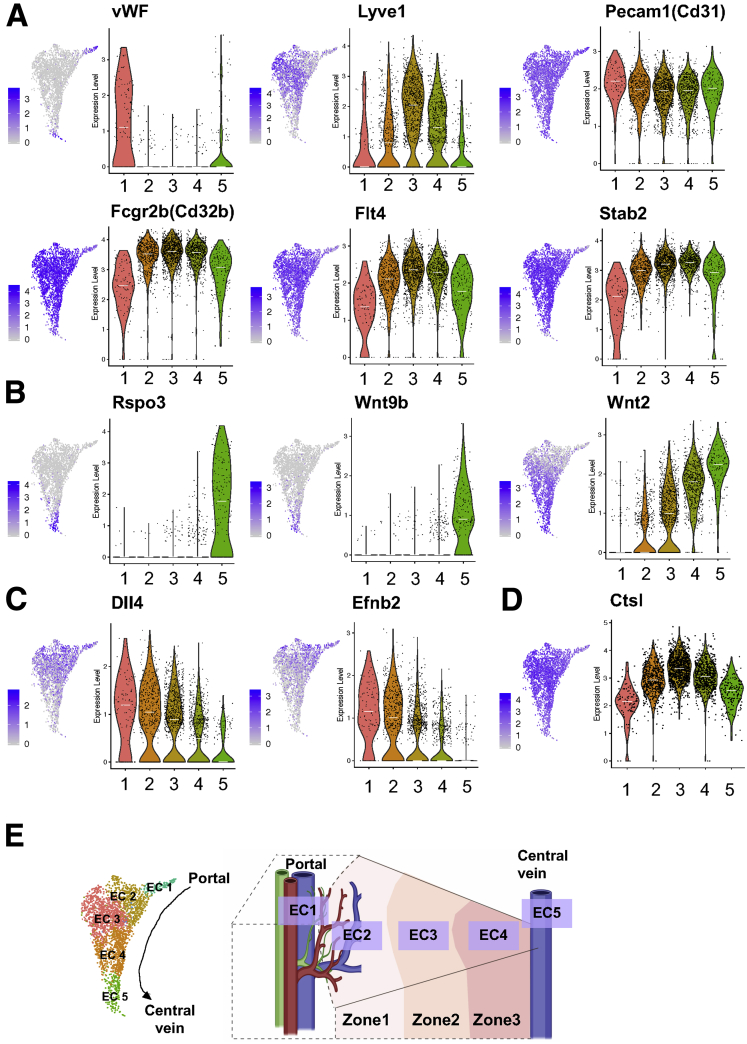
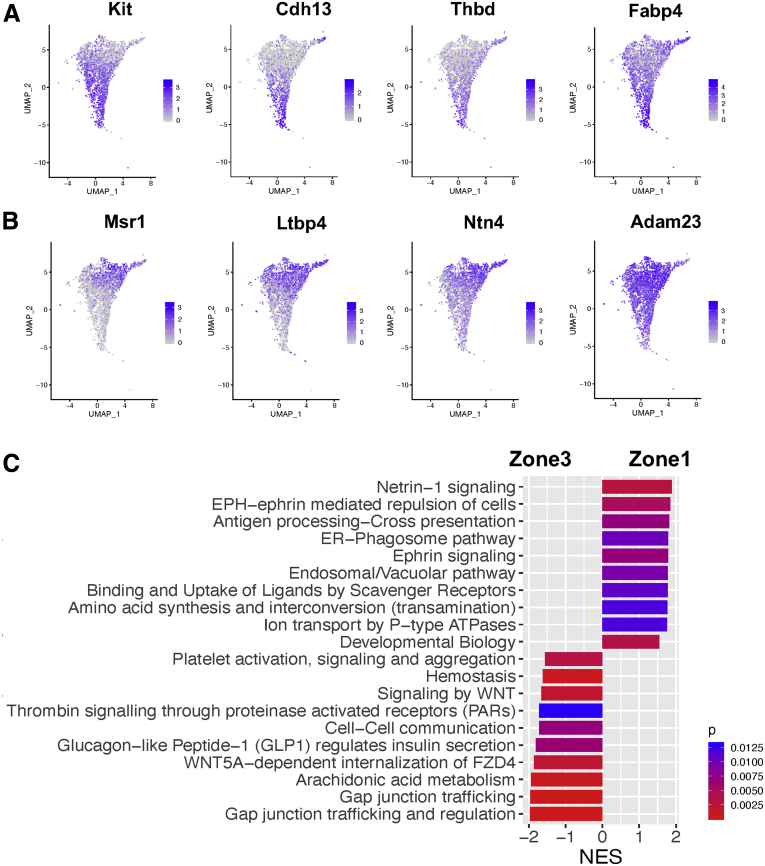
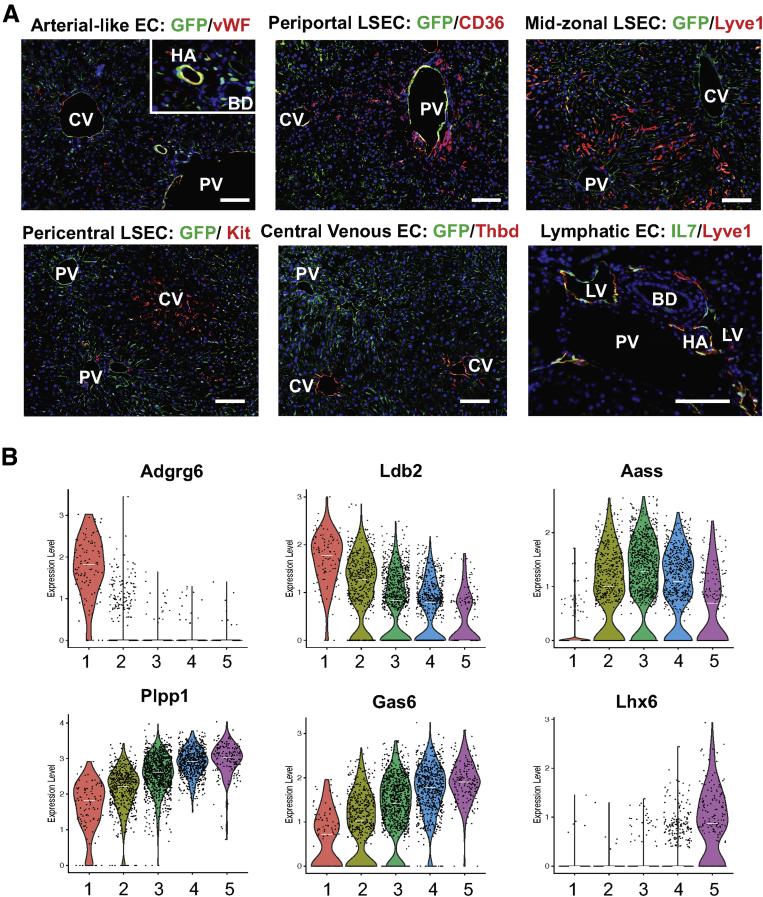
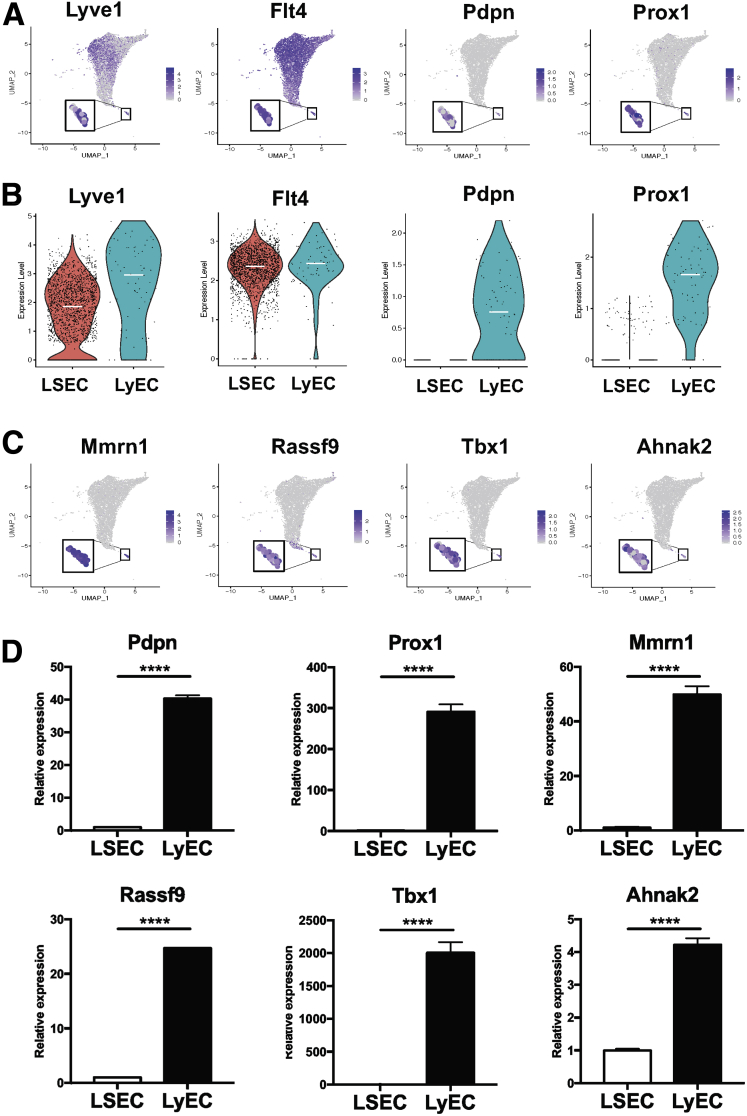
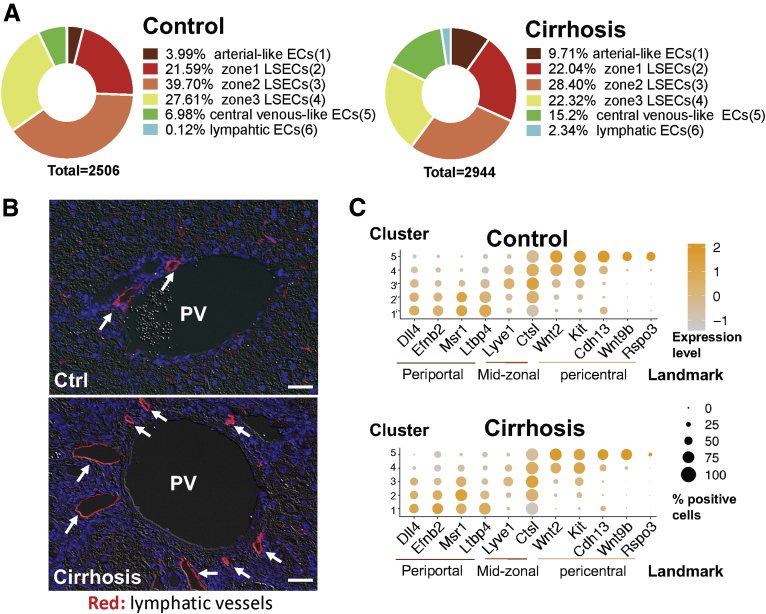
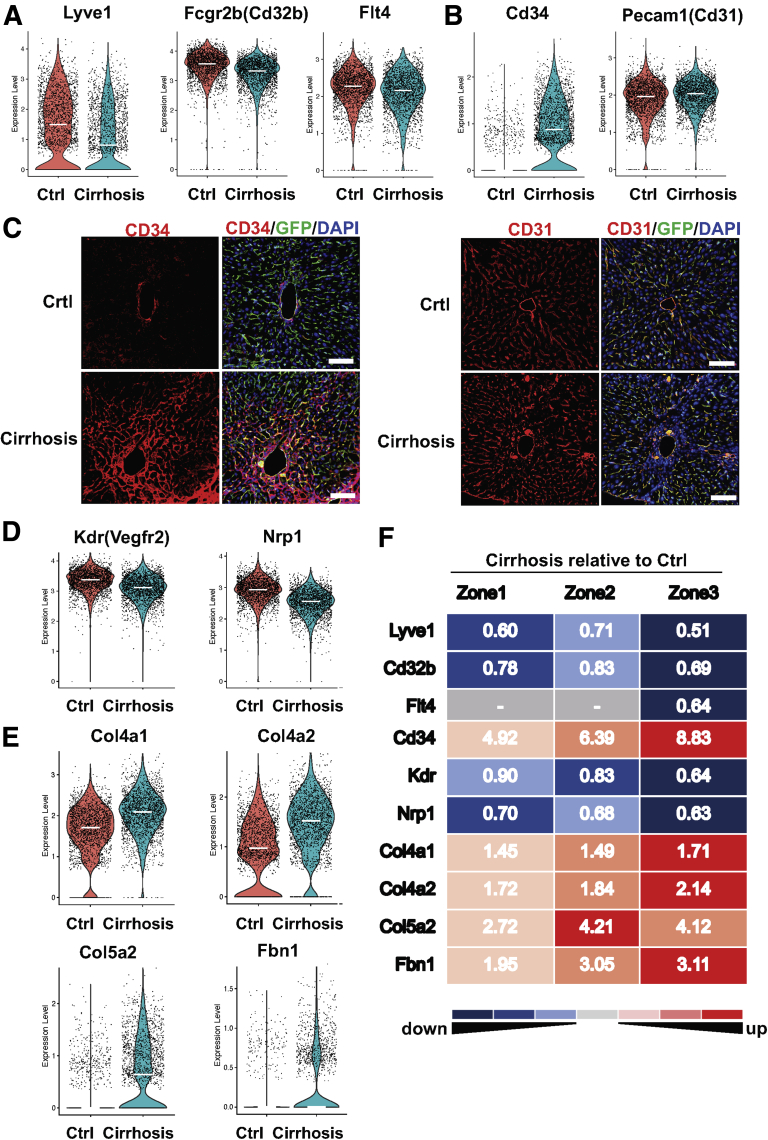
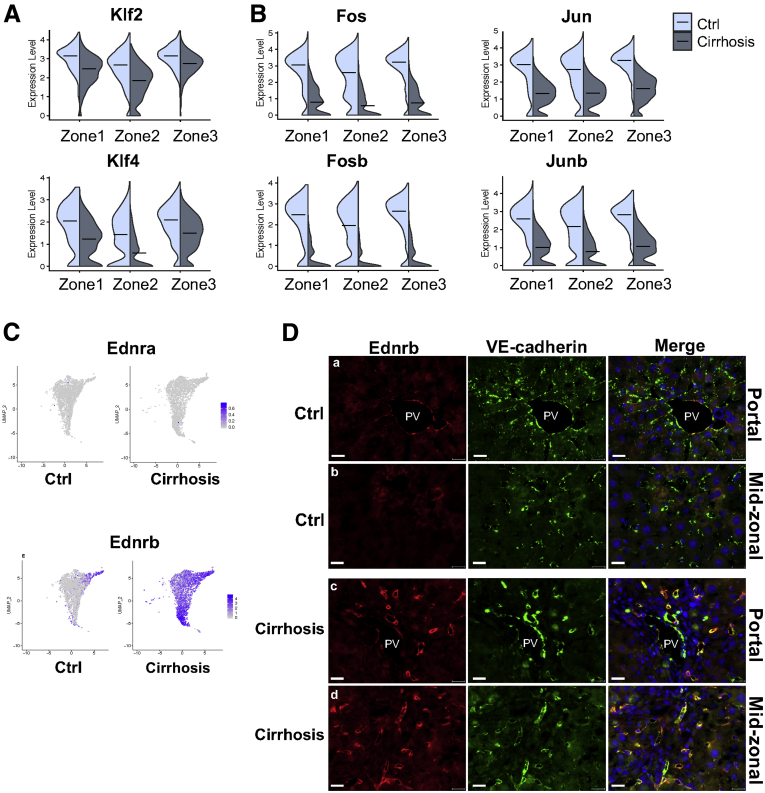
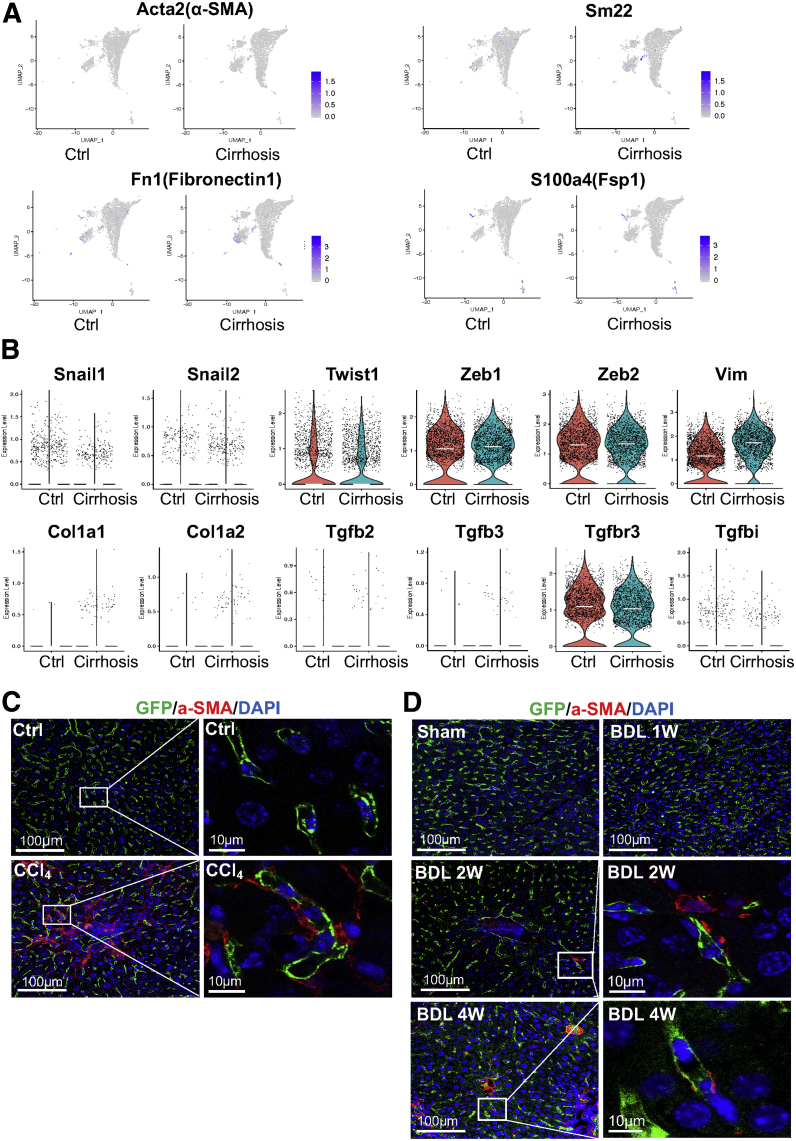
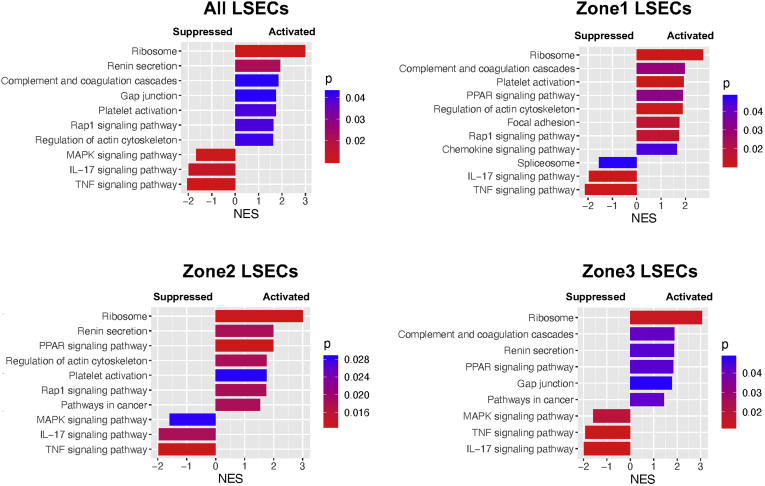
Approach & results: Cirrhosis was generated in endothelial specific green fluorescent protein (GFP) reporter mice through carbon tetrachloride inhalation for 12 weeks. GFP-positive liver EC populations were isolated from control and cirrhotic mice by FACS. We identified 6 clusters of liver EC populations including 3 clusters of LSECs, 2 clusters of vascular ECs and 1 cluster of lymphatic ECs. Based on previously reported LSEC-landmarks, we mapped the 3 clusters of LSECs in zones 1, 2, and 3, and determined phenotypic changes in each zone between control and cirrhotic mice. We found genes representing capillarization of LSECs (eg, CD34) as well as extracellular matrix genes were most upregulated in LSECs of zone 3 in cirrhotic mice, which may contribute to the development of basement membranes. LSECs in cirrhotic mice also demonstrated decreased expression of endocytic receptors, most remarkably in zone 3. Transcription factors (Klf2 [Kruppel-like factor-2], Klf4 [Kruppel-like factor-4], and AP-1) that induce nitric oxide production in response to shear stress were downregulated in LSECs of all zones in cirrhotic mice, implying increased intrahepatic vascular resistance.

Conclusion: This study deepens our knowledge of the pathogenesis of liver cirrhosis at a spatial, cell-specific level, which is indispensable for the development of novel therapeutic strategies to target the most dysfunctional liver ECs.

Keywords: Endothelial Dysfunction; Liver Fibrosis; Lymphatic Endothelial Cells; Portal Hypertension; scRNA-seq.


Figures

None
Graphical abstract
Figure 1
Figure 1
scRNA-seq revealed a landscape of sorted liver ECs. (A) Cell isolation workflow using endothelial-GFP reporter mice (tamoxifen inducible, cdh5-cre mTmG+/+ mice) subjected to carbon tetrachloride (CCl4) inhalation for 12 weeks to generate liver cirrhosis. Age-matched endothelial-GFP reporter mice were used as controls. Representative hematoxylin and eosin and Sirius red staining images to show liver injury and fibrotic nodules. Scale bars: 200 μm. (B) Nonparenchymal cells isolated from endothelial-GFP reporter mice were sorted to collect viable GFP-positive cells (ie, ECs). SYTOX red staining was used to exclude dead cells (SYTOX red–positive cells, left 2 panels). Sorted cells were seeded on collagen-coated plates and cultured for 24 hours. Images were taken using a Zeiss fluorescent microscope (right panel). Scale bar: 20 μm. (C) Data analysis workflow. (D) Uniformed Manifold Approximation and Projection showing sorted cell populations in control and cirrhotic mice. The cells were divided into 12 clusters. Each dot represents a single cell. (E) GFP (left) and Cdh5 (cadherin-5) (also known as VE-cadherin; right) expression among the sorted cells. All the cells used for analyses were positive with GFP and Cdh5, indicating a high purity of liver EC populations. (F) Uniformed Manifold Approximation and Projection showing 12 identified clusters of the sorted cells. The identity of each cluster was determined by matching expression profiles of clusters with established cell-specific marker genes of different hepatic cells, including ECs, LyECs, HSCs, Kupffer cells (KCs), hepatocytes (Hepts), and cholangiocytes. Numbers in parentheses indicate corresponding clusters. (H) Heatmap showing representative genes expressed by each liver EC cluster or population. These genes were determined by their average expression levels.
Figure 2
Figure 2
Clusters that expressed nonendothelial cell markers. Feature plots showing relative distributions of established marker genes of different liver cell types among the sorted cells.
Figure 3
Figure 3
Spatial distributions of the identified liver EC populations (clusters 1–5) in control mice. (A–D) Paired feature plots (left) and violin plots (right) showing expression levels of (A) vascular EC and LSEC marker genes, (B) pericentral landmark genes, (C) periportal landmark genes, and (D) midzonal landmark genes among liver ECs 1–5. Each dot represents a single cell. In the violin plots, white lines indicate median expression values. (E) The identified liver ECs 1–5 were mapped on the liver lobule based on expression levels of the marker genes analyzed previously and were defined as arterial-like ECs (EC1), periportal (zone 1) LSECs (EC2), midzonal (zone 2) LSECs (EC3), pericentral (zone 3) LSECs (EC4), and central venous ECs (EC5).
Figure 4
Figure 4
Relative distributions of pericentral and periportal landmark genes among all liver ECs as well as comparison of pathway analysis of periportal and pericentral LSECs. (A) Feature plots showing relative distributions of established pericentral landmark genes among all liver ECs. (B) Feature plots showing relative distributions of established periportal landmark genes among all liver ECs. (C) Comparison of signaling pathways enriched in zone 1 LSECs and zone 3 LSECs based on GSEA. The NES is the normalized enrichment score, which indicates the magnitude of the correlation of a gene set (signaling pathway) with the phenotype. A positive NES means upregulation in zone 1 LSECs relative to zone 3 LSECs, while a negative NES shows upregulation in zone 3 LSECs relative to zone 1 LSECs. The color represents a P value, which estimates statistical significance of the NES.
Figure 5
Figure 5
Validation of landmark genes by immunolabeling and expression of new liver EC landmark genes in control mice. (A) Immunolabeling of zone-associated landmark genes in frozen liver sections from endothelial-GFP reporter mice. Red indicates landmark genes, green indicates GFP (ECs or IL7 for LyECs), blue indicates DAPI (nuclei). Scale bar: 40 μm. Images were taken using a Zeiss fluorescence microscope. (B) Violin plots showing expression levels of new zone-associated landmark genes in liver ECs 1-5. Each dot represents a single cell. White lines indicate median expression values. BD, bile duct; CV, central vein; HA, hepatic artery; PV, portal vein.
Figure 6
Figure 6
Cluster 6 represents LyEC. (A) Feature plots showing relative distributions of established LyEC marker genes (Lyve1, Flt4, Pdpn, and Prox1) among all the liver ECs. Expression levels of these LyEC marker genes identified cluster 6 as LyECs. (B) Comparison of LyEC maker gene expression between zone 2 LSECs and LyECs. Zone 2 LSECs were chosen for the comparison because of the highest levels of Lyve1 and Flt4 that they expressed among 3 LSEC populations. Each dot represents a single cell. White lines indicate median expression values. (C) Feature plots showing some of the genes found only in cluster 6, which thus have the potential as new LyEC markers and could help to distinguish LyECs from LSECs. (D) qPCR analysis to validate unique LyEC markers (distinct from LSECs) identified in this scRNA-seq analysis. Human primary LSECs and LyECs were used for qPCR analysis. n = 3. ∗∗∗∗P < .0001. qPCR analysis was repeated 3 times to confirm this finding.
Figure 7
Figure 7
Liver cirrhosis alters proportions of liver EC populations but still conserves their identities. (A) Proportions of liver EC populations in control vs cirrhotic mice. (B) Immunofluorescence images of lymphatic vessels (arrows) in control and cirrhotic mouse livers. Red indicates Lyve1 (arrows indicates lymphatic vessels), blue indicates DAPI (nuclei). Because it has been known that a majority of lymphatic vessels are found in the portal tract area, Lyve1 can still be used as a lymphatic vessel marker. Scale bar: 40 μm. Images were taken using a Zeiss fluorescence microscope. (C) Dot plots showing conserved landmarks of liver ECs in control and cirrhotic mice. The y-axis indicates EC populations corresponding to clusters 1–5 and the x-axis refers to EC landmarks, including periportal, midzonal, and pericentral landmarks. The size of each dot represents a percentage of cells that positively express the landmark gene. Orange color indicates higher expression levels, while gray color depicts lower expression levels. PV, portal vein.
Figure 8
Figure 8
LSEC capillarization is most prominent in zone 3, and CD34 represents LSEC capillarization more accurately than CD31. (A, B) Violin plots showing expression levels of capillarization-associated genes in LSECs (clusters 2, 3, and 4) of control and cirrhotic mice. Each dot represents a single cell. White lines indicate median expression values. (C) Immunolabeling of CD34 or CD31 in frozen liver sections from endothelial-GFP reporter mice. Red indicates CD34 or CD31 (frequently used capillarization markers), green indicates GFP (endothelial cells), blue indicates DAPI (nuclei). Scale bar: 100 μm. Images were taken using a confocal fluorescence microscope. (D, E) Expression of Kdr, Nrp1 (genes to maintain LSEC phenotype), and extracellular matrix genes in LSECs (clusters 2, 3, and 4) of control and cirrhotic mice. Each dot represents a single cell. White lines indicate median expression values. (F) Differential gene expression between control and cirrhotic mice in each cluster of LSECs (corresponding to zones 1, 2, or 3). The numbers in the figure indicate fold changes of expression levels (cirrhosis relative to control). The numbers greater than 1 (red) mean upregulation in LSECs of cirrhotic livers, while those less than 1 (blue) mean downregulation. The exact number is the magnitude of the fold change. All fold changes are statistically significant (P < .05). The hyphen (in gray cells) indicates no statistical significance between cirrhotic and control mice.
Figure 9
Figure 9
Cirrhosis decreases expression of endocytotic receptor genes most profoundly in zone 3 LSECs. (A) Violin plots showing expression levels of endocytosis receptor genes in LSECs (clusters 2, 3, and 4) of control and cirrhotic mice. Each dot represents a single cell. White lines indicate median expression values. (B) Differential expression of endocytosis receptor genes between control and cirrhotic mice in each cluster of LSECs (corresponding to zones 1, 2, or 3). The numbers in the figure indicate fold changes of expression levels (cirrhosis relative to control). The numbers greater than 1 (red) mean upregulation in LSECs of cirrhotic livers, while those less than 1 (blue) mean downregulation. The exact number is the magnitude of the fold change. All fold changes are statistically significant (P < .05). The hyphen (in gray cells) indicates no statistical significance between cirrhotic and control mice.
Figure 10
Figure 10
Identification and validation of genes associated with LSEC dysfunction in cirrhotic livers. (A, B) Violin plots showing expression levels of transcription factors in LSECs (clusters 2, 3, and 4) of control and cirrhotic mice. Black lines indicate median expression values. (C) Relative distributions of endothelin receptors (Ednra and Ednrb) in liver ECs of control and cirrhotic mice. (D) Immunolabeling of Ednrb in frozen liver sections from endothelial-GFP reporter mice. (A, C) The portal tract area and (B, D) the midzonal area of the liver. Red indicates Ednrb, green indicates VE-cadherin (represents all liver ECs), blue indicates DAPI (nuclei). Scale bar: 20 μm. Images were taken using a Zeiss fluorescence microscope. PV, portal vein.
Figure 11
Figure 11
LSECs likely do not undergo EndMT in injured, fibrotic, and cirrhotic mouse livers. (A) Relative distributions of mesenchymal marker genes in sorted cells of control and cirrhotic mice to evaluate EndMT in liver cirrhosis. (B) Violin plots showing expression levels of EndMT-associated genes in LSECs (clusters 2, 3, and 4) of control and cirrhotic mice. Each dot represents a single cell. White lines indicate median expression values. (C, D) Immunofluorescence images of paraffin liver sections (control and fibrotic or cirrhotic livers) isolated from endothelial-GFP reporter mice subjected to (C) CCl4 inhalation for 12 weeks and (D) BDL. Green indicates GFP (endothelial cells), red indicates α-SMA (a mesenchymal cell marker), blue indicates DAPI (nuclei). Images were taken using a confocal fluorescence microscope.
Figure 12
Figure 12
Rat primary LSECs undergo EndMT in a cultured condition in a time-dependent manner. (A) Immunolabeling of Lyve1 and α-SMA to assess EndMT in rat primary LSECs cultured for 3, 24, 48, and 72 hours on collagen-coated cover glasses. Green indicates Lyve1 (an LSEC marker), red indicates α-SMA (an EndMT marker), blue indicates DAPI (nuclei). Scale bar: 5 μm. (B) Western blot analysis of Lyve1 (an LSEC marker), α-SMA, and SM22α (EndMT markers) and eNOS (an EC marker). Hsp90 and β-actin were used as loading controls. (C) Scanning electron microscopy images of fenestrae in LSECs cultured for 24, 48, and 72 hours. Scale bar: 10 μm (upper panel) and 1 μm (lower panel).
Figure 13
Figure 13
Pathway analysis revealed unique functional changes in zonal LSECs as a result of liver cirrhosis. Comparison of signaling pathways by GSEA based on gene expression changes in all the LSECs or within each zone of LSECs in cirrhotic mice compared with control mice. The NES is the normalized enrichment score, which indicates the magnitude of the correlation of a gene set (signaling pathway) with the phenotype. A positive NES means activation, while a negative NES shows suppression. The color represents a P value, which estimates statistical significance of the NES.

References

    1. Halpern K.B., Shenhav R., Massalha H., Toth B., Egozi A., Massasa E.E., Medgalia C., David E., Giladi A., Moor A.E., Porat Z., Amit I., Itzkovitz S. Paired-cell sequencing enables spatial gene expression mapping of liver endothelial cells. Nat Biotechnol. 2018;36:962–970. - PMC - PubMed
    1. Halpern K.B., Shenhav R., Matcovitch-Natan O., Toth B., Lemze D., Golan M., Massasa E.E., Baydatch S., Landen S., Moor A.E., Brandis A., Giladi A., Avihail A.S., David E., Amit I., Itzkovitz S. Single-cell spatial reconstruction reveals global division of labour in the mammalian liver. Nature. 2017;542:352–356. - PMC - PubMed
    1. Dobie R., Wilson-Kanamori J.R., Henderson B.E.P., Smith J.R., Matchett K.P., Portman J.R., Wallenborg K., Picelli S., Zagorska A., Pendem S.V., Hudson T.E., Wu M.M., Budas G.R., Breckenridge D.G., Harrison E.M., Mole D.J., Wigmore S.J., Ramachandran P., Ponting C.P., Teichmann S.A., Marioni J.C., Henderson N.C. Single-cell transcriptomics uncovers zonation of function in the mesenchyme during liver fibrosis. Cell Rep. 2019;29:1832–1847.e8. - PMC - PubMed
    1. Aizarani N., Saviano A., Sagar, Mailly L., Durand S., Herman J.S., Pessaux P., Baumert T.F., Grun D. A human liver cell atlas reveals heterogeneity and epithelial progenitors. Nature. 2019;572:199–204. - PMC - PubMed
    1. MacParland S.A., Liu J.C., Ma X.Z., Innes B.T., Bartczak A.M., Gage B.K., Manuel J., Khuu N., Echeverri J., Linares I., Gupta R., Cheng M.L., Liu L.Y., Camat D., Chung S.W., Seliga R.K., Shao Z., Lee E., Ogawa S., Ogawa M., Wilson M.D., Fish J.E., Selzner M., Ghanekar A., Grant D., Greig P., Sapisochin G., Selzner N., Winegarden N., Adeyi O., Keller G., Bader G.D., McGilvray I.D. Single cell RNA sequencing of human liver reveals distinct intrahepatic macrophage populations. Nat Commun. 2018;9:4383. - PMC - PubMed

Publication types

Substances