

Functional biomarker signatures of circulating T-cells and its association with distinct clinical status of leprosy patients and their respective household contacts
- PMID: 33341111
- PMCID: PMC7749990
- DOI: 10.1186/s40249-020-00763-7
Functional biomarker signatures of circulating T-cells and its association with distinct clinical status of leprosy patients and their respective household contacts
Abstract
Background: Leprosy is a chronic infectious disease classified into two subgroups for therapeutic purposes: paucibacillary (PB) and multibacillary (MB), closely related to the host immune responses. In this context it is noteworthy looking for immunological biomarkers applicable as complementary diagnostic tools as well as a laboratorial strategy to follow-up leprosy household contacts.
Methods: The cross-sectional study enrolled 49 participants, including 19 patients and 30 healthy controls. Peripheral blood mononuclear cells (PBMC) were isolated and incubated in the presence of Mycobacterium leprae bacilli. The cells were prepared for surface (CD4+ and CD8+) and intracytoplasmic cytokine staining (IFN-γ, IL-4 and IL-10). Multiple comparisons amongst groups were carried out by ANOVA, Kruskal-Wallis, Student T or Mann-Whitney test. Comparative analysis of categorical variables was performed by Chi-square. Functional biomarker signature analysis was conducted using the global median values for each biomarker index as the cut-off edge to identify the proportion of subjects with high biomarker levels.
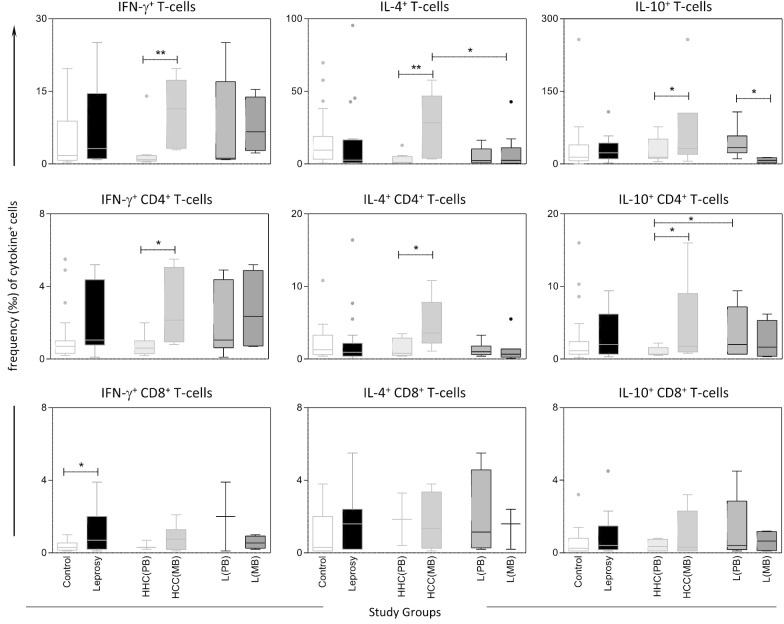
Results: The cytokine signature analysis demonstrated that leprosy patients presented a polyfunctional profile of T-cells subsets, with increased frequency of IFN-γ+ T-cell subsets along with IL-10+ and IL-4+ from CD4+ T-cells, as compared to health Controls (Venn diagram report). Moreover, statistical analysis was carried out using parametric or non-parametric variance analysis followed by pairwise multiple comparisons, according to the data normality distribution. L(PB) displayed a polyfunctional profile characterized by enhanced percentage of IFN-γ+, IL-10+ and IL-4+ produced by most T-cell subsets, as compared to L(MB) that presented a more restricted cytokine functional profile mediated by IL-10+ and IL-4+ T-cells with minor contribution of IFN-γ produced by CD4+ T-cells. Noteworthy was that HHC(MB) exhibited enhanced frequency of IFN-γ+ T-cells, contrasting with HHC(PB) that presented a cytokine profile limited to IL-10 and IL-4.
Conclusions: Our data demonstrated that L(PB) displayed enhanced percentage of IFN-γ+, IL-10+ and IL-4+ as compared to L(MB) that presented functional profile mediated by IL-10+ and IL-4+ T-cells and HHC(MB) exhibited enhanced frequency of IFN-γ+ T-cells, contrasting with HHC(PB). Together, our findings provide additional immunological features associated with leprosy and household contacts. These data provide evidence that biomarkers of immune response can be useful complementary diagnostic/prognostic tools as well as insights that household contacts should be monitored to access putative subclinical infection.
Keywords: Cytokines; Household contacts; Leprosy; Mycobacterium leprae.
Conflict of interest statement
The authors declare that they have no competing interests.
Figures
 ; Leprosy patients =
 ; HHC(PB) =
 —Household Contacts of Paucibacillary Leprosy patients; HHC(MB) =
 —Household Contacts of Multibacillary Leprosy patients; L(PB) =
 —Paucibacillary Leprosy patients; L(MB) =
 —Multibacillary Leprosy patients. Multiple comparisons amongst groups were carried out by Kruskal–Wallis test followed by Dunn’s post-test for sequential pairwise comparisons. Additionally, Man-Whitney Test were also employed for pairwise comparative analysis. Significant differences, using the above-mentioned statistical methods are underscored by * for differences at P < 0.05 and ** for differences at P < 0.01
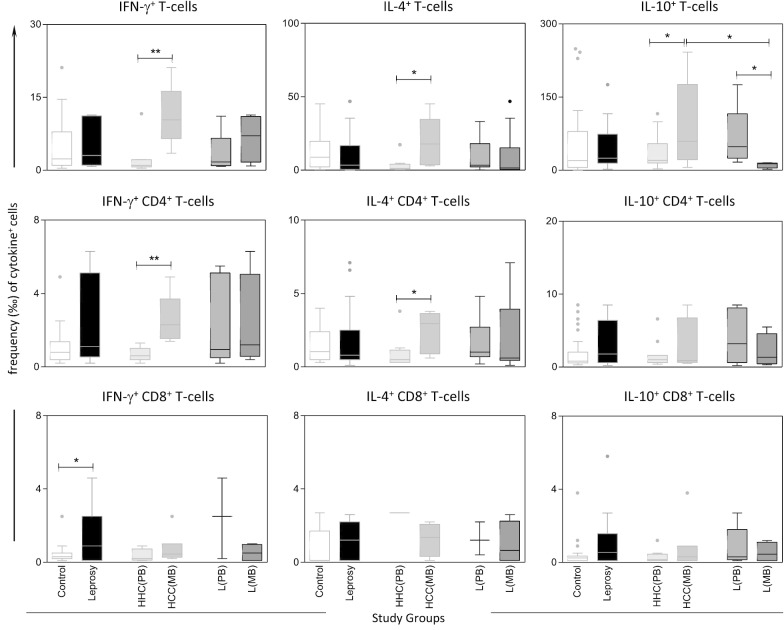
 ; Leprosy patients =
 ; HHC(PB) =
 —Household Contacts of Paucibacillary Leprosy patients; HHC(MB) =
 —Household Contacts of Multibacillary Leprosy patients; L(PB) =
 —Paucibacillary Leprosy patients; L(MB) =
 —Multibacillary Leprosy patients. Multiple comparisons amongst groups were carried out by Kruskal–Wallis test followed by Dunn’s post-test for sequential pairwise comparisons. Additionally, Man-Whitney Test were also employed for pairwise comparative analysis. Significant differences, using the above-mentioned methods, are underscored by * for differences at P < 0.05 and ** for differences at P < 0.01
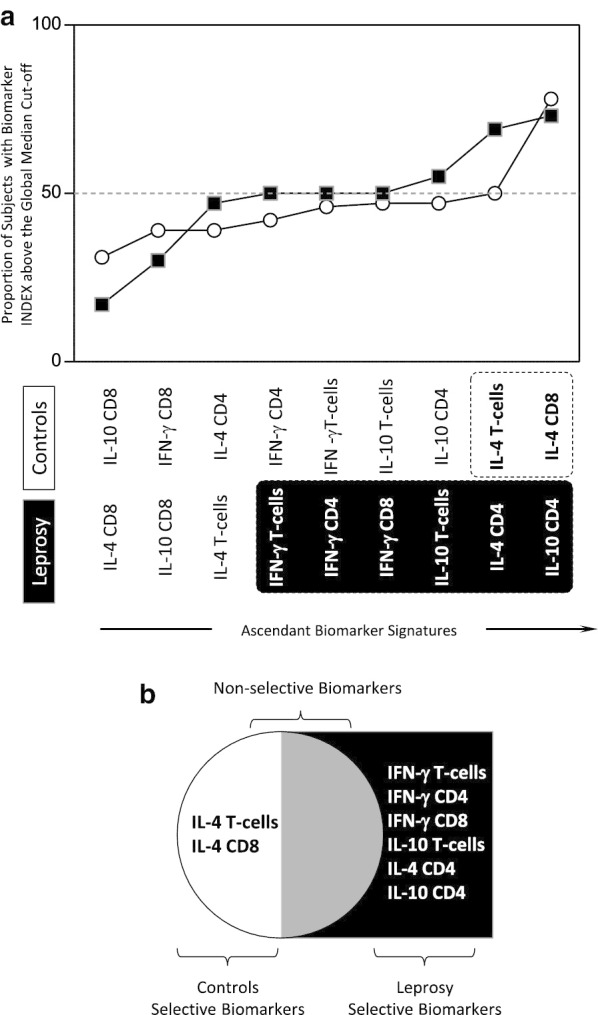
 ) and Controls (
 ) were assembled to select biomarkers with proportion of subjects above the global median cut-off higher than the 50% in each group (black/white background rectangles). b Venn diagram report was employed to identify the set of biomarkers selectively increased in Leprosy patients as compared to Healthy Controls. These attributes were tagged in bold format
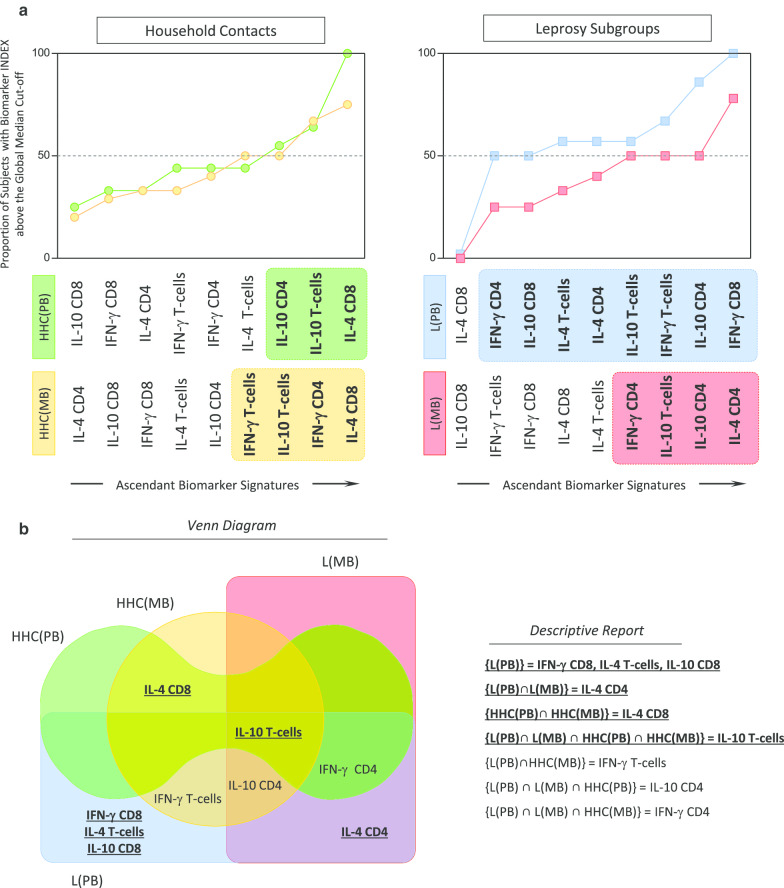
 and HHC(MB) =
 ) and subgroups of Leprosy patients (L(PB) =
 and L(MB) =
 ) were assembled to select biomarkers above the global median cut-off with proportion higher than the 50% in each group (black/white background rectangles). These attributes were tagged in bold format. b Venn diagram report was employed to identify the set of biomarkers selectively increased in each subgroup of Household contacts and subgroups of Leprosy patients. These attributes were highlighted in bold underline format
References
-
- WHO Global leprosy update, 2017: accelerating reduction of disease burden. Wkly Epidemiol Rec. 2017;2018(93):445.
-
- Contin LA, Alves CJ, Fogagnolo L, Nassif PW, Barreto JA, Lauris JR, Nogueira ME. Use of the ML-Flow test as a tool in classifying and treating leprosy. An Bras Dermatol. 2011;91:95. - PubMed
MeSH terms
Substances
Grants and funding
LinkOut - more resources
Full Text Sources
Medical
Research Materials
Miscellaneous
