

Placental magnetic resonance imaging in chronic hypertension: A case-control study
- PMID: 33341490
- PMCID: PMC7921773
- DOI: 10.1016/j.placenta.2020.12.006
Placental magnetic resonance imaging in chronic hypertension: A case-control study
Abstract
Introduction: We aimed to explore the use of magnetic resonance imaging (MRI) in vivo as a tool to elucidate the placental phenotype in women with chronic hypertension.
Methods: In case-control study, women with chronic hypertension and those with uncomplicated pregnancies were imaged using either a 3T Achieva or 1.5T Ingenia scanner. T2-weighted images, diffusion weighted and T1/T2* relaxometry data was acquired. Placental T2*, T1 and apparent diffusion coefficient (ADC) maps were calculated.
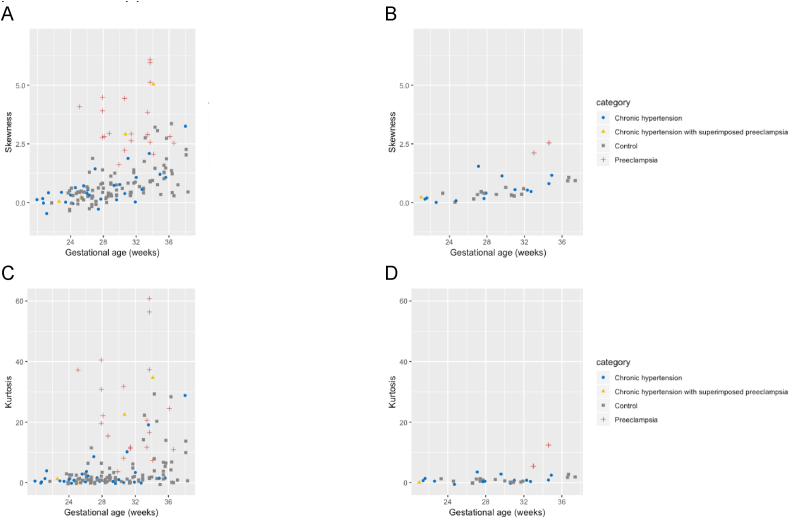
Results: 129 women (43 with chronic hypertension and 86 uncomplicated pregnancies) were imaged at a median of 27.7 weeks' gestation (interquartile range (IQR) 23.9-32.1) and 28.9 (IQR 26.1-32.9) respectively. Visual analysis of T2-weighted imaging demonstrated placentae to be either appropriate for gestation or to have advanced lobulation in women with chronic hypertension, resulting in a greater range of placental mean T2* values for a given gestation, compared to gestation-matched controls. Both skew and kurtosis (derived from histograms of T2* values across the whole placenta) increased with advancing gestational age at imaging in healthy pregnancies; women with chronic hypertension had values overlapping those in the control group range. Upon visual assessment, the mean ADC declined in the third trimester, with a corresponding decline in placental mean T2* values and showed an overlap of values between women with chronic hypertension and the control group.
Discussion: A combined placental MR examination including T2 weighted imaging, T2*, T1 mapping and diffusion imaging demonstrates varying placental phenotypes in a cohort of women with chronic hypertension, showing overlap with the control group.
Keywords: Chronic hypertension; Magnetic resonance imaging (MRI); Placenta.
Copyright © 2020 The Authors. Published by Elsevier Ltd.. All rights reserved.
Conflict of interest statement
The views expressed are those of the authors and not necessarily those of the UK National Health Service, the National Institute for Health Research, or the Department of Health and Social Care.
Figures


Similar articles
-
Visual assessment of the placenta in antenatal magnetic resonance imaging across gestation in normal and compromised pregnancies: Observations from a large cohort study.Placenta. 2022 Jan;117:29-38. doi: 10.1016/j.placenta.2021.10.006. Epub 2021 Oct 14. Placenta. 2022. PMID: 34768166 Free PMC article.
-
T2* Placental Magnetic Resonance Imaging in Preterm Preeclampsia: An Observational Cohort Study.Hypertension. 2020 Jun;75(6):1523-1531. doi: 10.1161/HYPERTENSIONAHA.120.14701. Epub 2020 Apr 27. Hypertension. 2020. PMID: 32336233 Free PMC article.
-
Static and dynamic responses to hyperoxia of normal placenta across gestation with T2*-weighted MRI sequences.Ultrasound Obstet Gynecol. 2024 Aug;64(2):236-244. doi: 10.1002/uog.27609. Ultrasound Obstet Gynecol. 2024. PMID: 38348601
-
Placental multimodal MRI prior to spontaneous preterm birth <32 weeks' gestation: An observational study.BJOG. 2024 Dec;131(13):1782-1792. doi: 10.1111/1471-0528.17901. Epub 2024 Jul 2. BJOG. 2024. PMID: 38956748 Free PMC article.
-
T2*-weighted placental magnetic resonance imaging: a biomarker of placental dysfunction in small-for-gestational-age pregnancies.Am J Obstet Gynecol MFM. 2022 May;4(3):100578. doi: 10.1016/j.ajogmf.2022.100578. Epub 2022 Jan 31. Am J Obstet Gynecol MFM. 2022. PMID: 35114424
Cited by
-
Multi-modal MRI reveals changes in placental function following preterm premature rupture of membranes.Magn Reson Med. 2023 Mar;89(3):1151-1159. doi: 10.1002/mrm.29483. Epub 2022 Oct 18. Magn Reson Med. 2023. PMID: 36255151 Free PMC article.
-
The human placenta project: Funded studies, imaging technologies, and future directions.Placenta. 2023 Oct;142:27-35. doi: 10.1016/j.placenta.2023.08.067. Epub 2023 Aug 21. Placenta. 2023. PMID: 37634371 Free PMC article. Review.
-
Cardiac and placental imaging (CARP) in pregnancy to assess aetiology of preeclampsia.Placenta. 2022 May;122:46-55. doi: 10.1016/j.placenta.2022.03.012. Epub 2022 Mar 25. Placenta. 2022. PMID: 35430505 Free PMC article.
-
Detection of placental stiffness using virtual magnetic resonance elastography in pregnancies complicated by preeclampsia.Arch Gynecol Obstet. 2024 Oct;310(4):2283-2289. doi: 10.1007/s00404-024-07585-0. Epub 2024 Jun 17. Arch Gynecol Obstet. 2024. PMID: 38884644 Free PMC article. No abstract available.
-
Placental T2* as a measure of placental function across field strength from 0.55T to 3T.Sci Rep. 2024 Nov 19;14(1):28594. doi: 10.1038/s41598-024-77406-6. Sci Rep. 2024. PMID: 39562648 Free PMC article.
References
-
- Seely E.W., Ecker J. Circulation. 2014;129:1254–1261. - PubMed
-
- Sibai B.M., Lindheimer M., Hauth J., Caritis S., VanDorsten P., Klebanoff M., MacPherson C., Landon M., Miodovnik M., Paul R. N. Engl. J. Med. 1998;339:667–671. - PubMed
-
- Kovo M., Bar J., Schreiber L., Shargorodsky M. The relationship between hypertensive disorders in pregnancy and placental maternal and fetal vascular circulation. J. Am. Soc. Hypertens. 2017;11 724-29. - PubMed
Publication types
MeSH terms
Grants and funding
LinkOut - more resources
Full Text Sources
Other Literature Sources
Medical
