. 2021 Mar 31;31(5):2309-2321.
doi: 10.1093/cercor/bhaa336.

Fetal Rhesus Monkey First Trimester Zika Virus Infection Impacts Cortical Development in the Second and Third Trimesters

Affiliations

Fetal Rhesus Monkey First Trimester Zika Virus Infection Impacts Cortical Development in the Second and Third Trimesters

Alice F Tarantal et al. Cereb Cortex. .

Abstract

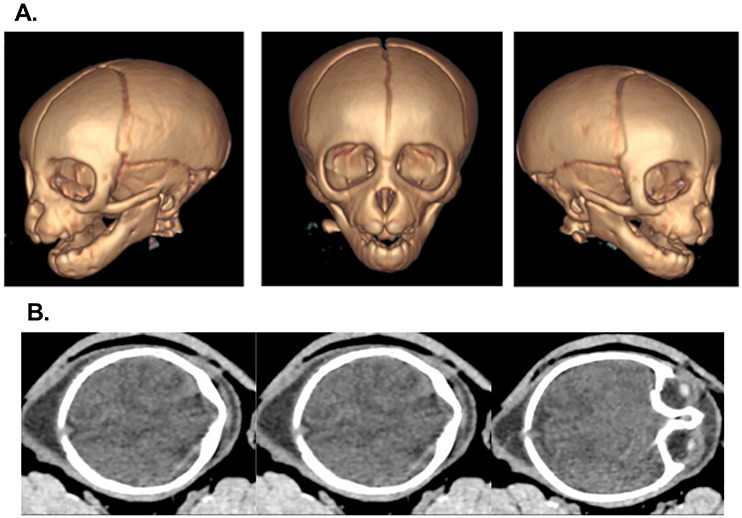
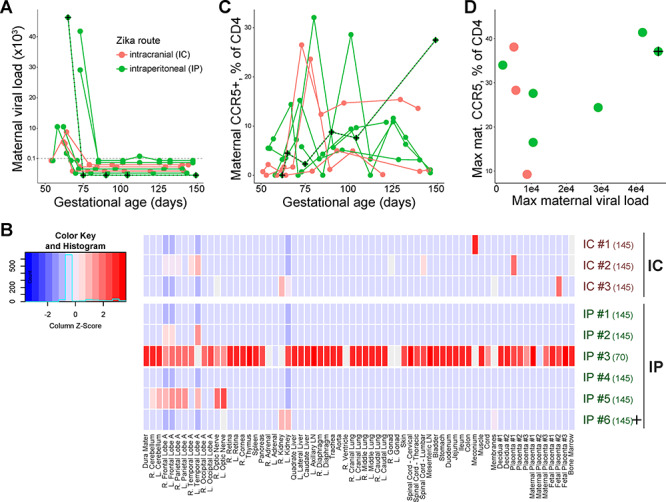
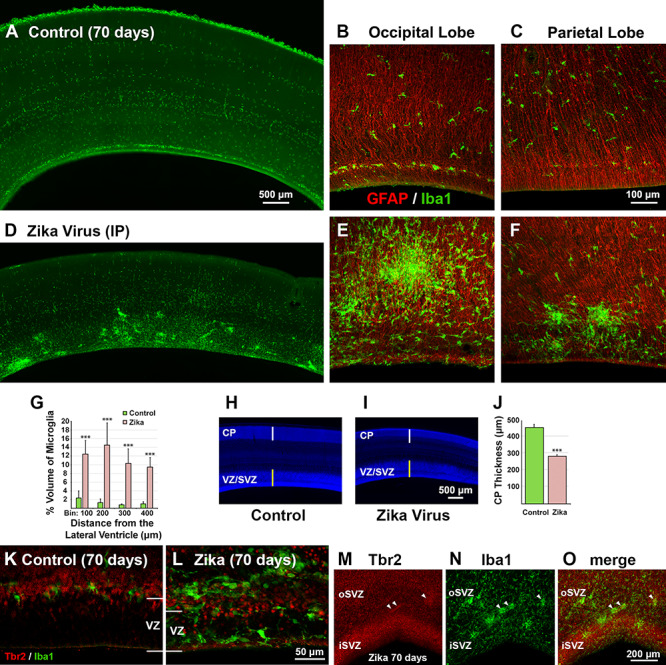
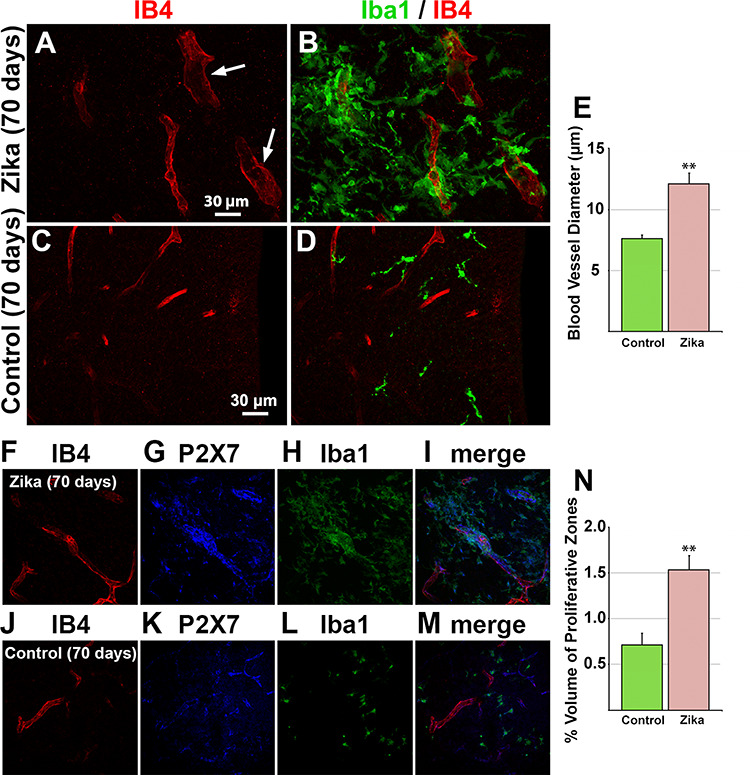
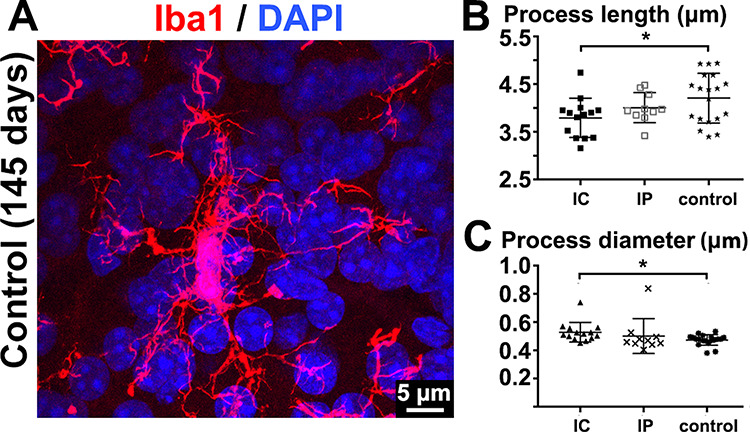
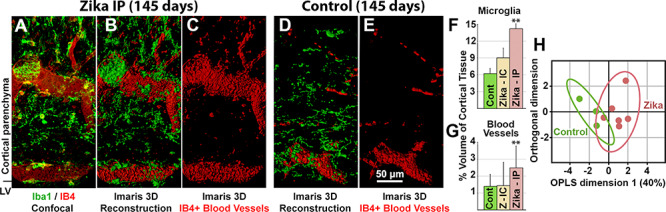
Zika virus is a teratogen similar to other neurotropic viruses, notably cytomegalovirus and rubella. The goal of these studies was to address the direct impact of Zika virus on fetal development by inoculating early gestation fetal rhesus monkeys using an ultrasound-guided approach (intraperitoneal vs. intraventricular). Growth and development were monitored across gestation, maternal samples collected, and fetal tissues obtained in the second trimester or near term. Although normal growth and anatomical development were observed, significant morphologic changes were noted in the cerebral cortex at 3-weeks post-Zika virus inoculation including massive alterations in the distribution, density, number, and morphology of microglial cells in proliferative regions of the fetal cerebral cortex; an altered distribution of Tbr2+ neural precursor cells; increased diameter and volume of blood vessels in the cortical proliferative zones; and a thinner cortical plate. At 3-months postinoculation, alterations in morphology, distribution, and density of microglial cells were also observed with an increase in blood vessel volume; and a thinner cortical plate. Only transient maternal viremia was observed but sustained maternal immune activation was detected. Overall, these studies suggest persistent changes in cortical structure result from early gestation Zika virus exposure with durable effects on microglial cells.

Keywords: Zika virus; fetus; microglia; monkey; vasculature.


Figures

Figure 1
Figure 1
Sedated dams were placed within plexiglass containment with open ports covered by mosquito netting for biocontainment. (A)  In utero fetal CT scans were conducted immediately following ultrasound examinations (once or twice; second and third trimesters) during gestation. Cropped images focusing on the fetal cranium are shown (early third trimester; 3D reconstruction) with no evidence of anatomical changes including within soft tissue structures (transverse sections shown) (B).
Figure 2
Figure 2
Viral loads and flow cytometry. (A) Maternal viral loads were followed longitudinally until hysterotomy. Transfer of virus from the fetus to the dam occurred soon after fetal inoculation. (B) Fetal tissues were extensively assessed following hysterotomy at 70-days (3-weeks postinoculation) or ~145-days gestational age (3-months postinoculation; term 165 ± 10 days). Selected tissues shown. IC = intracranial, IP = intraperitoneal, R = right, L = left, LN = lymph node. (C) Maternal immune activation, reflected in CCR5 expression by CD4+ T-cells, followed a pattern of early up regulation followed by later decline. (D) Maximum maternal viral loads and CCR5 expression appeared to be associated; increased expression of CCR5 followed the early spike in maternal viral loads by 10–30 days. Animal IP #6 had the highest maternal viral load and near-highest maternal CCR5 expression (“+” marker in all figures and a dotted line overlaid on traces; see Fig. 6H).
Figure 3
Figure 3
Fetal microglia distribution. (A) The distribution of Iba1+ microglial cells (green) in the occipital lobe of a normally developing fetus at 70-days gestation (second trimester). Microglia sparsely populate cortical proliferative zones at this stage of fetal development. Normal distribution of radial glial cells (GFAP, red) and microglia (green) in the control occipital lobe (B) and parietal lobe (C). (D) The number and density of Iba1+ microglial cells (green) was greatly increased in the 70-day fetus, 3 weeks after inoculation with Zika virus. Microglia (Iba1, green) localized in abnormal clusters throughout cortical proliferative zones. (E, F) Abnormal microglial clusters (green) were present in proliferative zones of all cortical lobes. (G) Iba1+ microglial cells occupied a significantly larger volume of proliferative zones in the 70-day fetus, 3 weeks after Zika virus inoculation. Microglia occupied a 6- to 10-fold greater volume in the Zika virus inoculated (red bars) proliferative zone compared with the age-matched control (green bars). (H–J) The cortical wall was significantly thinner in the 70-day fetus 3 weeks after Zika virus inoculation compared with the control fetus. The cortical wall from the pial meninges to the ventricular surface, and the cortical plate (CP) were significantly thinner in the 70-day fetus 3 weeks after Zika virus inoculation compared with the control. The vertical white line represents the thickness of the CP in control sections, and the vertical green line represents the thickness of the proliferative zones in control sections. (J) Histograms showing a significantly thinner cortical plate at 70 days, 3 weeks after Zika virus inoculation. (K, L) Tbr2+ precursor cells (red) were positioned closer to the ventricle, and distribution of Iba1+ microglia (green) was atypical in the 70-day Zika virus inoculated fetus. (M–O) Ectopic clusters of Tbr2+ precursor cells (red) were present in the proliferative zones of the Zika virus inoculated fetus (white arrowheads) and colocalized with clusters of microglial cells (green). oSVZ = outer SVZ, iSVZ = inner SVZ.
Figure 4
Figure 4
Blood vessel distribution. Blood vessels were larger in the 70-day brain 3 weeks after Zika virus inoculation compared with the control and were associated with increased P2X7 expression. (A) Large diameter Isolectin B4 (IB4)-positive vessels (red, white arrows) in the brain 3 weeks after Zika inoculation. (B) Microglia clusters (green) were often associated with blood vessels (red) that had a larger diameter in Zika virus inoculated brains. (C–E) IB4+ vessels were significantly thinner in control fetuses. (F–M) Expression of purinergic receptor P2X7 (blue) was increased in the cortex 3 weeks after Zika virus inoculation and was associated with both blood vessels (red) and microglia (green). (N) IB4+ blood vessels were larger and occupied twice the volume in cortical proliferative zones of the Zika virus inoculated brains (red bar) compared with control fetuses (green bar).
Figure 5
Figure 5
Cell morphology. (A) Control fetuses at 145-days gestation with 5 or 6 main processes radiated from microglial soma, and main processes that possessed numerous, finely branched processes. Cell morphological analysis indicated that microglial cell processes (B) were significantly shorter and (C) significantly thicker in the intracranial (IC) Zika virus inoculation group. IP = intraperitoneal.
Figure 6
Figure 6
Blood vessels were larger and associated with increased P2X7 expression with Zika virus exposure. (A) Confocal image of immunostained brain section that indicates microglia clusters (green) were often associated with large diameter blood vessels (red). (B, C) 3D Imaris reconstruction of the same image for quantification of blood vessel (red) and microglial cell (green) volume in the cerebral cortex. Large diameter IB4-positive vessels (red and white arrows) 3 months after Zika virus inoculation (~145-days gestation). (D, E) 3D Imaris reconstruction from a control fetus at a comparable gestational age showing blood vessels (red) and microglial cells (green) in the cerebral cortex. (F, G) Histograms indicate that microglial cell volume and blood vessel volume was significantly increased 2-fold in the fetal brain 3 months after Zika virus inoculation IP (red bars), although significance was not detected with IC inoculation (yellow bars) and when compared with age-matched controls (green bars). (H) The score derived by orthogonal partial least squares (OPLS; dimension 1) is a summary measure of cortical abnormality that discriminates control from Zika-infected animals. The percent microglial volume at 100–200 microns from the lateral ventricle was the greatest contributor to this score. The animal with the highest OPLS score is rightmost on the abscissa and tracked in Figure 2.

Similar articles

Cited by

References

    1. Aliota MT, Bassit L, Bradrick SS, Cox B, Garcia-Blanco MA, Gavegnano C, Friedrich TC, Golos TG, Griffin DE, Haddow AD et al. 2017. Zika in the Americas in year 2: what have we learned? What gaps remain? A report from the global virus network. Antiviral Res. 144:223–246. - PMC - PubMed
    1. Andjelkovic AV, Nikolic B, Pachter JS, Zecevic N. 1998. Macrophages/microglial cells in human central nervous system during development: an immunohistochemical study. Brain Res. 814:13–25. - PubMed
    1. Arnò B, Galli F, Roostalu U, Aldeiri BM, Miyake T, Albertini A, Bragg L, Prehar S, McDermott JC, Cartwright EJ et al. 2014. Neural progenitor cells orchestrate microglia migration and positioning into the developing cortex. Nat Commun. 5:5611. - PubMed
    1. Arora HS. 2020. A to Z of Zika virus: a comprehensive review for clinicians. Glob Pediatr Health. 7: 2333794X20919595. - PMC - PubMed
    1. Bachiller S. 2018. Microglia in neurological diseases: a road map to brain-disease dependent-inflammatory response. Front Cell Neurosci. 12:1–17. - PMC - PubMed

Publication types