

Molecular profiling of long-term responders to immune checkpoint inhibitors in advanced non-small cell lung cancer
- PMID: 33342055
- PMCID: PMC8024716
- DOI: 10.1002/1878-0261.12891
Molecular profiling of long-term responders to immune checkpoint inhibitors in advanced non-small cell lung cancer
Abstract
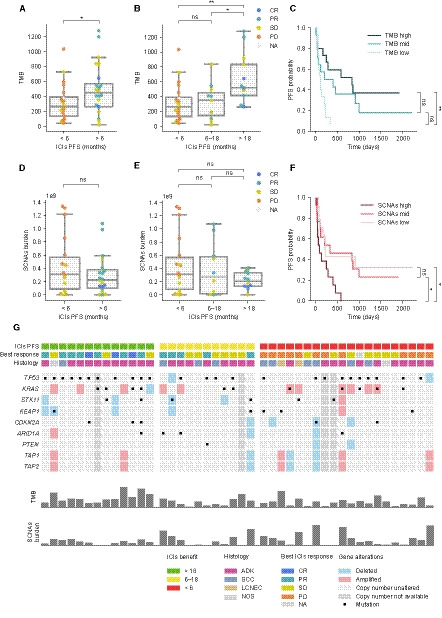
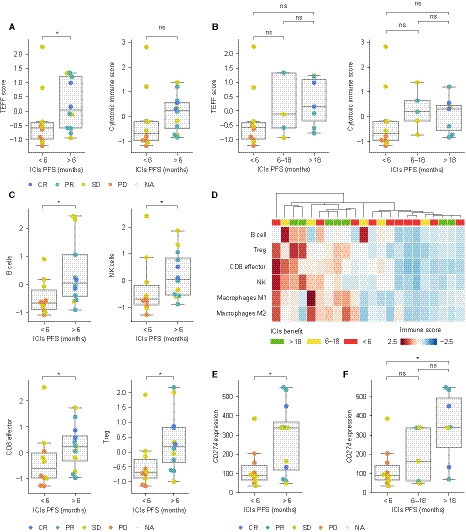
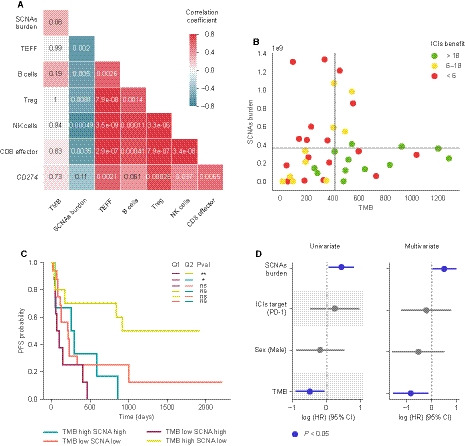
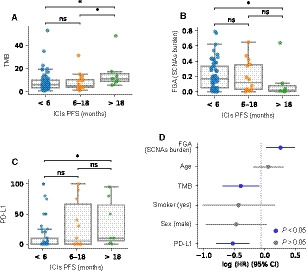
Immunotherapy has transformed advanced non-small cell lung cancer (NSCLC) treatment strategies and has led to unprecedented long-lasting responses in some patients. However, the molecular determinants driving these long-term responses remain elusive. To address this issue, we performed an integrative analysis of genomic and transcriptomic features of long-term immune checkpoint inhibitors (ICIs)-associated responders. We assembled a cohort of 47 patients with NSCLC receiving ICIs that was enriched in long-term responders [>18 months of progression-free survival (PFS)]. We performed whole-exome sequencing from tumor samples, estimated the tumor mutational burden (TMB), and inferred the somatic copy number alterations (SCNAs). We also obtained gene transcription data for a subset of patients using Nanostring, which we used to assess the tumor immune infiltration status and PD-L1 expression. Our results indicate that there is an association between TMB and benefit to ICIs, which is driven by those patients with long-term response. Additionally, high SCNAs burden is associated with poor response and negatively correlates with the presence of several immune cell types (B cells, natural killers, regulatory T cells or effector CD8 T cells). Also, CD274 (PD-L1) expression is increased in patients with benefit, mainly in those with long-term response. In our cohort, combined assessment of TMB and SCNAs burden enabled identification of long-term responders (considering PFS and overall survival). Notably, the association between TMB, SCNAs burden, and PD-L1 expression with the outcomes of ICIs treatment was validated in two public datasets of ICI-treated patients with NSCLC. Thus, our data indicate that TMB is associated with long-term benefit following ICIs treatment in NSCLC and that TMB, SCNAs burden, and PD-L1 are complementary determinants of response to ICIs.
Keywords: NSCLC; PD-L1; chromosomal alterations burden; copy number alterations; immune checkpoint inhibitors; long-term benefit; tumor mutational burden.
© 2020 The Authors. Published by FEBS Press and John Wiley & Sons Ltd.
Conflict of interest statement
EF reports the following conflicts of interest: advisory role or speaker’s bureau: AbbVie, AstraZeneca, BerGenBio, Blueprint medicines, Boehringer Ingelheim, Bristol‐Meyers Squibb, Celgene, Eli Lilly, Guardant Health, Janssen, Medscape, Merck KGaA, Merck Sharp & Dohme, Novartis, Pfizer, priME Oncology, Roche, Samsung, Takeda, Touchtime. Board: Grifols, independent member. Research funding: Fundación Merck Salud, Grant for Oncology Innovation EMD Serono. AV reports advisory role: Sysmex, Novartis, Merck, Roche, Bristol‐Meyers Squibb, Guardant Health, and research funding: Bristol‐Meyers Squibb, Novartis, Debio, Sysmex, Cellestia Biotech, Roche. PN has consulted for Bayer, Novartis, MSD, and Targos, and received compensation. IS reports advisory role, speaker’s bureau or travel compensation: Roche Farma, Abbvie, Roche Diagnostics, Merck Sharp & Dohme, Pfizer, Takeda, Bristol‐Myers Squibb, Lilly, Sysmex, Boehringer Ingelheim. CC has been partially supported by Grant for Oncology EMD Serono research funding to EF. AMM provided consultation, attended advisory boards and/or speaker's bureau for the following organizations: BMS, Roche, MSD, Pfizer, Boehringer Ingelheim, AstraZeneca. AN reports advisory role, speaker’s bureau or travel compensation: Bristol‐Myers Squibb, F. Hoffmann La Roche AG, Pfizer, Boehringer Ingelheim, Oryzon Genomics, Merck Sharp & Dohme. SC Bristol‐Myers Squibb Recipient F, Hoffmann La Roche AG, Pfizer, Boehringer Ingelheim, MSD Oncology, Amphera. AC reports advisory role and/or travel compensation: Bristol‐Myers Squibb Recipient, F. Hoffmann La Roche AG, Pfizer, Boehringer Ingelheim, MSD Oncology, Kyowa Kirin, Celgene. PI reports advisory role and/or travel compensation: Bristol‐Myers Squibb Recipient, F. Hoffmann, La Roche AG, Merck Sharp & Dohme, Boehringer Ingelheim, MSD Oncology, Rovi, Yowa Kirin, Grunenthal Pharma S.A., Pfizer. NP reports advisory role and/or travel compensation: Bristol‐Myers Squibb Recipient, F. Hoffmann La Roche AG, Pfizer, Boehringer Ingelheim. AP reports advisory role and/or travel compensation: Pfizer, Novartis, Roche, MSD Oncology, Lilly, Daiichi Sankyo, Amgen, Boehringer, PUMA, Oncolytics Biotech, Abbvie, Nanostring Technologies. All remaining authors have declared no conflicts of interest.
Figures
References
-
- Herbst RS, Baas P, Kim DW, Felip E, Pérez‐Gracia JL, Han J‐Y, Molina J, Kim J‐H, Arvis CD, Ahn M‐J et al. (2016) Pembrolizumab versus docetaxel for previously treated, PD‐L1‐positive, advanced non‐small‐cell lung cancer (KEYNOTE‐010): A randomised controlled trial. Lancet 387, 1540–1550. - PubMed
-
- Garon EB, Rizvi NA, Hui R, Balmanoukian AS, Eder JP, Patnaik A, Aggarwal C, Gubens M, Horn L, Carcereny E et al. (2015) Pembrolizumab for the treatment of non‐small‐cell lung cancer. N Engl J Med 372, 2018–2028. - PubMed
-
- Garon EB, Hellmann MD, Rizvi NA, Carcereny E, Leighl NB, Ahn MJ, Eder JP, Balmanoukian AS, Aggarwal C, Horn L et al. (2019) Five‐year overall survival for patients with advanced non‐small‐cell lung cancer treated with pembrolizumab: Results from the phase i KEYNOTE‐001 study. J Clin Oncol 37, 2518–2527. - PMC - PubMed
Publication types
MeSH terms
Substances
LinkOut - more resources
Full Text Sources
Other Literature Sources
Medical
Research Materials
