. 2021 Mar 1;89(5):451-462.
doi: 10.1016/j.biopsych.2020.09.025. Epub 2020 Oct 10.

Plasma and Fecal Metabolite Profiles in Autism Spectrum Disorder

Affiliations

Plasma and Fecal Metabolite Profiles in Autism Spectrum Disorder

Brittany D Needham et al. Biol Psychiatry. .

Abstract

Background: Autism spectrum disorder (ASD) is a neurodevelopmental condition with hallmark behavioral manifestations including impaired social communication and restricted repetitive behavior. In addition, many affected individuals display metabolic imbalances, immune dysregulation, gastrointestinal dysfunction, and altered gut microbiome compositions.

Methods: We sought to better understand nonbehavioral features of ASD by determining molecular signatures in peripheral tissues through mass spectrometry methods (ultrahigh performance liquid chromatography-tandem mass spectrometry) with broad panels of identified metabolites. Herein, we compared the global metabolome of 231 plasma and 97 fecal samples from a large cohort of children with ASD and typically developing control children.

Results: Differences in amino acid, lipid, and xenobiotic metabolism distinguished ASD and typically developing samples. Our results implicated oxidative stress and mitochondrial dysfunction, hormone level elevations, lipid profile changes, and altered levels of phenolic microbial metabolites. We also revealed correlations between specific metabolite profiles and clinical behavior scores. Furthermore, a summary of metabolites modestly associated with gastrointestinal dysfunction in ASD is provided, and a pilot study of metabolites that can be transferred via fecal microbial transplant into mice is identified.

Conclusions: These findings support a connection between metabolism, gastrointestinal physiology, and complex behavioral traits and may advance discovery and development of molecular biomarkers for ASD.

Keywords: ASD; Autism spectrum disorder; Fecal metabolites; Metabolomics; Mitochondrial dysfunction; Phenolic metabolites; Plasma metabolites; Steroid hormones.


Conflict of interest statement

Declaration of Interests

A.S.C., D.H.D. and S.K.M. have financial interest in Axial Biotherapeutics. A.F. has financial interest in Alba Therapeutics. G.M.P. and M.C.C. are employed by Axial Biotherapeutics. All other authors report no biomedical financial interests or potential conflicts of interest.

Figures
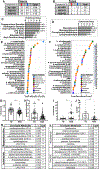
Figure 1.
Figure 1.. Plasma and Fecal Metabolomes Differ between ASD and TD groups
(A-B) The number of significantly elevated and decreased metabolites (p-value<0.05, q-value<0.1) in ASD samples compared to the TD control group by ANOVA contrasts in plasma and feces, respectively. Samples are stratified by all samples or samples without or with GI symptoms (−GI, +GI). (C-D) Pathway analysis results of human plasma and fecal comparisons (all samples), indicating which metabolomic pathways are the most altered between groups, with enrichment value plotted and p-value to the right of each bar. Metabolites within each pathway could be observed at either higher or lower levels, as this plot only indicates changes. (E-F) Top 30 most distinguishing metabolites between each group in plasma and feces by random forest analysis, with mean decrease accuracy along the x-axis, which is determined by randomly permuting a variable, running the observed values through the trees, and then reassessing the prediction accuracy. If a variable is important to the classification, the prediction accuracy will drop after such a permutation. Metabolites known to be produced by (asterisks) or influenced by (triangles) the gut microbiota are denoted. The super pathway to which each metabolite belongs to is indicated by color of sphere and defined in the legend. (G-H) Scaled intensity values indicating relative levels of the most distinguishing molecules between ASD and TD (all samples) in plasma. Asterisks indicate significance (p-value<0.05, q-value<0.1) in ANOVA contrasts performed on total metabolomics dataset. Data are represented as mean ± SEM. (I-J) Scaled intensity values indicating relative levels of the most distinguishing molecules between ASD and TD (all samples) in feces. Asterisks indicate significance (p-value<0.05, q-value<0.1) in ANOVA contrasts performed on total metabolomics dataset. Data are represented as mean ± SEM. (K) Top correlated plasma metabolites that covary with margaroylcarnitine and indolelactate. (L) Top correlated fecal metabolites that covary with nicotinamide and 9-HOTrE. LPC, lysophosphatidylcholine; CE, cholesterol ester; FFA, free fatty acid; androst., androstane; hydroxypreg, hydroxypregnenalone; PFOS, perfluorooctanesulfonic acid; hydroxy-CMPF, hydroxy-3-carboxy-4-methyl-5-propyl-2- furanpropionate; DHEA-s, dehydroepiandrosterone sulfate; 9-HOTrE, 9S-hydroxy-10E,12Z,15Z-octadecatrienoic acid; AMP, adenosine monophosphate.
Figure 2.
Figure 2.. Metabolite Levels Correlate with ADOS-SS
(A) Correlation of ADOS-SS with metabolites from the cysteine, methionine, and glutathione pathways. Significant metabolites corresponding to the linear regression in the graph are listed along with spearman coefficients and p-values. Refer to color legend at bottom. (B-C) Scaled intensity values indicating relative levels of hypotaurine in feces (B) and plasma (C) (all samples). Data are represented as mean ± SEM. Asterisks indicate significance in ANOVA contrasts performed on total metabolomics dataset with an FDR cutoff of q<0.1. (p-values: **p<0.01, ***p<0.001). (D) Correlations of gamma-glutamyl amino acids with ADOS-SS, with spearman coefficients and p-values to the right. Refer to color legend at bottom. (E) The top 5 most positively correlated plasma metabolites with ADOS-SS, with spearman coefficients and p-values to the right. Refer to color legend at bottom.
Figure 3.
Figure 3.. ASD Abnormalities within Cellular Energy and Oxidative Stress Metabolites
(A) Log2 fold change of acyl-carnitines in the plasma of ASD-GI samples compared to controls. Significance indicated by color according to legend below, determined by ANOVA contrasts. Star indicates that a trend or significance was observed but only in the comparison between all samples. (B-C) Scaled intensity values indicating relative levels of acetylcarnitine(C2) and carnitine, respectively, in ASD fecal samples compared to TD controls (all samples). Data are represented as mean ± SEM. Asterisks indicate significance in ANOVA contrasts (FDR cutoff q-value<0.1) performed on total metabolomics dataset (p-values: **p<0.01, ****p<0.0001. (D) Schematic of mitochondrial markers and other metabolites closely associated with cellular energy in plasma (within center box) and feces (boxed to left). *=significant only in ASD-GI. Color of text indicates direction and significance of change according to legend above. PC, phosphatidylcholine; PE, phosphatidylethanolamine; GPG, glycerophosphoglycerol; GPC, glycerophosphocholine; GPE, glycerophosphoethanolamine; GPS, glycerophosphoserine; GPI, glycerophosphoinositol; TAG, triacylglycerol; DAG, diacylglycerol; FFA, free fatty acid; SAT, saturated fatty acid; PUFA, polyunsaturated fatty acid.
Figure 4.
Figure 4.. Steroid Hormone Levels are Elevated in ASD and other Lipid Metabolite Levels Differ in ASD
(A) Significant alterations to levels of all metabolites detected in the pregnenolone, progestin, and androgen steroid pathways in plasma (P) and feces (F), with colors indicating significance and fold change direction according to legend at bottom right, and numerical fold change in text within the box. (B) Complex lipid panel results for all the ASD plasma samples compared to TD controls with acyl chain length of lipids across the top, described by chain length, degree of unsaturation and categorized by saturated (SAT), monounsaturated (MUFA), and polyunsaturated (PUFA) fatty acids. Lipid classes are listed along the left. Direction of change and significance are indicated by the legend. Significance determined by ANOVA contrasts, FDR cutoff q-value<0.1.
Figure 5.
Figure 5.. Differential Phenolic Xenobiotic Metabolite Levels in ASD
(A) Phenolic metabolites, belonging to the benzoate, tyrosine, and food component/plant pathways that are significantly different between ASD vs TD groups in plasma (P), and feces (F). Directionality and significance defined in legend, and numerical fold change in text within the box. (B) Scaled intensity values indicating relative levels of 4-allylphenol sulfate in plasma (all samples). (C) Scaled intensity values indicating relative levels of 2-ethylphenyl sulfate in plasma (all samples). (D) Scaled intensity values indicating relative levels of 4-ethylphenyl sulfate (4EPS) in plasma (all samples). (E) Spearman correlation between plasma 4EPS and 4-acetylphenol sulfate, log2 scale. Data in (B-D) are represented as mean ± SEM. Asterisks indicate significance in ANOVA contrasts with an FDR cutoff q-value<0.1 performed on total metabolomics dataset (p-values: **<0.01, ****<0.0001).
Figure 6.
Figure 6.. Summary chart of core findings
Categorized into metabolites of lipid, mitochondrial function marker, and xenobiotic and phenolic pathways as well as potential biomarkers, the metabolites of most interest (left) and observations made from the data (right) are summarized.

References

    1. Doernberg E, Hollander E, Neurodevelopmental Disorders (ASD and ADHD): DSM-5, ICD-10, and ICD-11. CNS Spectr. 21, 295–299 (2016). - PubMed
    1. Baio J, Wiggins L, Christensen DL, Maenner MJ, Daniels J, Warren Z, Kurzius-Spencer M, Zahorodny W, Robinson Rosenberg C, White T, Durkin MS, Imm P, Nikolaou L, Yeargin-Allsopp M, Lee L-C, Harrington R, Lopez M, Fitzgerald RT, Hewitt A, Pettygrove S, Constantino JN, Vehorn A, Shenouda J, Hall-Lande J, Van Naarden Braun K, Dowling NF, Prevalence of Autism Spectrum Disorder Among Children Aged 8 Years — Autism and Developmental Disabilities Monitoring Network, 11 Sites, United States, 2014. MMWR Surveill. Summ 67, 1–23 (2018). - PMC - PubMed
    1. Dawson G, Rogers S, Munson J, Smith M, Winter J, Greenson J, Donaldson A, Varley J, Randomized, controlled trial of an intervention for toddlers with autism: the Early Start Denver Model. Pediatrics. 125, e17–23 (2010). - PMC - PubMed
    1. Virués-Ortega J, Applied behavior analytic intervention for autism in early childhood: meta-analysis, meta-regression and dose-response meta-analysis of multiple outcomes. Clin. Psychol. Rev 30, 387–399 (2010). - PubMed
    1. Chiarotti F, Venerosi A, Epidemiology of Autism Spectrum Disorders: A Review of Worldwide Prevalence Estimates Since 2014. Brain Sci. 10 (2020), doi:10.3390/brainsci10050274. - DOI - PMC - PubMed

Publication types