

doi: 10.2463/mrms.tn.2020-0096.
Epub 2020 Dec 18.
Detecting Mild Lower-limb Skeletal Muscle Fatigue with Stimulated-echo q-space Imaging
Affiliations
- PMID: 33342916
- PMCID: PMC8922348
- DOI: 10.2463/mrms.tn.2020-0096
Item in Clipboard
Detecting Mild Lower-limb Skeletal Muscle Fatigue with Stimulated-echo q-space Imaging
Magn Reson Med Sci.
.
Abstract
The feasibility of detecting mild exercise-related muscle fatigue via stimulated echo (STE) and q-space imaging (qsi) was evaluated. The right calves of seven healthy volunteers were subjected to mild exercise loading, and qsi was generated using spin echo (Δ: 45.6 ms) and three different STE (Δ: 114, 214, and 414 ms) acquisitions. We concluded that qsi with an increased STE diffusion time can detect mild fatigue in the gastrocnemius muscle.
Keywords: diffusion-weighted imaging; muscle fatigue; q-space imaging; stimulated echo.
Figures
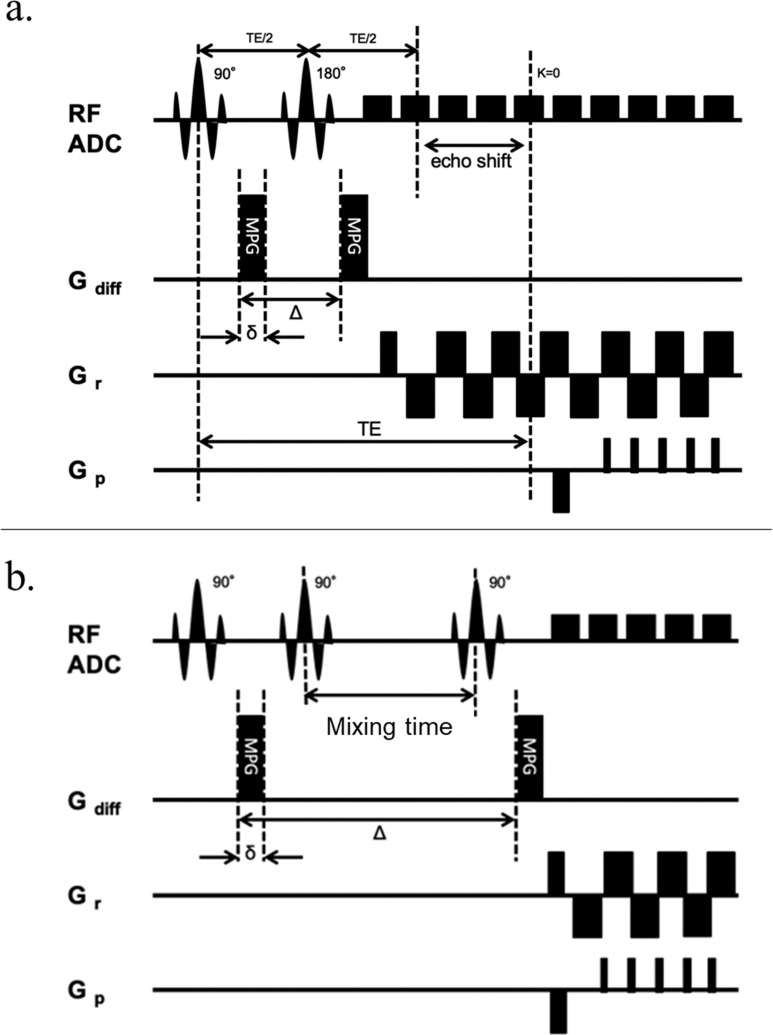
Schematic diagram of the timing of the spin echo and stimulated diffusion encoding schemes. (a) SE: the diffusion time is extended by adjusting the TE. (b) STE: the STE with three 90° is used for imaging. The diffusion time is extended by adjusting the mixing time. δ, gradient length; E the time between the two leading edges of the diffusion gradient; ADC, apparent diffusion coefficient; Gdiff, gradient (diffusion encoding); Gp, gradient (phase encoding); Gr, gradient (readout encoding); MPG, motion-probing gradient; SE, spin echo; STE, stimulated echo.
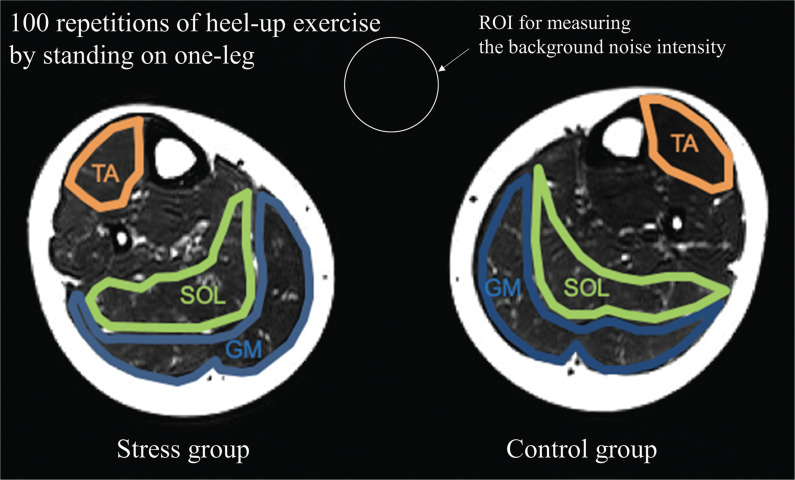
Example ROIs on axial T2-weighted images of the bilateral calves. The subjects were asked to perform the heel-up exercise only on the right lower limb. We defined the right lower limb as the stress group and the left lower limb as the control group. ROIs over the TA, SOL, and GM are indicated in orange, green, and blue, respectively. ROI for measuring the background noise intensity is indicated in white. GM, gastrocnemius muscle; SOL, soleus muscle; TA, tibialis anterior muscle.
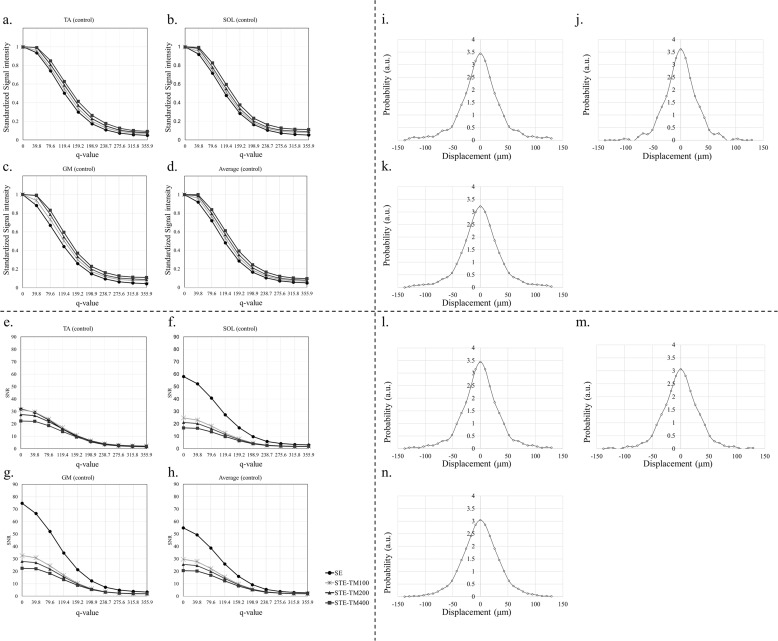
The values at each q-value, which were standardized by a q-value of 0, SNRs for each q-value, acquisition type, and muscle for the control group and examples of probability density function curves. The values at each q-value, which were standardized by a q-value of 0 of the (a) TA, (b) SOL, and (c) GM. (d) The average of the standardized values of the TA, SOL, and GM. SNRs of the (e) TA, (f) SOL, and (g) GM. (h) The averages of the SNRs of the TA, SOL, and GM. Examples of probability density function curves of the (i) TA, (j) SOL, and (k) GM on control group. Examples of probability density function curves of the (l) TA, (m) SOL, and (n) GM on stress group. a.u., arbitrary units; GM, gastrocnemius muscle; SE, spin echo; SOL, soleus muscle; STE, stimulated echo; TA, tibialis anterior muscle; TM, mixing time.
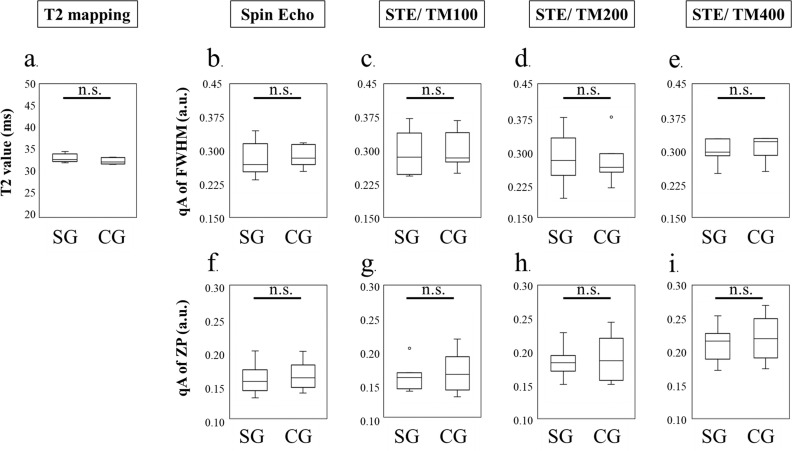
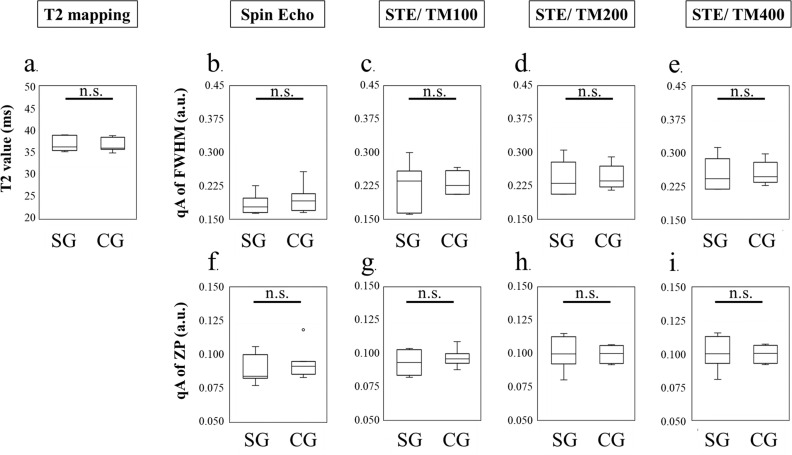
Comparison of the TA between the CG and SG using T2 mapping, FWHM, and probability at ZP for SE and STE (mixing time: 100 ms, 200 ms, and 400 ms). (a): T2 map. (b): qA of the FWHM using SE. (c–e) qA of the FWHM using STE at a TM of (c) 100 ms, (d) 200 ms, or (e) 400 ms. (f) qA of the ZP using SE. (g–i) qA of the ZP using STE at a TM of (g) 100 ms, (h) 200 ms, or (i) 400 ms. ROIs were set on the TA. None of the imaging parameters could distinguish the effect of the heel-up exercise. a.u., arbitrary units; CG, control group; FWHM, full width at half maximum; n.s., not significant; qA, q-space anisotropic index; SE, spin echo; SG, stress group; STE, stimulated echoes; TA, tibialis anterior muscles; TM, mixing time; ZP, zero displacement.
Comparison of the SOL between the CG and SG using T2 mapping, FWHM, and probability at ZP for SE and STE (TMs: 100ms, 200 ms, and 400 ms). (a) T2 map. (b) qA of the FWHM using SE. (c–e) qA of the FWHM using STE at a TM of (c) 100 ms, (d) 200 ms, or (e) 400 ms. (f) qA of the ZP using SE. (g–i) qA of the ZP using STE at a TM of (g) 100 ms, (h) 200 ms, or (i) 400 ms. ROIs were set on the soleus muscles. All imaging parameters could not distinguish the effect of the heel-up exercise. a.u., arbitrary units; CG, control group; FWHM, full width at half maximum; n.s., not significant; qA, q-space anisotropic index; SE, spin echo; SG, stress group; SOL, soleus muscles; STE, stimulated echoes; TM, mixing time; ZP, zero displacement.
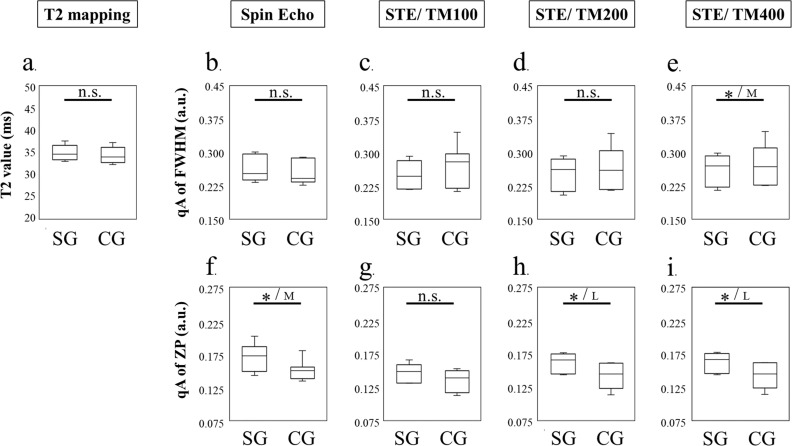
The results of gastrocnemius muscles: the comparison between CG and SG using T2 mapping, FWHM, and probability at ZP for SE and STE (TM: 100 ms, 200 ms, and 400 ms). (a) T2 map. (b) qA of the FWHM using SE. (c–e): qA of the FWHM using STE at a TM of (c) 100 ms, (d) 200 ms, or (e) 400 ms. (f) qA of the ZP using SE. (g–i) qA of the ZP using STE at a TM of (g) 100 ms, (h) 200 ms, or (i) 400 ms. ROIs were set on the gastrocnemius muscles. The qA of ZP using SE and STE at a TM of 200 ms and STE at a TM of 400 ms and the qA of FWHM using STE at a TM of 400 ms could distinguish the effect of the heel-up exercise. Particularly, STE at a TM of 200 ms and 400 ms had a larger effect size than SE, which had a moderate effect size. T2 mapping could not distinguish this effect. a.u., arbitrary units; CG, control group; FWHM, full width at half maximum; L, large effect size (d ≧ 1.0); M, moderate effect size (d ≧ 1.0); n.s., not significant; qA, q-space anisotropic index; SE, spin echo; SG, stress group; STE, stimulated echoes; TM, mixing time; ZP, zero displacement. *P < 0.05.
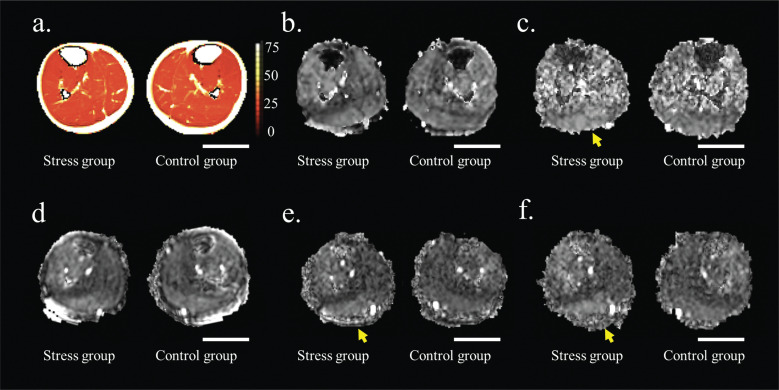
T2 mapping and representative q-space imaging-derived images (qA of FWHM and probability at ZP). T2 mapping and representative q-space imaging-derived images (qA of FWHM and probability at ZP). (a) T2 map. (b, c) qA of the FWHM maps generated using (b) SE, or (c) STE at a TM of 400 ms. (d–f) qA of the ZP maps using (d) SE, (e) STE at a TM of 200 ms, or (f) STE at a TM of 400 ms. The conditions in (c), (e), and (f) could distinguish the effect of the heel-up exercise on the GM. The yellow arrows indicate regions depicting mild myocyte changes in the gastrocnemius muscle. The contrast is aligned for each q-space imaging parameter. CG, control group; FWHM, full width at half maximum; GM, gastrocnemius muscles; qA, q-space anisotropic index; SE, spin echo; SG, stress group; STE, stimulated echoes; TM, mixing time; ZP, zero displacement. Scale bar = 5 cm.
References
-
- Hori M,, Fukunaga I,, Masutani Y,, et al. et al. Visualizing non-Gaussian diffusion: Clinical application of q-space imaging and diffusional kurtosis imaging of the brain and spine. Magn Reson Med Sci 2012; 11:221–233. - PubMed
-
- Cohen Y,, Assaf Y. High b-value q-space analyzed diffusion-weighted MRS and MRI in neuronal tissues – A technical review. NMR Biomed 2002; 15:516–542. - PubMed
-
- Nakashima D,, Fujita N,, Hata J,, et al. et al. Quantitative analysis of intervertebral disc degeneration using Q-space imaging in a rat model. J Orthop Res 2020; 38:2220–2229. - PubMed
-
- Sone Y,, Hata J,, Sera Y,, et al. et al. iShim and water excitation improves the signal-to-noise ratio on q-space imaging: A single-center clinical study. Open J Radiol 2018; 8:244–259.
-
- Cohen Y,, Anaby D,, Morozov D. Diffusion MRI of the spinal cord: From structural studies to pathology. NMR Biomed 2017; 30:e3592. - PubMed
MeSH terms
LinkOut - more resources
Full Text Sources
Research Materials