

Effect of Gender on Development of Hippocampal Subregions From Childhood to Adulthood
- PMID: 33343321
- PMCID: PMC7744655
- DOI: 10.3389/fnhum.2020.611057
Effect of Gender on Development of Hippocampal Subregions From Childhood to Adulthood
Abstract
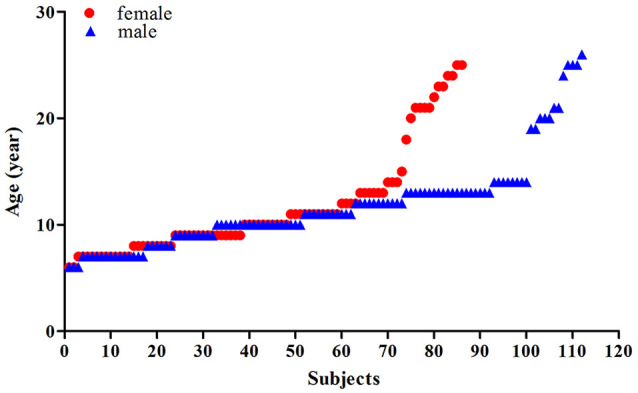
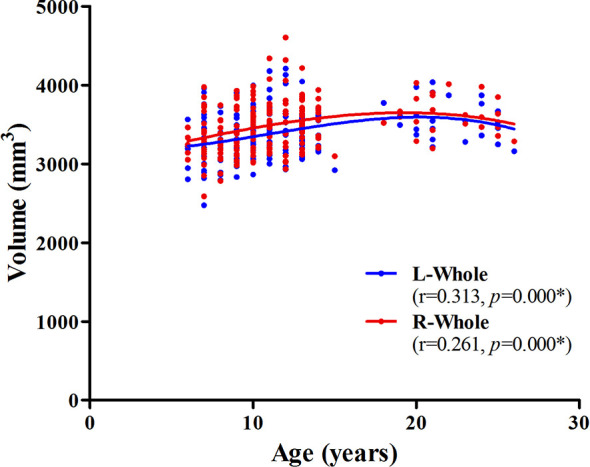
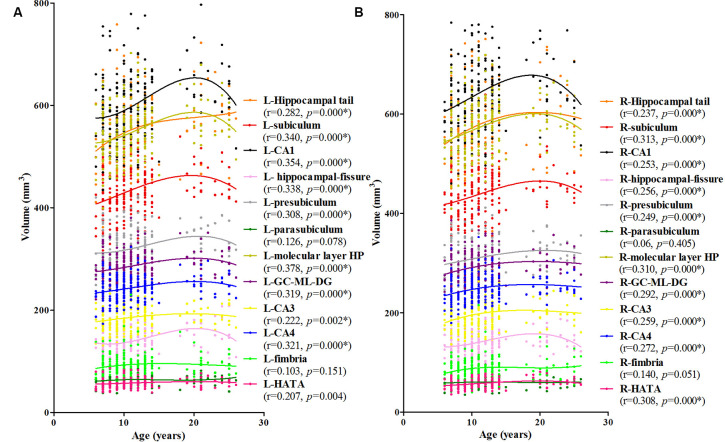
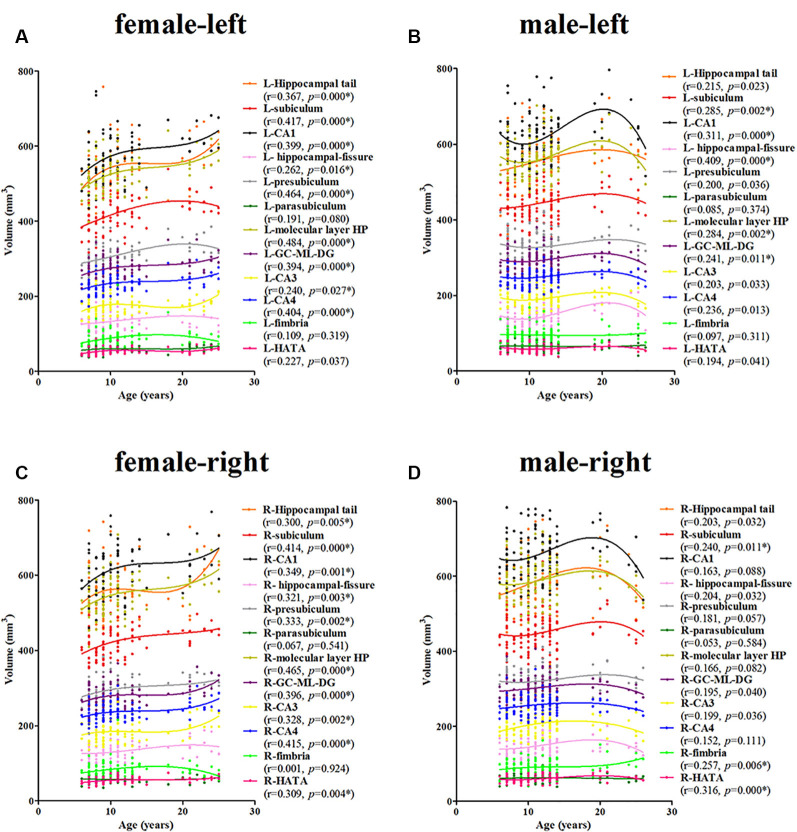
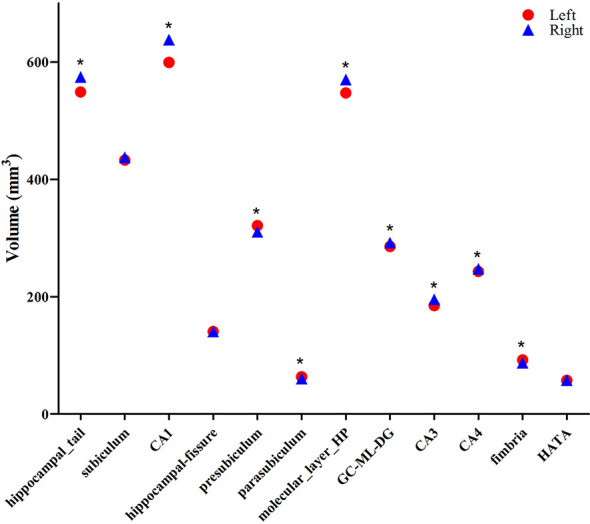
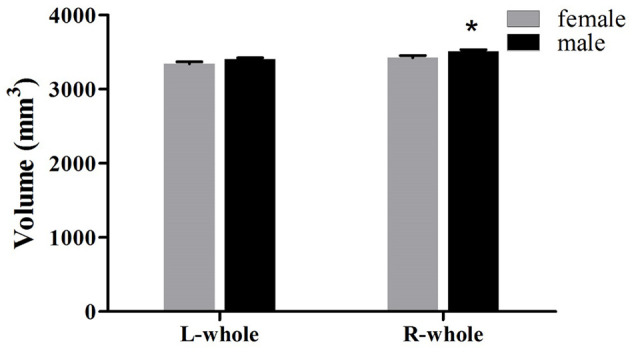
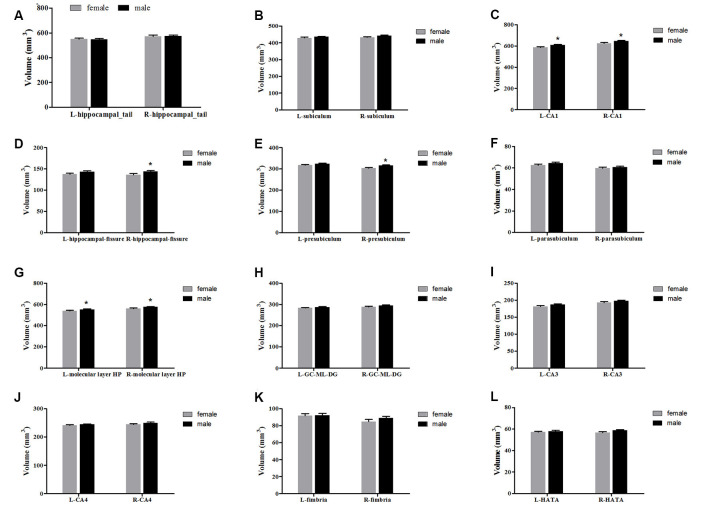
The hippocampus is known to be comprised of several subfields, but the developmental trajectories of these subfields are under debate. In this study, we analyzed magnetic resonance imaging (MRI) data from a cross-sectional sample (198 healthy Chinese) using an automated segmentation tool to delineate the development of the hippocampal subregions from 6 to 26 years of age. We also examined whether gender and hemispheric differences influence the development of these subregions. For the whole hippocampus, the trajectory of development was observed to be an inverse-u. A significant increase in volume with age was found for most of the subregions, except for the L/R-parasubiculum, L/R-fimbria, and L-HATA. Gender-related differences were also found in the development of most subregions, especially for the hippocampal tail, CA1, molecular layer HP, GC-DG, CA3, and CA4, which showed a consistent increase in females and an early increase followed by a decrease in males. A comparison of the average volumes showed that the right whole hippocampus was significantly larger, along with the R-presubiculum, R-hippocampal-fissure, L/R-CA1, and L/R-molecular layer HP in males in comparison to females. Additionally, the average volume of the right hemisphere was shown to be significantly larger for the hippocampal tail, CA1, molecular layer HP, GC-DG, CA3, and CA4. However, for the presubiculum, parasubiculum, and fimbria, the left side was shown to be larger. In conclusion, the hippocampal subregions appear to develop in various ways from childhood to adulthood, with both gender and hemispheric differences affecting their development.
Keywords: MRI; development; gender; hippocampus; subregion.
Copyright © 2020 Mu, Yuan and Tan.
Conflict of interest statement
The authors declare that the research was conducted in the absence of any commercial or financial relationships that could be construed as a potential conflict of interest.
Figures
Similar articles
-
Longitudinal development of hippocampal subregions from childhood to adulthood.Dev Cogn Neurosci. 2018 Apr;30:212-222. doi: 10.1016/j.dcn.2018.03.009. Epub 2018 Mar 22. Dev Cogn Neurosci. 2018. PMID: 29597156 Free PMC article.
-
Hippocampal subfield CA2+3 exhibits accelerated aging in Alcohol Use Disorder: A preliminary study.Neuroimage Clin. 2019;22:101764. doi: 10.1016/j.nicl.2019.101764. Epub 2019 Mar 14. Neuroimage Clin. 2019. PMID: 30904825 Free PMC article.
-
Volumetric analysis of hippocampal subregions and subfields in left and right semantic dementia.Brain Commun. 2024 Mar 25;6(2):fcae097. doi: 10.1093/braincomms/fcae097. eCollection 2024. Brain Commun. 2024. PMID: 38572268 Free PMC article.
-
Deviations in Hippocampal Subregion in Older Adults With Cognitive Frailty.Front Aging Neurosci. 2021 Jan 13;12:615852. doi: 10.3389/fnagi.2020.615852. eCollection 2020. Front Aging Neurosci. 2021. PMID: 33519422 Free PMC article.
-
Development of hippocampal subfield volumes from 4 to 22 years.Hum Brain Mapp. 2014 Nov;35(11):5646-57. doi: 10.1002/hbm.22576. Epub 2014 Jun 30. Hum Brain Mapp. 2014. PMID: 24976170 Free PMC article.
Cited by
-
Associations between alcohol use and sex-specific maturation of subcortical gray matter morphometry from adolescence to adulthood: Replication across two longitudinal samples.Dev Cogn Neurosci. 2023 Oct;63:101294. doi: 10.1016/j.dcn.2023.101294. Epub 2023 Sep 3. Dev Cogn Neurosci. 2023. PMID: 37683327 Free PMC article.
-
Hippocampal subfield plasticity is associated with improved spatial memory.Commun Biol. 2024 Mar 5;7(1):271. doi: 10.1038/s42003-024-05949-5. Commun Biol. 2024. PMID: 38443439 Free PMC article. Clinical Trial.
-
Functional and Structural Alterations in Pediatric Multiple Sclerosis: A Systematic Review and a Preliminary Activation Likelihood Estimation Functional Magnetic Resonance Imaging Meta-Analysis.Pediatr Rep. 2025 May 13;17(3):57. doi: 10.3390/pediatric17030057. Pediatr Rep. 2025. PMID: 40407582 Free PMC article. Review.
-
Morphological characterization of the hippocampus: a first database in Ecuador.Front Hum Neurosci. 2024 Oct 18;18:1387212. doi: 10.3389/fnhum.2024.1387212. eCollection 2024. Front Hum Neurosci. 2024. PMID: 39494388 Free PMC article.
-
Variation in maternal sensitivity and the development of memory biases in preschoolers.Front Behav Neurosci. 2023 Feb 16;17:1093619. doi: 10.3389/fnbeh.2023.1093619. eCollection 2023. Front Behav Neurosci. 2023. PMID: 36873774 Free PMC article.
References
-
- Bramen J. E., Hranilovich J. A., Dahl R. E., Forbes E. E., Chen J., Toga A. W., et al. . (2011). Puberty influences medial temporal lobe and cortical gray matter maturation differently in boysthan girls matched for sexual maturity. Cereb. Cortex 21, 636–646. 10.1093/cercor/bhq137 - DOI - PMC - PubMed
LinkOut - more resources
Full Text Sources
Research Materials
Miscellaneous