. 2020 Dec 4:14:588943.
doi: 10.3389/fncom.2020.588943. eCollection 2020.

Evaluation of Synergy Extrapolation for Predicting Unmeasured Muscle Excitations from Measured Muscle Synergies

Affiliations

Evaluation of Synergy Extrapolation for Predicting Unmeasured Muscle Excitations from Measured Muscle Synergies

Di Ao et al. Front Comput Neurosci. .

Abstract

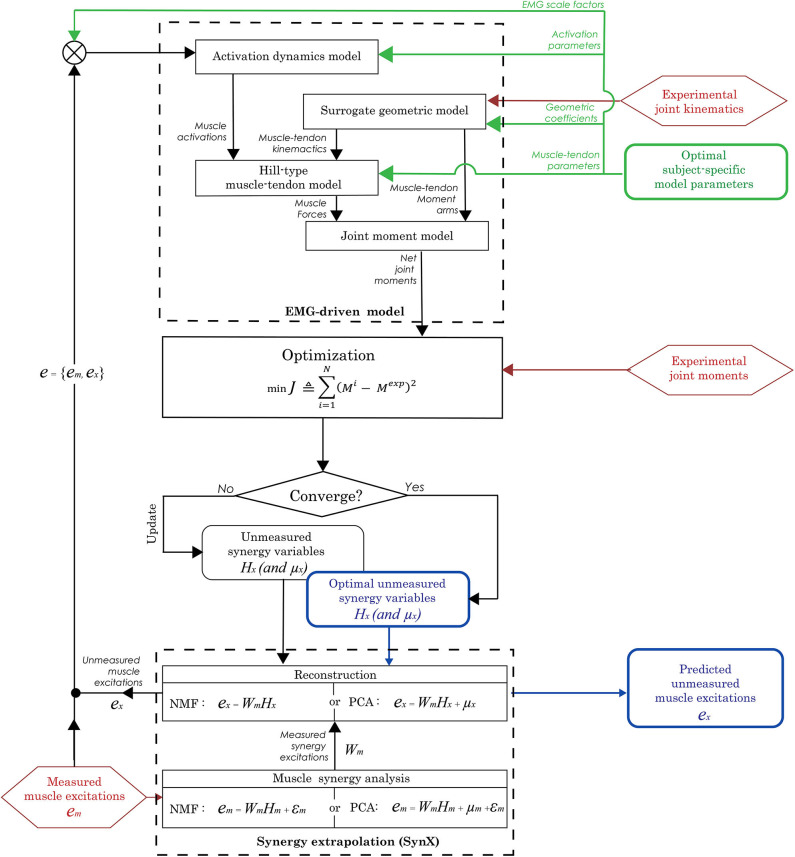
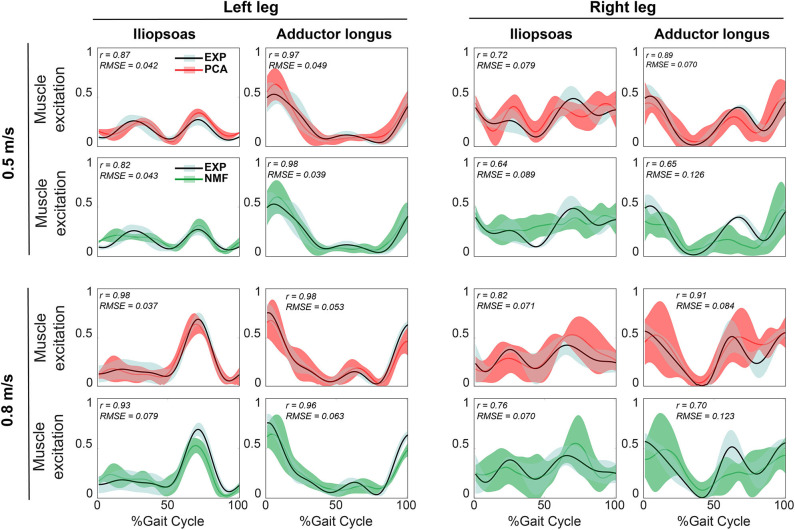
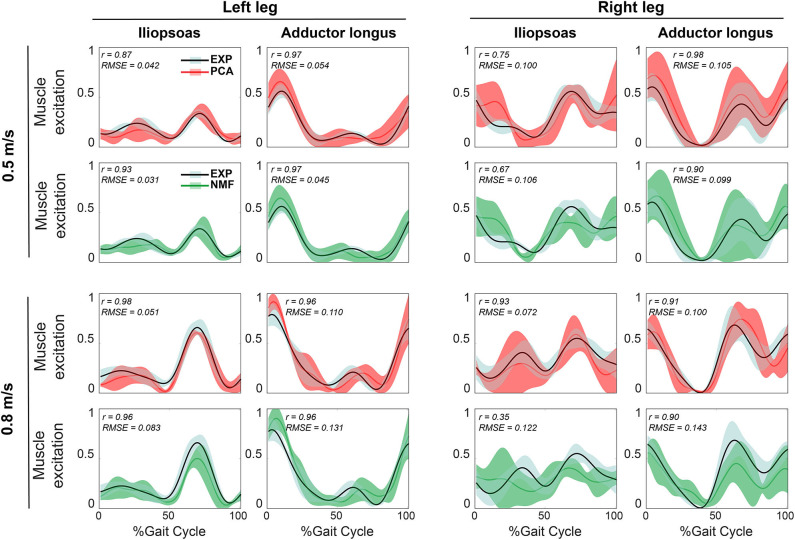
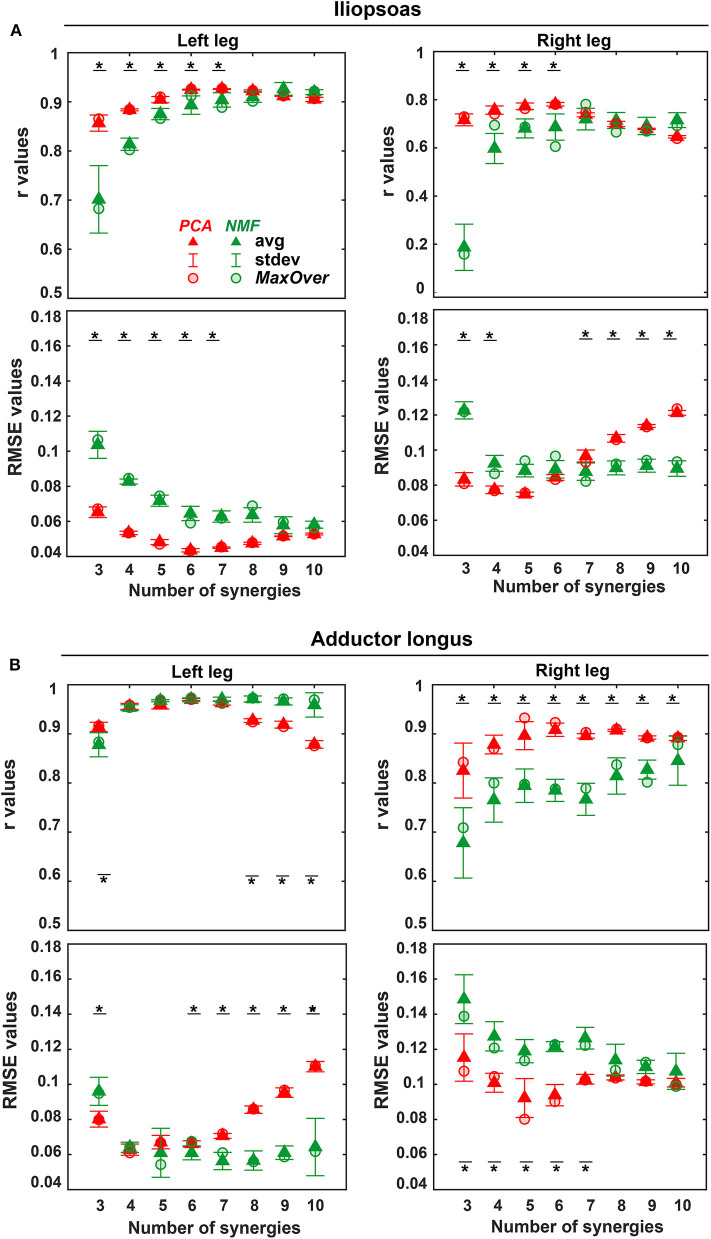
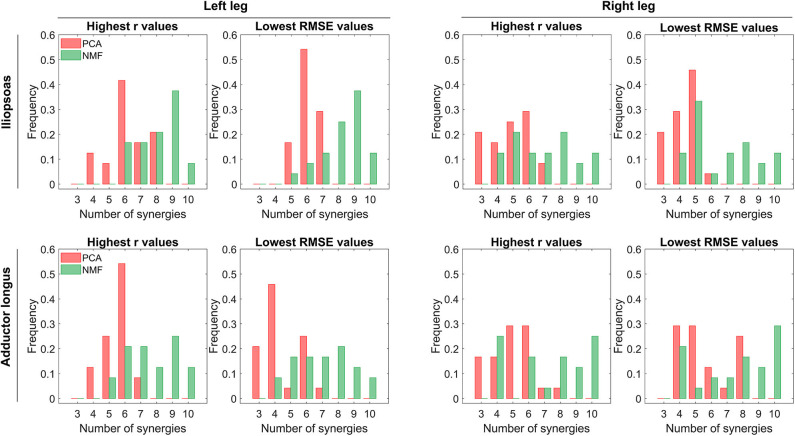
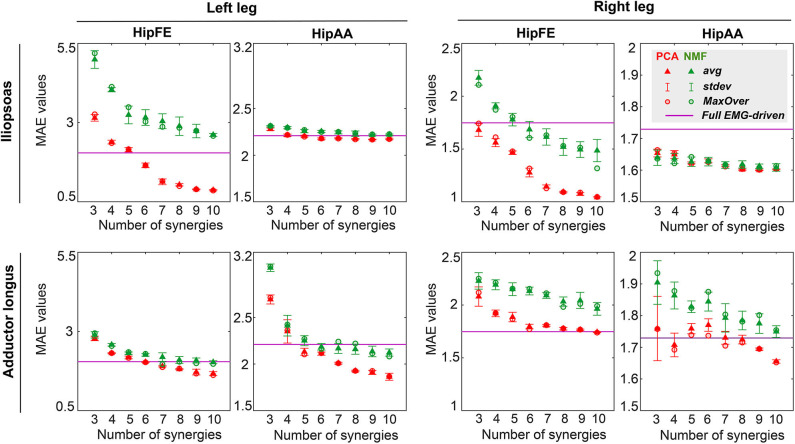
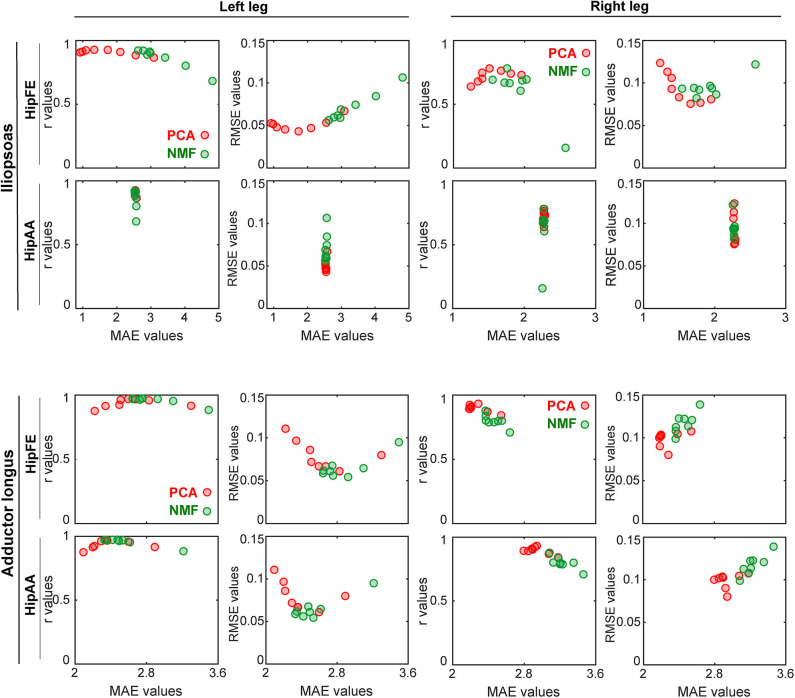
Electromyography (EMG)-driven musculoskeletal modeling relies on high-quality measurements of muscle electrical activity to estimate muscle forces. However, a critical challenge for practical deployment of this approach is missing EMG data from muscles that contribute substantially to joint moments. This situation may arise due to either the inability to measure deep muscles with surface electrodes or the lack of a sufficient number of EMG channels. Muscle synergy analysis (MSA) is a dimensionality reduction approach that decomposes a large number of muscle excitations into a small number of time-varying synergy excitations along with time-invariant synergy weights that define the contribution of each synergy excitation to all muscle excitations. This study evaluates how well missing muscle excitations can be predicted using synergy excitations extracted from muscles with available EMG data (henceforth called "synergy extrapolation" or SynX). The method was evaluated using a gait data set collected from a stroke survivor walking on an instrumented treadmill at self-selected and fastest-comfortable speeds. The evaluation process started with full calibration of a lower-body EMG-driven model using 16 measured EMG channels (collected using surface and fine wire electrodes) per leg. One fine wire EMG channel (either iliopsoas or adductor longus) was then treated as unmeasured. The synergy weights associated with the unmeasured muscle excitation were predicted by solving a nonlinear optimization problem where the errors between inverse dynamics and EMG-driven joint moments were minimized. The prediction process was performed for different synergy analysis algorithms (principal component analysis and non-negative matrix factorization), EMG normalization methods, and numbers of synergies. SynX performance was most influenced by the choice of synergy analysis algorithm and number of synergies. Principal component analysis with five or six synergies consistently predicted unmeasured muscle excitations the most accurately and with the greatest robustness to EMG normalization method. Furthermore, the associated joint moment matching accuracy was comparable to that produced by initial EMG-driven model calibration using all 16 EMG channels per leg. SynX may facilitate the assessment of human neuromuscular control and biomechanics when important EMG signals are missing.

Keywords: EMG normalization; EMG-driven modeling; muscle excitation; muscle synergy; non-negative matrix factorization (NMF); principal component analysis (PCA); stroke.


Conflict of interest statement

The authors declare that the research was conducted in the absence of any commercial or financial relationships that could be construed as a potential conflict of interest.

Figures

Figure 1
Figure 1
Flowchart of the synergy extrapolation (SynX) process using an EMG-driven model. Prior to performing SynX, we calibrated musculotendon model parameter values in the EMG-driven model (green color) using a full set of 16 EMG signals per leg, collected using surface and fine wire electrodes. Then one fine wire EMG signal (either iliopsoas or adductor longus) was treated as unmeasured and predicted using SynX. The unknown synergy vector weights Hx in both PCA and NMF and offsets μx in PCA for the unmeasured muscle excitation were predicted by solving a non-linear optimization problem where the errors between inverse dynamics and EMG-driven joint moments were minimized while all musculotendon model parameters were held constant at the calibrated values.
Figure 2
Figure 2
Representative results of reconstructed unmeasured muscle excitations across all calibration walking trials at the same speed using SynX (black line: average experimental curve; red line: PCA-based SynX; green line: NMF-based SynX; shaded area: ±1 standard deviation). Measured synergy excitations were calculated using the MaxOver EMG normalization method with six synergies. Results are reported over the complete gait cycle where 0% is heel strike and 100% is subsequent heel strike of the same leg (left leg: non-paretic, right leg: paretic). r and RMSE values were computed between average experimental and SynX-predicted muscle excitations.
Figure 3
Figure 3
Representative results of average reconstructed unmeasured muscle excitations across all evaluation walking trials at the same speed using SynX (black line: average experimental curve; red line: PCA-based SynX; green line: NMF-based SynX; shaded area: ±1 standard deviation). Measured synergy excitations were calculated using the MaxOver EMG normalization method with six synergies. Results are reported over the complete gait cycle where 0% is heel strike and 100% is subsequent heel strike of the same leg (left leg: non-paretic, right leg: paretic). r and RMSE values were computed between average experimental and SynX-predicted muscle excitations.
Figure 4
Figure 4
Average (triangles) and standard deviation of r and RMSE values for the reconstruction of iliopsoas (A) and adductor longus (B) muscle excitations across all trials (including both calibration trials and evaluation trials) and across all 5 EMG normalization methods for both legs (left leg: non-paretic, right leg: paretic) using three to 10 synergies (red: PCA-based SynX; green: NMF-based SynX. Red circular (PCA) and green circular (NMF) markers show average values across all trials using MaxOver normalization. A black bar with a star represents a statistically significant difference (p < 0.05) between PCA and NMF for the same number of synergies.
Figure 5
Figure 5
Distribution of the number of synergies that produce maximum r values or minimum RMSE values across all trials (including both calibration and evaluation) and all EMG normalization methods. In each histogram, the horizontal axis reports the number of synergies, and the vertical axis shows the frequency with which the number of synergies generates the best prediction of iliopsoas or adductor longus muscle excitation in terms of shape (indicated by r-values) and magnitude (indicated by RMSE-values). Red and green bars represent PCA-based and NMF-based synergy extrapolations, respectively. The left leg is non-paretic and the right leg is paretic.
Figure 6
Figure 6
Average (triangles) and standard deviation of mean absolute error (MAE) values for hip joint moment prediction across all trials (including both calibration and evaluation) and all EMG normalization methods as a function of the number of synergies for both legs (left leg: non-paretic, right leg: paretic). MAE values for joint moment prediction are presented for hip flexion/extension (HipFE) and hip adduction/abduction (HipAA). PCA- and NMF-based SynX results are indicated in red and green, respectively. The flat purple lines demonstrate the average MAE values for joint moment prediction with a full set of EMG signals for each leg. Red circular (PCA) and green circular (NMF) markers show average MAE values across all trials using MaxOver normalization.
Figure 7
Figure 7
Trade-offs between accuracy of joint moment tracking (MAE values on horizontal axis) and accuracy of unmeasured muscle excitation reconstruction (r or RMSE values on vertical axis) when using MaxOver as the EMG normalization method (red markers: PCA-based SynX; green markers: NMF-based SynX; HipFE: hip flexion/extension; HipAA: hip adduction/abduction). The left leg is non-paretic and the right leg is paretic.

Similar articles

Cited by

References

    1. Ackermann M., van den Bogert A. J. (2010). Optimality principles for model-based prediction of human gait. J. Biomech. 43, 1055–1060. 10.1016/j.jbiomech.2009.12.012 - DOI - PMC - PubMed
    1. Ajiboye A. B., Weir R. F. (2009). Muscle synergies as a predictive framework for the EMG patterns of new hand postures. J. Neural Eng. 6:36004. 10.1088/1741-2560/6/3/036004 - DOI - PMC - PubMed
    1. Allen J. L., Kautz S. A., Neptune R. R. (2013). The influence of merged muscle excitation modules on post-stroke hemiparetic walking performance. Clin. Biomech. 28, 697–704. 10.1016/j.clinbiomech.2013.06.003 - DOI - PMC - PubMed
    1. Allen J. L., Neptune R. R. (2012). Three-dimensional modular control of human walking. J. Biomech. 45, 2157–2163. 10.1016/j.jbiomech.2012.05.037 - DOI - PMC - PubMed
    1. Amarantini D., Martin L. (2004). A method to combine numerical optimization and EMG data for the estimation of joint moments under dynamic conditions. J. Biomech. 37, 1393–1404. 10.1016/j.jbiomech.2003.12.020 - DOI - PubMed