. 2020 Dec 3:12:588295.
doi: 10.3389/fnsyn.2020.588295. eCollection 2020.

Transient Enhanced GluA2 Expression in Young Hippocampal Neurons of a Fragile X Mouse Model

Affiliations

Transient Enhanced GluA2 Expression in Young Hippocampal Neurons of a Fragile X Mouse Model

Tue G Banke et al. Front Synaptic Neurosci. .

Abstract

AMPA-type glutamate receptors (AMPARs) are tetrameric ligand-gated channels made up of combinations of GluA1-4 subunits and play important roles in synaptic transmission and plasticity. Here, we have investigated the development of AMPAR-mediated synaptic transmission in the hippocampus of the Fmr1 knock-out (KO) mouse, a widely used model of Fragile X syndrome (FXS). FXS is the leading monogenic cause of intellectual disability and autism spectrum disorders (ASD) and it is considered a neurodevelopmental disorder. For that reason, we investigated synaptic properties and dendritic development in animals from an early stage when synapses are starting to form up to adulthood. We found that hippocampal CA1 pyramidal neurons in the Fmr1-KO mouse exhibit a higher AMPAR-NMDAR ratio early in development but reverses to normal values after P13. This increase was accompanied by a larger presence of the GluA2-subunit in synaptic AMPARs that will lead to altered Ca2+ permeability of AMPARs that could have a profound impact upon neural circuits, learning, and diseases. Following this, we found that young KO animals lack Long-term potentiation (LTP), a well-understood model of synaptic plasticity necessary for proper development of circuits, and exhibit an increased frequency of spontaneous miniature excitatory postsynaptic currents, a measure of synaptic density. Furthermore, post hoc morphological analysis of recorded neurons revealed altered dendritic branching in the KO group. Interestingly, all these anomalies are transitory and revert to normal values in older animals. Our data suggest that loss of FMRP during early development leads to temporary upregulation of the GluA2 subunit and this impacts synaptic plasticity and altering morphological dendritic branching.

Keywords: FMR 1 gene; LTP (long term potentiation); NMDAR (NMDA receptor); circuit; dendritic spines and memory; fragile X mental retardation protein; glutamate receptor (AMPAR); synapses.


Conflict of interest statement

The authors declare that the research was conducted in the absence of any commercial or financial relationships that could be construed as a potential conflict of interest.

Figures
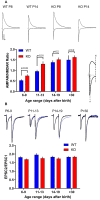
Figure 1
Figure 1
Amplitude of AMPA-type glutamate receptor (AMPAR) and NMDAR-mediated evoked postsynaptic currents (EPSCs) during development. (A) Developmental profile of the AMPA Receptor to NMDA Receptor ratio. Top, sample traces of evoked responses from CA1 pyramidal cells recorded in voltage-clamp at −60 mV or +40 mV from wild type (WT) and fragile X mental retardation protein (FMRP) knock-out (KO) slices as indicated. Scale bar = 50 ms and 50 pA. Bottom, population data of AMPAR to NMDAR ratio from WT neurons (blue bars) from slices P6–9 (n = 17), P11–13 (n = 42), P14–19 (n = 47), and P > 30 (n = 23). Red bars are from FMRP KO neurons from slices at same age groups (P6–9: n = 36; P11–13: n = 16; P14–19: n = 37; P > 30: n = 24). The amplitude of the AMPAR-mediated response was measured at the pick of the response at −60 mV. The amplitude of the NMDAR response was measured at +40 mV 80 ms after the stimulus artifact as indicated in the example on the right. Student’s t-test p-values are indicated in the figure. (B) Paired-pulse facilitation (PPR) in FMRP KO and WT CA1 neurons at different ages as indicated. Top, superimposed sample traces of evoked responses from CA1 pyramidal cells recorded in voltage-clamp at −60 mV from WT (thick line) and FMRP KO slices (blue line) as indicated. The traces were normalized to the first peak. PPR quantified as shown in the bar graph below, with the two stimuli delivered 50 ms apart (recorded at −60 mV). n values for WT neurons from P6–9 to P > 30 are: 10, 31, 36, 12. n-values for KO neurons from P6–9 to P > 30 are: 26, 10, 25, 14. No significant difference was found between WT and KO within age groups (p > 0.05).
Figure 2
Figure 2
Developmental subunit composition of synaptic AMPARs in the FMRP KO. (A) Sample traces of AMPAR EPSCs recorded at −60, 0, and +40 mV in the presence of 100 μM DL-2-Amino-5-phosphonopentanoic acid (APV) in CA1 neurons from FMRP KO or WT neurons as indicated. To the right are the same traces with amplitude normalized to −60 mV. Scale bar = 10 ms and 50 pA. (B) Normalized current-voltage plot from P6–9 and P14–19 neurons from KO (white dots; n = 13–22) and WT slices (black dots; n = 8–25). (C) Rectification Index (RI) was calculated as the ratio of responses at +40 mV and −60 mV for KO neurons (white dots) and WT neurons (black dots). n values for WT neurons from P6–9 to P > 30 are: 16, 17, 9, 5. n values for KO neurons from P6–9 to P > 30 are: 10, 11, 17, 10. Student’s t-test p-value comparing KO vs. WT at each specific age is indicated in the figure. (D) Blockade of AMPAR-mediated currents with PhTx-74. After a 5 min baseline, PhTx was applied to the perfusion bath. Then, 20 μM of the general AMPAR blocker NBQX was added to the bath. Effect of PhTx in slices P6–9 (top) and in P14–19 (bottom) in WT neurons (black dots; n = 6–8) and KO neurons (white dots; n = 7–8). (E) The fraction of PhTx-74 blockade measured at the 15–18 min time window in slices as indicated. The asterisk indicates p < 0.05 significant difference between P6–9 WT and KO. (F) The decay phase of AMPAR-mediated responses was fitted with a single exponential curve and the time constant (tau) was estimated. No significant differences between WT and KO neurons at each age group were observed.
Figure 3
Figure 3
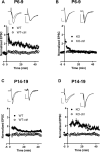
Long-term potentiation (LTP) of Schaffer collateral-CA1 synapses in FMRP KO during early development. (A–D) In the presence of a GABAA inhibitor, after obtaining a 5-min baseline, LTP was induced in CA3-CA1 synapses by stimulation of Schaffer collaterals by stimulating the axons at 3 Hz for 2 min while clamping the cell at 0 mV (black dots). A second stimulation electrode was used as a control (white dots). This protocol readily induced LTP in WT P6–9 slices (A; n = 8) and P14–19 slices (C; n = 13). (B,D) LTP induction in KO slices P6–9 (B; n = 12) and KO slices P14–19 (D; n = 7). Insets are examples of evoked EPSCs from the baseline period and 40 min after LTP induction. The left pair of traces are from the test path and the right are from the control path. Scale bars 10 ms and 50 pA.
Figure 4
Figure 4
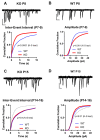
Spontaneous miniature EPSCs in FMRP KO slices. (A–D) Cumulative distribution of Inter-Event Intervals (A,C) of spontaneous events in CA1 neurons recorded at −60 mV in the presence of TTX and the amplitude of those events (B,D) from WT (blue line; n = 19–29) or FMRP KO slices (n = 31–31). (A,B) P6–9. (C,D) P14–16. Kolmogorov-Smirnov (K-S) test p-value is shown in the figure. For comparison, superimposed on Figure C is WT P6-9 (dotted black line; from A). Note the large increase in frequency of mEPSCs (decrease in Inter-Event Intervals) and in the amplitude of those events in KO neurons from slices P6-9. On top of each graph are shown 10 superimposed 250 ms long mEPSC events of KO P8 (A), WT P8 (B), KO P15 (C), and WT P15 (D). Scale bars: X-axis: 20 ms; Y-axis: 20 pA.
Figure 5
Figure 5
Development of dendritic branching in FMRP KO CA1 neurons. (A) Examples of skeleton drawings of CA1 neurons from slices as indicated. Neurons were backfilled with biotin for post hoc morphological analysis. Scale bar = 50 μm. (B) Sholl analysis indicating the average number of intersections of apical dendrites (left) or basal dendrites (right) with concentric circles spaced 10 μm apart from P6–9 or P14–19 pyramidal neurons from either FMRP KO slices (red line; n = 23 and n = 27, respectively) or WT slices (blue line; n = 21 and n = 17, respectively). Asterisks indicate p < 0.05 t-test statistical significance when comparing WT and KO slices within a particular age group.
Figure 6
Figure 6
Development of dendritic branches in CA1 pyramidal neurons in FMRP KO mice. (A) Total length of dendritic branches in CA1 neurons either WT (black bars) or FMRP KO (white bars). The length of apical or basal dendrites was measured in slices either P6–9 (left) or slice P14–19 (right). The Student’s t-test shows no significance between WT and FMRP KO neurons within the different age groups or types of the dendrite. (Right) Length of dendritic branches broken down into primary dendrite from CA1 neurons as indicated. (B) Distance from soma to average all (left) or first (right) branching point in CA1 neurons from either WT (black bars) or FMRP KO (white bars) from slices P6–9 or slices P14–19 as indicated in Figure. The Student’s t-test shows significance (p < 0.05) between WT and FMRP KO neurons within the different age groups for the first branch point. n.s.: not significant.
Figure 7
Figure 7
Development of dendritic spines in FMR1 KO CA1 neurons. (A) Sample images of apical dendrites with spines from WT and FMRP KO neurons as indicated in the figure. A total of 17–21 KO and 23–27 WT neurons were analyzed for spine morphology in the P6–9 and P14–19 groups, respectively. The scale bar is shown in the upper left is 20 μm. (B) Spine density in WT CA1 neurons (black bars) or FMRP KO neurons (white bars) from slices P6–9 or P14–19 as indicated. The asterisk indicates significance using one-way ANOVA (F(1.959,15.67) = 8.663) with Tukey post hoc analysis. (C) Spine head diameter from CA1 neurons as in panel (B). (D) Spine length from CA1 neurons as in panel (B). Asterisk indicates statistical significance (one-way ANOVA F(F1.872,14.35) = 6.831).

Similar articles

Cited by

References

    1. Achuta V. S., Möykkynen T., Peteri U.-K., Turconi G., Rivera C., Keinänen K., et al. . (2018). Functional changes of AMPA responses in human induced pluripotent stem cell-derived neural progenitors in fragile x syndrome. Sci. Signal. 11:eaan8784. 10.1126/scisignal.aan8784 - DOI - PubMed
    1. Anggono V., Clem R. L., Huganir R. L. (2011). PICK1 loss of function occludes homeostatic synaptic scaling. J. Neurosci. 31, 2188–2196. 10.1523/JNEUROSCI.5633-10.2011 - DOI - PMC - PubMed
    1. Ashley C. T., Jr., Wilkinson K. D., Reines D., Warren S. T. (1993). FMR1 protein: conserved RNP family domains and selective RNA binding author. Science 262, 563–566. 10.1126/science.7692601 - DOI - PubMed
    1. Bagni C., Oostra B. A. (2013). Fragile X syndrome: from protein function to therapy. Am. J. Med. Genet. A 161, 2809–2821. 10.1002/ajmg.a.36241 - DOI - PubMed
    1. Bagni C., Zukin R. S. (2019). A synaptic perspective of fragile X syndrome and autism spectrum disorders. Neuron 101, 1070–1088. 10.1016/j.neuron.2019.02.041 - DOI - PMC - PubMed