. 2020 Dec 3:12:576682.
doi: 10.3389/fnagi.2020.576682. eCollection 2020.

Aberrant Amplitude of Low-Frequency Fluctuations in Different Frequency Bands in Patients With Parkinson's Disease

Affiliations

Aberrant Amplitude of Low-Frequency Fluctuations in Different Frequency Bands in Patients With Parkinson's Disease

Zhaoxiu Wang et al. Front Aging Neurosci. .

Abstract

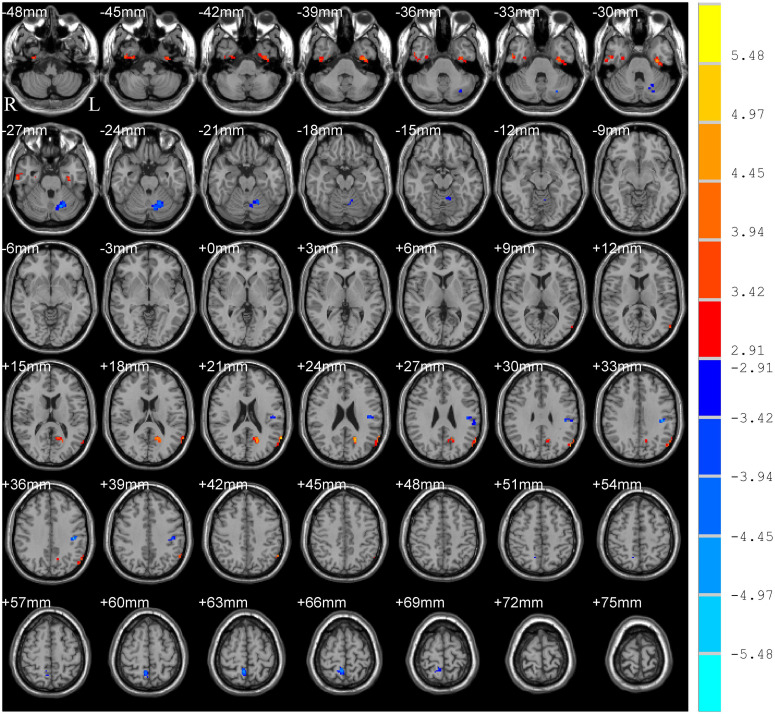
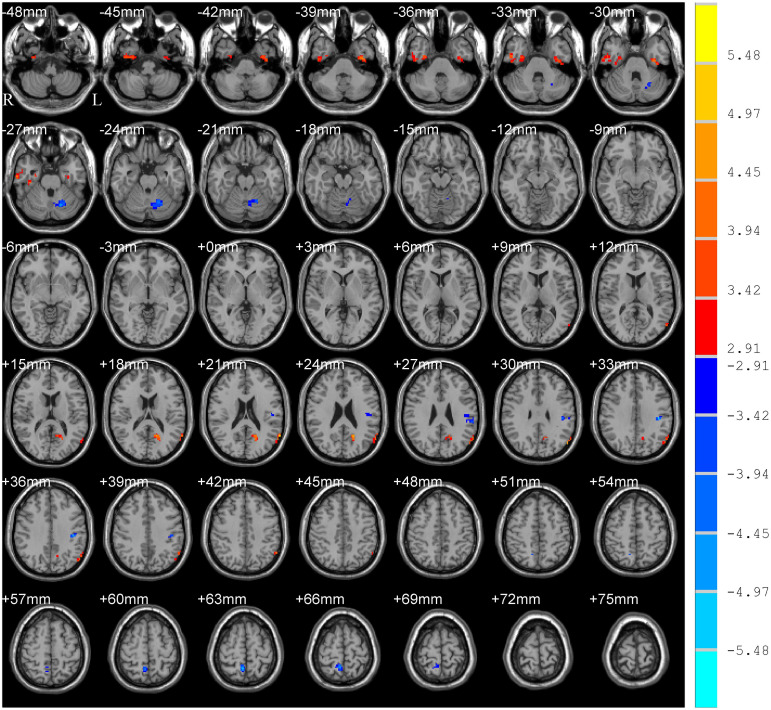
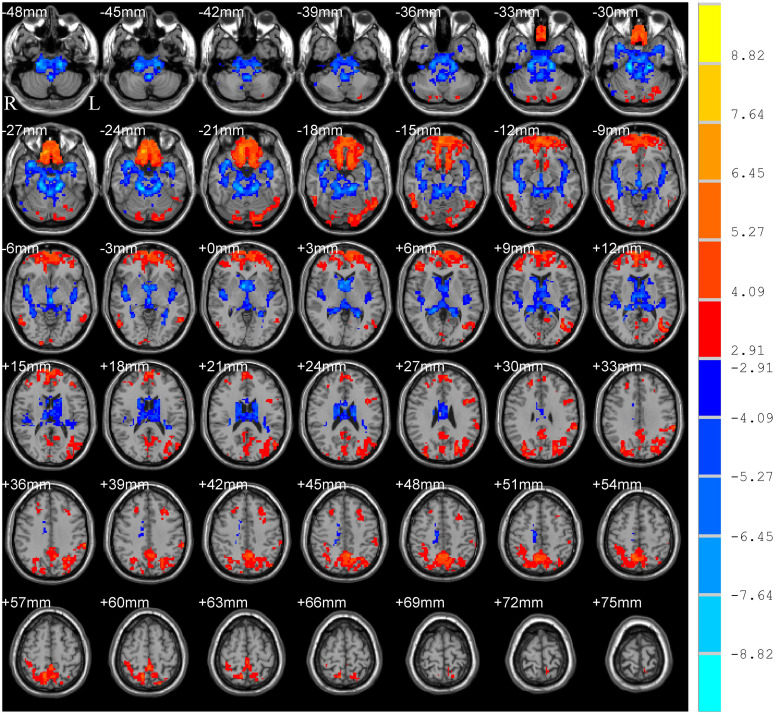
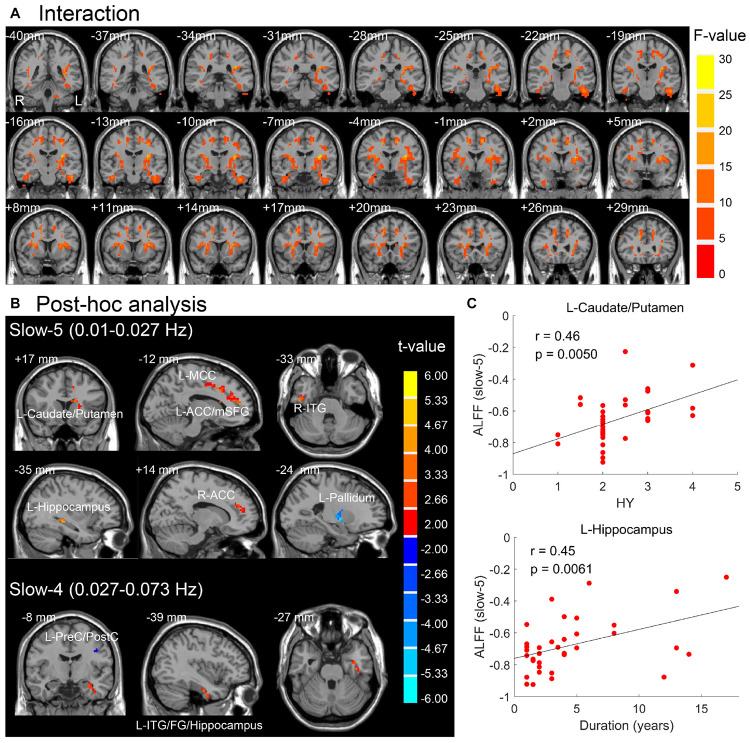
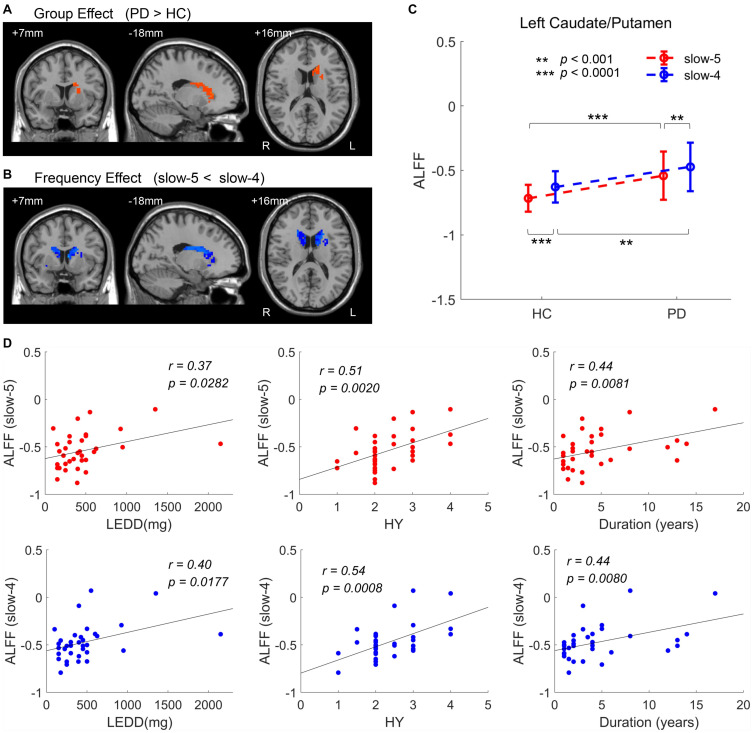
Previous studies reported abnormal spontaneous neural activity in Parkinson's disease (PD) patients using resting-state functional magnetic resonance imaging (R-fMRI). However, the frequency-dependent neural activity in PD is largely unknown. Here, 35 PD patients and 35 age- and education-matched healthy controls (HCs) underwent R-fMRI scanning to investigate abnormal spontaneous neural activity of PD using the amplitude of low-frequency fluctuation (ALFF) approach within the conventional band (typical band: 0.01-0.08 Hz) and specific frequency bands (slow-5: 0.010-0.027 Hz and slow-4: 0.027-0.073 Hz). Compared with HCs, PD patients exhibited increased ALFF in the parieto-temporo-occipital regions, such as the bilateral inferior temporal gyrus/fusiform gyrus (ITG/FG) and left angular gyrus/posterior middle temporal gyrus (AG/pMTG), and displayed decreased ALFF in the left cerebellum, right precuneus, and left postcentral gyrus/supramarginal gyrus (PostC/SMG) in the typical band. PD patients showed greater increased ALFF in the left caudate/putamen, left anterior cingulate cortex/medial superior frontal gyrus (ACC/mSFG), left middle cingulate cortex (MCC), right ITG, and left hippocampus, along with greater decreased ALFF in the left pallidum in the slow-5 band, whereas greater increased ALFF in the left ITG/FG/hippocampus accompanied by greater decreased ALFF in the precentral gyrus/PostC was found in the slow-4 band (uncorrected). Additionally, the left caudate/putamen was positively correlated with levodopa equivalent daily dose (LEDD), Hoehn and Yahr (HY) stage, and disease duration. Our results suggest that PD is related to widespread abnormal brain activities and that the abnormalities of ALFF in PD are associated with specific frequency bands. Future studies should take frequency band effects into account when examining spontaneous neural activity in PD.

Keywords: Parkinson’s disease; amplitude of low-frequency fluctuation; frequency band; resting-state functional MRI; spontaneous brain activity.


Conflict of interest statement

The authors declare that the research was conducted in the absence of any commercial or financial relationships that could be construed as a potential conflict of interest.

Figures

FIGURE 1
FIGURE 1
T-map of ALFF differences in the typical band (0.01–0.08 Hz). The results were obtained by two-sample t-test [GRF corrected, voxel p < 0.005, cluster p < 0.05, threshold of t > 2.91, and cluster size >46 voxels (1,242 mm3)]. The color bar on the right indicates statistical t-value. Warm (cold) overlays indicate higher (lower) ALFF in PD patients. L/R, left/right.
FIGURE 2
FIGURE 2
Main effect of group on ALFF. The results were obtained by two-way repeated-measures ANOVA [GRF corrected, voxel p < 0.005, cluster p < 0.05, threshold of t > 2.91, and cluster size >46 voxels (1,242 mm3)]. The color bar on the right indicates statistical t-value. Warm (cold) overlays indicate higher (lower) ALFF in PD patients. L/R, left/right.
FIGURE 3
FIGURE 3
Main effect of frequency band on ALFF. The results were obtained by two-way repeated-measures ANOVA [GRF corrected, voxel p < 0.005, cluster p < 0.05, threshold of t > 2.91, and cluster size >39 voxels (1,053 mm3)]. The color bar on the right indicates statistical t-value. Warm (cold) overlays indicate higher (lower) ALFF in slow-5 band than in slow-4. L/R, left/right.
FIGURE 4
FIGURE 4
(A) Interaction effect between group and frequency band (p < 0.05, F > 3.98, uncorrected). (B) Post hoc two-sample t-test for slow-5 and slow-4 (voxel p < 0.05, threshold of t > 2.00, uncorrected). Warm (cold) overlays indicate higher (lower) ALFF in PD than in HC. (C) Significant correlations between mean ALFF of brain regions in panel (B) and clinical assessments (FDR corrected, p < 0.05). L/R, left/right; ACC/MCC, anterior/middle cingulate cortex; mSFG, medial superior frontal gyrus; ITG, inferior temporal gyrus; FG, fusiform gyrus; PreC/PostC, precentral/postcentral gyrus; HY, Hoehn and Yahr scale.
FIGURE 5
FIGURE 5
ANOVA within the bilateral caudate/putamen. (A) Group effect [GRF corrected, voxel p < 0.05, cluster p < 0.05, threshold of t > 2.00, and cluster size >69 voxels (1,863 mm3)]. (B) Frequency effect [GRF corrected, voxel p < 0.05, cluster p < 0.05, threshold of t > 2.00, and cluster size >50 voxels (1,350 mm3)]. (C) ALFF of two groups within the significant region of group effect, the left caudate/putamen. (D) Clinical correlations within the significant region of group effect (the left caudate/putamen) (FDR corrected, p < 0.05). L/R, left/right; LEDD, levodopa equivalent daily dose; HY, Hoehn and Yahr scale. **p < 0.001, ***p < 0.0001.

Similar articles

Cited by

References

    1. Albrecht F., Ballarini T., Neumann J., Schroeter M. L. (2019). FDG-PET hypometabolism is more sensitive than MRI atrophy in Parkinson’s disease: a whole-brain multimodal imaging meta-analysis. Neuroimage Clin. 21:101594. 10.1016/j.nicl.2018.11.004 - DOI - PMC - PubMed
    1. Ashburner J. (2007). A fast diffeomorphic image registration algorithm. Neuroimage 38 95–113. 10.1016/j.neuroimage.2007.07.007 - DOI - PubMed
    1. Baria A. T., Baliki M. N., Parrish T., Apkarian A. V. (2011). Anatomical and functional assemblies of brain BOLD oscillations. J. Neurosci. 31 7910–7919. 10.1523/JNEUROSCI.1296-11.2011 - DOI - PMC - PubMed
    1. Buzsaki G., Draguhn A. (2004). Neuronal oscillations in cortical networks. Science 304 1926–1929. 10.1126/science.1099745 - DOI - PubMed
    1. Cavanna A. E., Trimble M. R. (2006). The precuneus: a review of its functional anatomy and behavioural correlates. Brain 129 564–583. 10.1093/brain/awl004 - DOI - PubMed

LinkOut - more resources